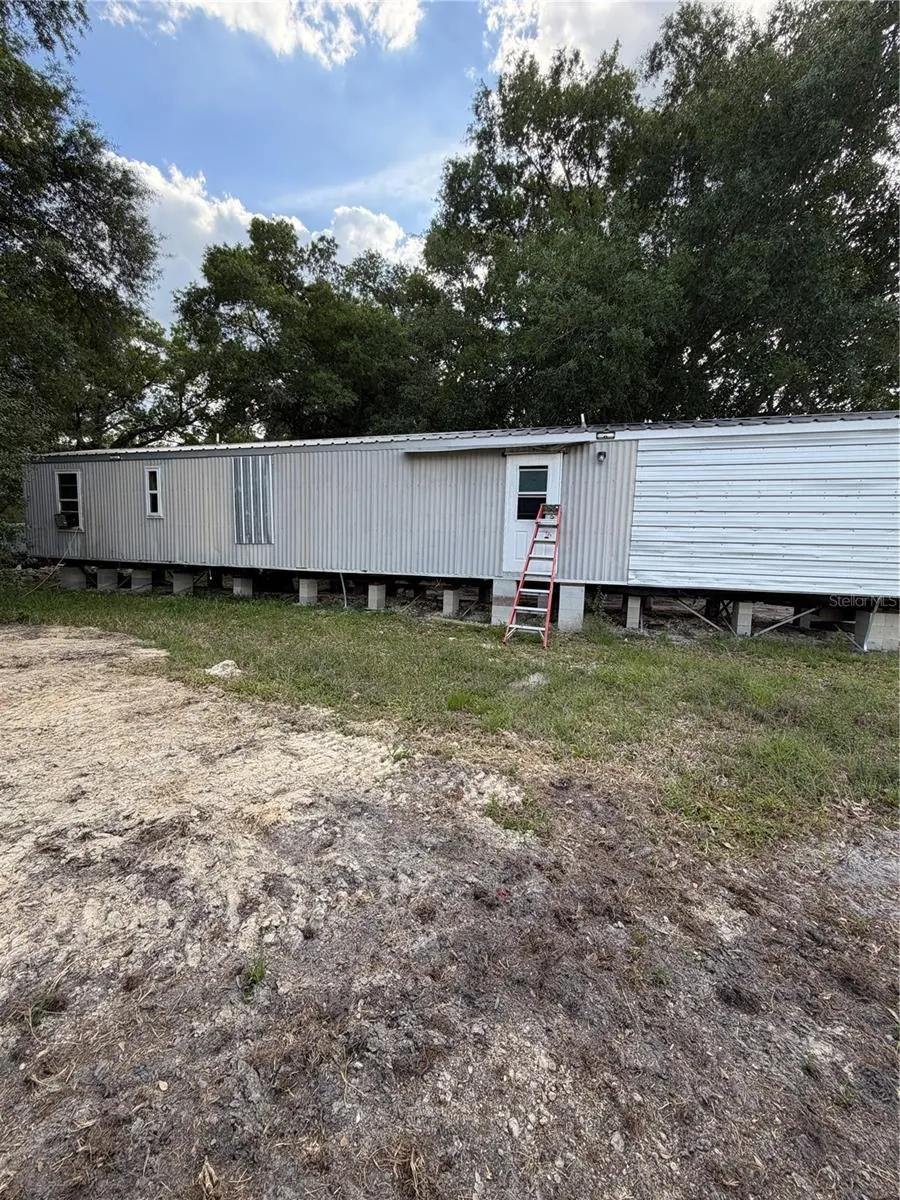
1059 NE Sugar Babe Rd · Southeast Arcadia, FL
Flood risk 1/10 · Minimal
- FEMA flood zone
- X (unshaded)
- Chance of flooding over 30 yrs
- 0.0%
- Est. flood insurance / yr
- $507 – $1,088
Fire risk 4/10 · Minor
- Est. fire insurance / yr
- $947 – $1,759
Heat risk 9/10 · Severe
- Hot days now (above 107°F)
- 7 days/yr
- Hot days in 30 yrs
- 26 days/yr
Wind risk 10/10 · Severe
- Chance of severe wind over 30 yrs
- 99.0%
Air-quality risk 2/10 · Minimal
- Unhealthy air days now
- 1 days/yr
- Unhealthy air days in 30 yrs
- 2 days/yr
Risk factors via First Street. Map © Google.
Why this score? — see what drove the C- grade
The composite is a weighted blend of 9 inputs, each scored 0–100. Each bar is that input's sub-score; the figure is the points it added to the 100-point composite (weight × sub-score).
- Cash flow +21.4/30.0
- ARV discount +7.5/15.0
- DSCR +6.8/10.0
- 1% rule +4.4/10.0
- Livability +2.8/5.0
- Schools +2.6/10.0
- Rent growth +2.5/5.0
- Condition / age +2.5/5.0
- Appreciation +0.0/10.0
$150,000
🖨 Deal sheet 📄 Offer letter ✓ Due diligence
Listing remarks
Solid investment property featuring a 2 bedroom, 2 bathroom mobile home situated on a spacious half-acre lot. Property offers strong rental potential with room for future improvements, expansion, or redevelopment.
Key facts
- 0.5 acre lot
- Built 1995
- Listed 53 days
Property features AI
Finance
- Other: Unfurnished; Living area 960 square feet
- Financial info: No lease restrictions; Property is residential
- HOA & community: No HOA/association
Exterior
- Parking: No parking details provided
- Security: No security features listed
- Utilities: Well required for water; Septic tank; Other utilities
- Home design: Manufactured home (single wide); One story; Faces south
- Construction: Metal roof; Other construction materials; Other foundation details; Built as a manufactured home
- Exterior features: Paved road access; Half-acre lot
Interior
- Kitchen: No appliances listed
- Bedrooms: 2 bedrooms
- Flooring: Vinyl flooring
- Bathrooms: 2 full bathrooms
- Heating & cooling: No heating; No cooling
- Interior features: Other interior features
- Laundry & utility: No laundry facilities
Neighborhood map
What this means for you Summary
Snapshot
- This is a 2-bed/2.0-bath other listed at $150k.
Deal economics
- At list price, monthly cash flow is $223 ($3k/yr) — positive.
- The deal already cash-flows at list — no discount required.
- To meet the 1% rule (rent ≥ 1% of price), the offer needs to be $140k (6.4% below list).
- Recommended offer: $140k (6.4% below list) — sets the bar for 1% rule.
- Cap rate 8.1% vs local median 2.3% in Southeast Arcadia — top-decile yield for the area; either an underpriced asset or a hidden risk that comps aren't pricing in. Stress-test before assuming the spread holds.
Location & tenants
- Location reads 56/100 on livability (#864 in FL) — a working-class tenant base; expect higher turnover. Strengths: cost of living A+, housing A; Watch: crime C-, schools F, amenities F.
- Desoto (town): math 31% / reading 32% proficiency, ranked #69 of 73 in FL (top 94%) — families likely to look elsewhere, expect single-tenant / working-renter base with shorter leases; 71% free/reduced lunch — lower-income household profile, screen leases tightly.
- Market conditions: 207 active listings in the ZIP; 71 units permitted in DeSoto County in 2024 (0 in 5+ unit buildings).
Forward outlook
- Local home prices are declining (-3.0%/yr); year-one equity from $1k of loan paydown is wiped out by about $4k of value loss. Plan a longer hold.
- DeSoto County population projected at -10% by 2050 — secular population decline; favor cash flow + early exit over multi-decade hold.
Negotiation context
- It's been on market 53 days — a 3% lower offer ($146k) is reasonable based on typical stale-listing flexibility.
- Current owner paid $13k; list at $150k implies a 1054% gain — meaningful room to come down on a strong offer.
Risks & watch-outs
- Climate carrying-cost: severe wind risk, 99% chance of damaging wind over 30y; extreme-heat days projected 7→26/yr by 2055 (HVAC capex compounding) — expect insurance premiums to compound above CPI over the hold.
Questions for the listing agent
- It's been on market 53 days. Have you received any prior offers? Is the seller open to a 6% concession, seller financing, or rate buy-down credit?
- Is there a deadline driving the sale (1031 exchange, divorce, estate, relocation)? That informs how much negotiation room exists.
- Schools are F-rated, which usually means shorter tenancies and higher turnover. Who's the typical renter profile here, and what's been the actual vacancy rate?
- What's the average days-on-market for RENTAL listings here right now (not sales)? A rising rental-DOM trend means longer vacancies and softer asking-rent achievability than the comps imply.
- What's the recent tenant-quality profile in this submarket — average credit score on applications, eviction rate, late-payment / NSF rate, and stable-employment percentage? A property-management company in the area should have these aggregated.
- How much new for-sale + rental construction is in the pipeline within 1–3 miles? Heavy new supply typically softens prices + rents 12–24 months out; constrained supply supports both.
Investment metrics
- 1% rule
- 0.94% ✗
- Cap rate
- 8.08%
- Cash-on-cash
- 6.37%
- DSCR
- 1.28
- GRM
- 8.9
CMA / ARV
No comps found within radius.
Projected returns pro-forma
-3.0% appreciation · 3.0% rent growth · sell at horizon
- IRR
- -6.5%
- Equity multiple
- 0.76×
- Total profit
- $-10,184
- Equity at exit
- $22,365
- IRR
- 3.0%
- Equity multiple
- 1.22×
- Total profit
- $9,119
- Equity at exit
- $12,969
Cash invested: $42,000 (down + closing). Projections, not guarantees.
Landlord ↔ Tenant lean methodology
- Overall (STATE)
- 87 Strongly Landlord-Friendly
- State Florida
- 87 Strongly Landlord-Friendly · R+3
- County
- — inherits STATE
- City
- — inherits STATE
ZIP-level market 34266
- Home prices YoY
- -6.1%
- Active inventory
- 207
- Price-to-rent
- 8.9×
Monthly cashflow live
- Estimated rent
- $1,403 medium interval (Pro) →
- Mortgage (P&I)
- −$787
- Tax from tax record
- −$37 /mo · $440/yr
- Insurance
- −$62
- HOA
- −$0
- Vacancy / Maint / Mgmt
- −$295
- Net cashflow
- $223
Break-even live
UW: 25.0% down · 7.5% · 30yr · 1.5% tax · 5.0% vac · 8.0% maint · 8.0% mgmt
Financing live
Cash to close
- Down payment
- $37,500
- Closing costs
- $4,500
- Reserves months
- —
- Total cash needed
- —
Loan-product check · same deal, 3 products live
Conventional
25% down · 7.5% · 30yr
- Down + closing
- —
- Monthly P&I
- —
- Monthly cashflow
- —
- DSCR
- —
- Eligible?
- —
Personal DTI + credit; lowest rate.
DSCR
20% down · 8.5% · 30yr
- Down + closing
- —
- Monthly P&I
- —
- Monthly cashflow
- —
- DSCR
- —
- Eligible?
- —
No personal income docs; deal must DSCR.
Hard money
10% down · 12.0% · 12mo
- Down + closing
- —
- Monthly P&I
- —
- Monthly cashflow
- —
- DSCR
- —
- Eligible?
- —
Short-term bridge; refi at stabilization.
Listing history 16 events
-
2026-06-18days on market $150,000 Active 53 DOM
-
2026-06-17days on market $150,000 Active 52 DOM
-
2026-06-16days on market $150,000 Active 51 DOM
-
2026-06-15days on market $150,000 Active 50 DOM
-
2026-06-14days on market $150,000 Active 48 DOM
-
2026-06-13days on market $150,000 Active 47 DOM
-
2026-06-10days on market $150,000 Active 45 DOM
-
2026-06-09days on market $150,000 Active 44 DOM
-
2026-06-08days on market $150,000 Active 43 DOM
-
2026-06-07days on market $150,000 Active 42 DOM
-
2026-06-02days on market $150,000 Active 37 DOM
-
2026-06-01days on market $150,000 Active 36 DOM
-
2026-05-31days on market $150,000 Active 35 DOM
-
2026-05-30days on market $150,000 Active 34 DOM
-
2026-04-26$150,000 Active
-
2015-07-27soldstatus $13,000
ⓘ Source: listings_history table (triggers on properties + properties_extension) + one-shot
backfill from property_details.listing_events for pre-trigger history.
Tax reassessment forecast FL · Resets to sale price
- Current annual tax
- $440 · $37/mo
- Projected year-2 tax
- $1,245 · $104/mo
- Expected delta
- +$805/yr (+$67/mo · 183.1%)
ⓘ Screening estimate from a state-policy table — verify with the county assessor before closing.
Climate risk First Street
- Flood 1/10 Low FEMA zone X (unshaded) · 0% chance over 30 yrs
- Wildfire 4/10 Moderate
- Heat 9/10 Extreme 7 d/yr ≥107°F today · 26 d/yr by 30 yrs out
- Wind 10/10 Extreme 99% chance of damaging wind over 30 yrs
- Air quality 2/10 Low 1 unhealthy d/yr today · 2 by 30 yrs out
Nearby sold comps map
Loading sold comps map…
Walkable amenities ~0.75 mi
Loading nearby amenities…
Taxation est. · year 1
- Rental income
- $16,840
- − Mortgage interest
- −$8,402
- − Property taxes
- −$440
- − Insurance
- −$750
- − Repairs & maintenance
- −$1,347
- − Management
- −$1,347
- − Depreciation
- −$4,364
- Taxable income
- $190
- Est. tax owed @ 24.0%
- −$46
- After-tax cash flow
- $2,629/yr
For passive investors: Depreciation is non-cash, so a rental often shows a tax loss while cash-flowing — sheltering income. Rental losses are passive: they offset passive income freely, and up to $25,000/yr can offset ordinary (W-2) income if you actively participate and your MAGI is under $100k (phasing out to $0 by $150k); unused losses carry forward. On sale, claimed depreciation is recaptured at up to 25%, and gains may owe capital-gains tax (a 1031 exchange can defer both). Figures are a year-1 estimate at your 24.0% rate — not tax advice; consult a CPA.
Schools (NCES district)
- District
- Desoto
- NCES district ID
- 1200420
- Math proficiency
- 31% ▼ -9.00%
- Reading proficiency
- 32% ▼ -3.00%
- Median HH income
- $35,136
- Composite
- 26.03/100
- National rank
- #7305
- State rank
- #69 of 73 in FL
Livability — Southeast Arcadia
- Score
- 56/100
- State rank
- #864
- US rank
- #22423
Category grades
Schools grade is shown separately in the Schools card above.
Census & demographics
- Population (ZIP)
- 29,065
Population outlook (DeSoto County) Hauer SSP2
- Today (2025)
- 34,958 people
- By 2030
- 34,465 · -1.4%
- By 2040
- 33,137 · -5.2%
- By 2050
- 31,273 · -10.5%
- By 2075
- 23,898 · -31.6%
- By 2100
- 15,517 · -55.6%
Race, ethnicity, and origin ACS 2023
- Neighborhood character
- Diverse neighborhood (Simpson 0.61)
- Race & ethnicity
- White 51% Hispanic / Latino 34% Black 13% Two or more races 11%
- Hispanic origin (detail)
- Mexican 26% Puerto Rican 2% Cuban 2%
- Common ancestry
- Lithuanian 2% Italian 2% Slovak 1%
- Foreign-born
- 15% · Canada
- Languages at home
- 76% English-only · Spanish 22% French/Haitian/Cajun 1%
Political lean MEDSL · DeSoto
- 2024 margin
- Solid R (+42.9) · D 28.2% · R 71.2%
- 2008→2024 swing
- -30.6pp toward R · 2008: -12.3pp · 2024: -42.9pp
- All cycles
- 2024: R+42.9 2020: R+32.0 2016: R+27.7 2012: R+14.3 2008: R+12.3
Not yet ingested
- Civics
- —
Market trends
- HPI YoY
- ▼ -26.01%
- Current HPI
- 403.1509
- Rent YoY
- —
- Metro
- —
- State GDP YoY
- ▲ 3.28%
- F500 in state
- 36
Industry mix (Fortune 500 HQ in FL)
| Industry | F500 HQs | Revenue |
|---|---|---|
| Industrial Technology | 2 | $29B |
|
||
| Insurance | 2 | $17B |
|
||
| Retail | 1 | $60B |
|
||
| Technology Distribution | 1 | $58B |
|
||
| Homebuilding | 1 | $35B |
|
||
| Technology Manufacturing | 1 | $35B |
|
||
Price history
+1053.8% since first listed2 events — show timeline
- 2026-04-26 Listed $150,000 Stellar MLS as Distributed by MLS Grid
- 2015-07-27 Sold (Public Records) $13,000 Public Records
Property tax history
+7.7%/yrLatest (2025): $440 · +7.8% YoY. Source: county tax records.
Cash-flow waterfall
monthlySold comps — $/sqft
last 12 mo · ≤1 miLoading sold comps…