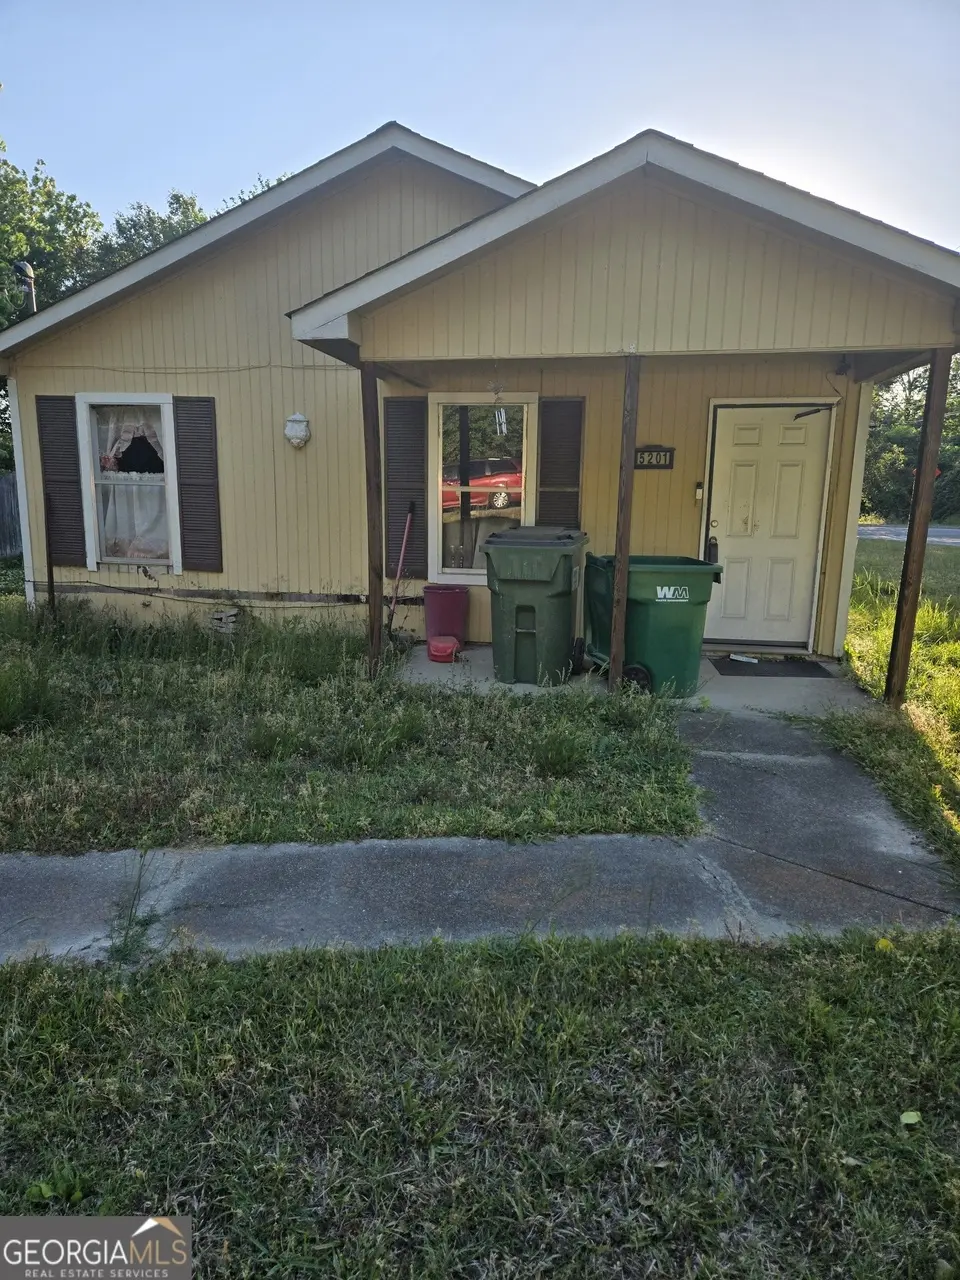
5201 Albert Dr · Forest Park, GA
Flood risk 3/10 · Minor
- FEMA flood zone
- X (unshaded)
- Chance of flooding over 30 yrs
- 0.2%
- Est. flood insurance / yr
- $507 – $1,088
Fire risk 1/10 · Minimal
- Est. fire insurance / yr
- $963 – $1,789
Heat risk 5/10 · Moderate
- Hot days now (above 104°F)
- 7 days/yr
- Hot days in 30 yrs
- 17 days/yr
Wind risk 6/10 · Moderate
- Chance of severe wind over 30 yrs
- 27.0%
Air-quality risk 4/10 · Minor
- Unhealthy air days now
- 4 days/yr
- Unhealthy air days in 30 yrs
- 7 days/yr
Risk factors via First Street. Map © Google.
Why this score? — see what drove the C+ grade
The composite is a weighted blend of 9 inputs, each scored 0–100. Each bar is that input's sub-score; the figure is the points it added to the 100-point composite (weight × sub-score).
- Cash flow +26.9/30.0
- ARV discount +12.6/15.0
- DSCR +9.3/10.0
- 1% rule +6.3/10.0
- Livability +3.2/5.0
- Condition / age +2.5/5.0
- Rent growth +2.3/5.0
- Schools +1.3/10.0
- Appreciation +0.0/10.0
$130,000
🖨 Deal sheet 📄 Offer letter ✓ Due diligence
Listing remarks
REDUCED!!! THIS IS AN INVESTOR SPECIAL!!! BRING YOUR VISION AND IDEAS FOR THIS 3 BEDROOM/1 BATHROOM RANCH ON A CORNER LOT, YOU CAN ADD ON, TEAR DOWN OR REBUILD, PLENTY OF OPPORTUNITIES!! MINUTES FROM THE AIRPORT AND I-285. AS IS, PROBATE SALE!!
Key facts
- Corner lot
- 2 parking spots
- Built 1988
Tags
Property features AI
Finance
- Other: Parcel number available; Located in LINDA HEIGHTS subdivision
- Financial info: Listing offered as-is; estate-owned; Cash offers
- HOA & community: No HOA; Community features include park and proximity to public transportation
Exterior
- Parking: Off-street parking; Parking pad; 2 parking spaces (total)
- Utilities: Public water; Public sewer; Sewer connected
- Home design: Single-family residence; House; One level; Resale property
- Construction: Built in 1988; Wood siding; Other construction materials; Composition roof; No basement
- Exterior features: Corner lot; Level lot
Interior
- Kitchen: No appliances listed
- Bedrooms: 3 bedrooms (all on the main level)
- Flooring: Vinyl flooring; Other flooring
- Bathrooms: 1 full bathroom (main level)
- Heating & cooling: Central heating; Ceiling fans; Window cooling units
- Interior features: Other interior features
- Laundry & utility: Laundry located in hall
Neighborhood map
What this means for you Summary
Snapshot
- This is a 3-bed/1.0-bath single-family listed at $130k.
Deal economics
- At list price, monthly cash flow is $359 ($4k/yr) — positive.
- The deal already cash-flows at list — no discount required.
- Meets the 1% rule at list price ($1k rent vs $130k).
- Recommended offer: $126k (3.0% below list) — sets the bar for market timing.
- Cap rate 9.6% vs local median 5.2% in Forest Park — top-decile yield for the area; either an underpriced asset or a hidden risk that comps aren't pricing in. Stress-test before assuming the spread holds.
Location & tenants
- Location reads 65/100 on livability (#209 in GA) — a middle-class / working-renter tenant base. Strengths: cost of living A+, housing A+, health & safety A-; Watch: crime F, commute F, employment D-.
- Clayton County (suburban): math 11% / reading 20% proficiency, ranked #155 of 174 in GA (top 89%) — low school quality limits family demand, transient renter base, plan for 1-2y turnover; 78% free/reduced lunch — lower-income household profile, screen leases tightly.
- Zoned schools: Fountain Elementary School (math 2% / reading 8%, grade F, #1,160 of 1,228 statewide, top 98%, 548 students, 90% FRL); Babb Middle School (math 24% / reading 34%, grade F, #249 of 470 statewide, top 55%, 888 students, 90% FRL); Forest Park High School (math 8% / reading 16%, grade F, #344 of 424 statewide, top 81%, 1,765 students, 90% FRL).
- Market conditions: Rents soft (-1.0%/yr); 128 active listings in the ZIP; 27 comparable units currently listed for rent nearby; rentals at typical pace (median 24d on market — plan ~3-4 weeks tenant-placement turnaround); 865 units permitted in Clayton County in 2024 (448 in 5+ unit buildings).
- This rent runs 39% of the median local income ($45k/yr) — at the standard rent-burdened threshold; future hikes will face affordability resistance.
Forward outlook
- Local home prices are declining (-3.0%/yr); year-one equity from $899 of loan paydown is wiped out by about $4k of value loss. Plan a longer hold.
- Clayton County population projected at +29% by 2050 — long-run rental-demand tailwind backs the buy-and-hold thesis.
Negotiation context
- It's been on market 47 days — a 3% lower offer ($126k) is reasonable based on typical stale-listing flexibility.
- Current owner paid $50k; list at $130k implies a 160% gain — meaningful room to come down on a strong offer.
Risks & watch-outs
- Climate carrying-cost: major wind risk, 27% chance of damaging wind over 30y; extreme-heat days projected 7→17/yr by 2055 (HVAC capex compounding) — expect insurance premiums to compound above CPI over the hold.
Questions for the listing agent
- It's been on market 47 days. Have you received any prior offers? Is the seller open to a 3% concession, seller financing, or rate buy-down credit?
- Is there a deadline driving the sale (1031 exchange, divorce, estate, relocation)? That informs how much negotiation room exists.
- Schools are F-rated, which usually means shorter tenancies and higher turnover. Who's the typical renter profile here, and what's been the actual vacancy rate?
- Crime grade is F in this area — have there been break-ins, vandalism, or insurance claims at this property in the last 3 years? What carrier currently insures it and at what premium?
- What's the average days-on-market for RENTAL listings here right now (not sales)? A rising rental-DOM trend means longer vacancies and softer asking-rent achievability than the comps imply.
- What's the recent tenant-quality profile in this submarket — average credit score on applications, eviction rate, late-payment / NSF rate, and stable-employment percentage? A property-management company in the area should have these aggregated.
- How much new for-sale + rental construction is in the pipeline within 1–3 miles? Heavy new supply typically softens prices + rents 12–24 months out; constrained supply supports both.
Investment metrics
- 1% rule
- 1.13% ✓
- Cap rate
- 9.61%
- Cash-on-cash
- 11.85%
- DSCR
- 1.53
- GRM
- 7.4
CMA / ARV
- ARV (median comp)
- $146,777
- List price
- $130,000
- Delta
- -11.43%
- Verdict
- UNDERPRICED
- Comps
- 20 within 1.0 mi
Show comp detail 12 sales within ~0.75 mi
| Address | Dist | Beds/Ba | Sqft | Sold | Price | $/sf | Match |
|---|---|---|---|---|---|---|---|
| 780 South Ave | 0.46mi | 3/2.0 | 896 (-0%) | 2mo | $116,000 | $129 | 72 |
| 5085 Lake Dr | 0.32mi | 2/1.0 (-1) | 832 (-8%) | 0mo | $162,000 | $195 | 67 |
| 5168 Ellen St | 0.27mi | 3/1.0 | 837 (-7%) | 13mo | $114,000 | $136 | 64 |
| 5147 Ellen St | 0.26mi | 2/1.0 (-1) | 831 (-8%) | 15mo | $150,000 | $181 | 57 |
| 804 Linda Way | 0.45mi | 3/1.0 | 999 (+11%) | 5mo | $121,900 | $122 | 56 |
| 718 South Ave | 0.36mi | 2/1.0 (-1) | 801 (-11%) | 5mo | $100,000 | $125 | 56 |
| 5039 East St | 0.68mi | 3/1.0 | 950 (+6%) | 12mo | $138,000 | $145 | 49 |
| 5136 Jones Rd | 0.40mi | 2/1.0 (-1) | 772 (-14%) | 12mo | $100,000 | $130 | 43 |
| 5012 East St | 0.73mi | 2/1.0 (-1) | 999 (+11%) | 4mo | $80,000 | $80 | 39 |
| 925 South Ave | 0.70mi | 2/1.0 (-1) | 800 (-11%) | 10mo | $138,000 | $173 | 36 |
| 921 Dearing St | 0.68mi | 2/1.0 (-1) | 792 (-12%) | 9mo | $95,000 | $120 | 36 |
| 927 Dearing St | 0.69mi | 2/1.0 (-1) | 792 (-12%) | 15mo | $80,000 | $101 | 30 |
Match score weights: distance 35% · size 25% · config 20% · recency 20%. Top-matched comps best support the ARV.
Projected returns pro-forma
-3.0% appreciation · 0.0% rent growth · sell at horizon
- IRR
- -1.9%
- Equity multiple
- 0.93×
- Total profit
- $-2,528
- Equity at exit
- $19,383
- IRR
- 4.5%
- Equity multiple
- 1.29×
- Total profit
- $10,446
- Equity at exit
- $11,240
Cash invested: $36,400 (down + closing). Projections, not guarantees.
Landlord ↔ Tenant lean methodology
- Overall (STATE)
- 90 Strongly Landlord-Friendly
- State Georgia
- 90 Strongly Landlord-Friendly · R+3
- County
- — inherits STATE
- City
- — inherits STATE
ZIP-level market 30297
- Home prices YoY
- -29.5%
- Rents YoY
- -1.0%
- Active inventory
- 128
- Price-to-rent
- 7.4×
Monthly cashflow live
- Estimated rent
- $1,473 high interval (Pro) →
- Mortgage (P&I)
- −$682
- Tax from tax record
- −$68 /mo · $820/yr
- Insurance
- −$54
- HOA
- −$0
- Vacancy / Maint / Mgmt
- −$309
- Net cashflow
- $359
Break-even live
UW: 25.0% down · 7.5% · 30yr · 1.5% tax · 5.0% vac · 8.0% maint · 8.0% mgmt
Financing live
Cash to close
- Down payment
- $32,500
- Closing costs
- $3,900
- Reserves months
- —
- Total cash needed
- —
Loan-product check · same deal, 3 products live
Conventional
25% down · 7.5% · 30yr
- Down + closing
- —
- Monthly P&I
- —
- Monthly cashflow
- —
- DSCR
- —
- Eligible?
- —
Personal DTI + credit; lowest rate.
DSCR
20% down · 8.5% · 30yr
- Down + closing
- —
- Monthly P&I
- —
- Monthly cashflow
- —
- DSCR
- —
- Eligible?
- —
No personal income docs; deal must DSCR.
Hard money
10% down · 12.0% · 12mo
- Down + closing
- —
- Monthly P&I
- —
- Monthly cashflow
- —
- DSCR
- —
- Eligible?
- —
Short-term bridge; refi at stabilization.
Rent comps 27 comps
| Address | Beds | Baths | Sqft | Rent | $/sqft | DOM | Units | Dist |
|---|---|---|---|---|---|---|---|---|
| 521 Granade Dr Forest Park, GA | 3.0 | 2.0 | 1024 | $2,400 | $2.34 | 5d | 1 | 0.23mi |
| 514 Bridge Ave Apt D6 Forest Park, GA | 1.0–2.0 | 1.0 | 800 | $1,203 | $1.50 | 15d | 4 | 0.42mi |
| 676 Bridge Ave Forest Park, GA | 2.0 | 1.0 | 919 | $1,206 | $1.31 | 24d | 1 | 0.43mi |
| 774 South Ave Forest Park, GA | 3.0 | 2.0 | 1041 | $1,825 | $1.75 | 4d | 1 | 0.45mi |
| 4880 Hale Rd Unit B Forest Park, GA | 2.0 | 1.0 | 1000 | $895 | $0.90 | 24d | 1 | 0.63mi |
| 696 Hill St Forest Park, GA | 2.0 | 1.0 | 700 | $1,125 | $1.61 | 4d | 1 | 0.73mi |
| 5161 Phillips Dr Forest Park, GA | 2.0 | 1.0 | 992 | $1,400 | $1.41 | 24d | 1 | 0.79mi |
| 4855 College St Unit 11 Forest Park, GA | 2.0 | 1.0 | 750 | $1,125 | $1.50 | 24d | 1 | 0.88mi |
| 4855 College St Forest Park, GA | 2.0 | 1.0 | 750 | $1,175 | $1.57 | 24d | 1 | 0.88mi |
| 5598 Ash St Forest Park, GA | 3.0 | 1.0 | 976 | $1,500 | $1.54 | 24d | 1 | 0.91mi |
| 4711 Waldrop Dr Unit W-L05 Forest Park, GA | 2.0 | 1.0 | 1100 | $1,295 | $1.18 | 43d | 1 | 0.96mi |
| 417 Barton Dr Forest Park, GA | 1.0–2.0 | 1.0 | 789 | $995 | $1.26 | 4d | 3 | 1.01mi |
| 5632 Cypress Dr Forest Park, GA | 3.0 | 1.0 | 1040 | $1,451 | $1.40 | 12d | 1 | 1.04mi |
| 4663 Waldrop Dr Forest Park, GA | 2.0 | 2.0 | 925 | $1,095 | $1.18 | 20d | 1 | 1.04mi |
| 5738 Old Dixie Hwy Forest Park, GA | 1.0–2.0 | 1.0–1.5 | 996 | $1,150 | $1.15 | 43d | 24 | 1.05mi |
| 969 Forest Ave Forest Park, GA | 1.0–2.0 | 1.0 | 875 | $1,300 | $1.49 | 24d | 1 | 1.07mi |
| 415 Sylvia Dr Forest Park, GA | 1.0–3.0 | 1.0–2.0 | 897 | $1,458 | $1.62 | 2d | 13 | 1.14mi |
| 640 Oakdale Dr Forest Park, GA | 3.0 | 1.0 | 1033 | $1,450 | $1.40 | 3d | 1 | 1.18mi |
| 828 Catherine St Forest Park, GA | 3.0 | 1.0 | 1040 | $1,440 | $1.38 | 43d | 1 | 1.21mi |
| 4560 Burks Rd Forest Park, GA | 2.0 | 1.0 | 952 | $1,350 | $1.42 | 43d | 1 | 1.21mi |
| 4735 Courtney Dr Forest Park, GA | 1.0–2.0 | 1.0–1.5 | 800 | $1,150 | $1.44 | 16d | 5 | 1.22mi |
| 1216 Sanders Way Morrow, GA | 3.0 | 1.5 | 1110 | $1,550 | $1.40 | 24d | 1 | 1.30mi |
| 645 Melrose Dr Forest Park, GA | 3.0 | 1.0 | 1123 | $1,575 | $1.40 | 43d | 1 | 1.33mi |
| 228 Morrow Rd Forest Park, GA | 1.0–3.0 | 1.0–2.5 | 1125 | $1,579 | $1.40 | 1d | 34 | 1.38mi |
| 506 Shady Ln Forest Park, GA | 3.0 | 1.5 | 990 | $1,445 | $1.46 | 24d | 1 | 1.45mi |
| 573 Evergreen Ter Unit 2 Forest Park, GA | 2.0 | 1.0 | 900 | $1,150 | $1.28 | 44d | 1 | 1.48mi |
| 573 Evergreen Ter Unit 3 Forest Park, GA | 2.0 | 1.0 | 856 | $1,150 | $1.34 | 43d | 1 | 1.48mi |
Listing history 16 events
-
2026-06-18days on market $130,000 Active 47 DOM
-
2026-06-17days on market $130,000 Active 46 DOM
-
2026-06-16days on market $130,000 Active 45 DOM
-
2026-06-15days on market $130,000 Active 44 DOM
-
2026-06-13days on market $130,000 Active 42 DOM
-
2026-06-09days on market $130,000 Active 38 DOM
-
2026-06-08days on market $130,000 Active 37 DOM
-
2026-06-07days on market $130,000 Active 36 DOM
-
2026-06-04days on market $130,000 Active 33 DOM
-
2026-06-03days on market $130,000 Active 32 DOM
-
2026-06-02days on market $130,000 Active 31 DOM
-
2026-06-01days on market $130,000 Active 30 DOM
-
2026-05-31days on market $130,000 Active 29 DOM
-
2026-05-19price $130,000 245-char remark
-
2026-04-30$135,900 New 245-char remark
-
1990-04-05soldstatus $50,000
ⓘ Source: listings_history table (triggers on properties + properties_extension) + one-shot
backfill from property_details.listing_events for pre-trigger history.
Tax reassessment forecast GA · Resets to sale price
- Current annual tax
- $820 · $68/mo
- Projected year-2 tax
- $1,196 · $100/mo
- Expected delta
- +$376/yr (+$31/mo · 45.9%)
ⓘ Screening estimate from a state-policy table — verify with the county assessor before closing.
Climate risk First Street
- Flood 3/10 Moderate FEMA zone X (unshaded) · 20% chance over 30 yrs
- Wildfire 1/10 Low
- Heat 5/10 Major 7 d/yr ≥104°F today · 17 d/yr by 30 yrs out
- Wind 6/10 Major 27% chance of damaging wind over 30 yrs
- Air quality 4/10 Moderate 4 unhealthy d/yr today · 7 by 30 yrs out
Nearby sold comps map
Loading sold comps map…
Walkable amenities ~0.75 mi
Loading nearby amenities…
Taxation est. · year 1
- Rental income
- $17,675
- − Mortgage interest
- −$7,282
- − Property taxes
- −$820
- − Insurance
- −$650
- − Repairs & maintenance
- −$1,414
- − Management
- −$1,414
- − Depreciation
- −$3,782
- Taxable income
- $2,313
- Est. tax owed @ 24.0%
- −$555
- After-tax cash flow
- $3,757/yr
For passive investors: Depreciation is non-cash, so a rental often shows a tax loss while cash-flowing — sheltering income. Rental losses are passive: they offset passive income freely, and up to $25,000/yr can offset ordinary (W-2) income if you actively participate and your MAGI is under $100k (phasing out to $0 by $150k); unused losses carry forward. On sale, claimed depreciation is recaptured at up to 25%, and gains may owe capital-gains tax (a 1031 exchange can defer both). Figures are a year-1 estimate at your 24.0% rate — not tax advice; consult a CPA.
Schools (NCES district)
- District
- Clayton County
- NCES district ID
- 1301230
- Math proficiency
- 11% ▼ -13.00%
- Reading proficiency
- 20% ▼ -9.00%
- Median HH income
- $42,266
- Composite
- 13.41/100
- National rank
- #9527
- State rank
- #155 of 174 in GA
Livability — Forest Park
- Score
- 65/100
- State rank
- #209
- US rank
- #12698
Category grades
Schools grade is shown separately in the Schools card above.
Census & demographics
- Census place
- Forest Park, GA
- County
- Clayton County · 230,153 people
- City population
- 29,210
- Metro
- Atlanta-Sandy Springs-Alpharetta, GA
- Population (ZIP)
- 29,210
- Household income
- $45,124
- Rent vs Own
- Severe rent burden
- 1359.0
Population outlook (Clayton County) Hauer SSP2
- Today (2025)
- 310,777 people
- By 2030
- 329,762 · +6.1%
- By 2040
- 368,052 · +18.4%
- By 2050
- 401,196 · +29.1%
- By 2075
- 472,488 · +52.0%
- By 2100
- 500,446 · +61.0%
Race, ethnicity, and origin ACS 2023
- Neighborhood character
- Diverse neighborhood (Simpson 0.64)
- Race & ethnicity
- Black 52% Hispanic / Latino 27% White 10% Two or more races 10% Asian 6%
- Hispanic origin (detail)
- Mexican 19%
- Foreign-born
- 18% · Canada, Vietnam, Jamaica
- Languages at home
- 67% English-only · Spanish 26% Vietnamese 5% Other Asian/Pacific 1%
Political lean MEDSL · Clayton
- 2024 margin
- Solid D (+69.2) · D 84.3% · R 15.1%
- 2008→2024 swing
- +2.8pp toward D · 2008: 66.4pp · 2024: 69.2pp
- All cycles
- 2024: D+69.2 2020: D+70.9 2016: D+71.9 2012: D+70.1 2008: D+66.4
Not yet ingested
- Civics
- —
Market trends
- HPI YoY
- ▼ -96.04%
- Current HPI
- 229.5016
- Rent YoY
- ▼ -0.96%
- Metro
- Atlanta-Sandy Springs-Alpharetta, GA
- State GDP YoY
- ▲ 2.66%
- F500 in state
- 28
Industry mix (Fortune 500 HQ in GA)
| Industry | F500 HQs | Revenue |
|---|---|---|
| Paper / Packaging | 2 | $29B |
|
||
| Retail | 1 | $160B |
|
||
| Transportation / Logistics | 1 | $91B |
|
||
| Airlines | 1 | $62B |
|
||
| Consumer Goods | 1 | $47B |
|
||
| Utilities | 1 | $25B |
|
||
Price history
+160.0% since first listed3 events — show timeline
- 2026-05-19 Price Changed $130,000 GAMLS
- 2026-04-30 Listed $135,900 GAMLS
- 1990-04-05 Sold (Public Records) $50,000 Public Records
Property tax history
+2.8%/yrLatest (2025): $820 · -2.0% YoY. Source: county tax records.
Cash-flow waterfall
monthlySold comps — $/sqft
last 12 mo · ≤1 miLoading sold comps…