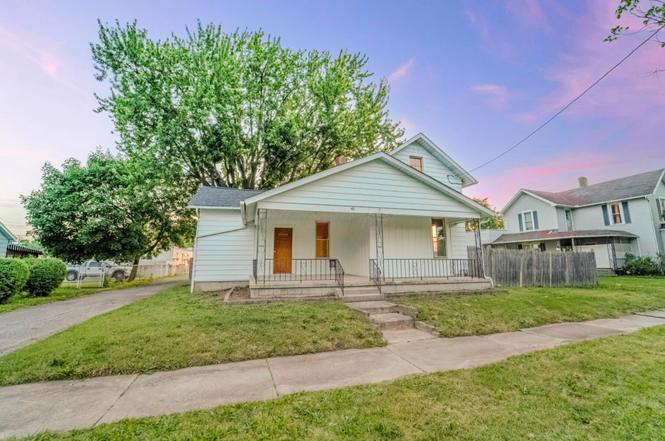
451 N State St · Marion, OH
Flood risk 1/10 · Minimal
- FEMA flood zone
- X (unshaded)
- Chance of flooding over 30 yrs
- 0.0%
- Est. flood insurance / yr
- $473 – $860
Fire risk 1/10 · Minimal
- Est. fire insurance / yr
- $713 – $1,323
Heat risk 3/10 · Minor
- Hot days now (above 100°F)
- 7 days/yr
- Hot days in 30 yrs
- 17 days/yr
Wind risk 2/10 · Minimal
- Chance of severe wind over 30 yrs
- —
Air-quality risk 2/10 · Minimal
- Unhealthy air days now
- 1 days/yr
- Unhealthy air days in 30 yrs
- 1 days/yr
Risk factors via First Street. Map © Google.
Why this score? — see what drove the D- grade
The composite is a weighted blend of 9 inputs, each scored 0–100. Each bar is that input's sub-score; the figure is the points it added to the 100-point composite (weight × sub-score).
- Cash flow +17.4/30.0
- DSCR +5.4/10.0
- 1% rule +3.7/10.0
- Livability +3.2/5.0
- Rent growth +2.5/5.0
- Condition / age +2.5/5.0
- Schools +2.2/10.0
- ARV discount +0.0/15.0
- Appreciation +0.0/10.0
$175,900
🖨 Deal sheet (PDF) 📄 Offer letter ✓ Due diligence
Listing remarks
Welcome home to 451 N State St. , where comfort, function, and smart living come together in one fantastic package! This charming home offers over 1,300 square feet of well designed living space, featuring 3 bedrooms and 2 full bathrooms to comfortably fit your lifestyle. One of the standout features of this home is the convenient first floor primary bedroom and first floor laundry, giving you everyday ease without having to climb stairs for your most used spaces. Step outside and you will find a backyard that is truly made for entertaining. Picture summer cookouts, weekend get togethers, or simply relaxing outdoors after a long day, this space is ready for it all. For those who need extra
Key facts
- First floor laundry
- 0.26 acre lot
- 3 garage spots
Tags
Property features AI
Exterior
- Parking: Detached 3-car garage
- Utilities: Public water; Public sewer
- Home design: Single-family residence; Two stories; Built in 1902; No shared/common walls
- Construction: Block foundation; Built in 1902
- Exterior features: Block foundation; Lot approximately 0.26 acres
Interior
- Bedrooms: One main-level bedroom
- Bathrooms: Two full bathrooms
- Interior features: Full basement with walk-up access; Living area approximately 1,342
Neighborhood map
What this means for you Summary
Snapshot
- This is a 3-bed/2.0-bath single-family listed at $176k.
Deal economics
- At list price, monthly cash flow is $131 ($2k/yr) — positive.
- The deal already cash-flows at list — no discount required.
- To meet the 1% rule (rent ≥ 1% of price), the offer needs to be $153k (13.0% below list).
- Recommended offer: $153k (13.0% below list) — sets the bar for 1% rule.
Location & tenants
- Location reads 65/100 on livability (#704 in OH) — a middle-class / working-renter tenant base. Strengths: cost of living A+, housing A+; Watch: crime D+, amenities F, commute F.
- Marion City (town): math 22% / reading 31% proficiency, ranked #600 of 656 in OH (top 92%) — low school quality limits family demand, transient renter base, plan for 1-2y turnover; 67% free/reduced lunch — lower-income household profile, screen leases tightly.
- Zoned schools: William H. Taft Elementary School (math 17% / reading 31%, grade F, #1,231 of 1,584 statewide, top 78%, 394 students, 0% FRL); Ulysses S. Grant Middle School (math 22% / reading 25%, grade F, #597 of 654 statewide, top 92%, 998 students, 0% FRL); Harding High School (math 16% / reading 36%, grade F, #636 of 781 statewide, top 82%, 1,050 students, 0% FRL) — zoned schools average 0% FRL vs 67% district-wide (67 pts lower); this property's tenant base skews higher-income than the district average.
- Market conditions: 212 active listings in the ZIP; 53 units permitted in Marion County in 2024 (0 in 5+ unit buildings).
- This rent runs 33% of the median local income ($55k/yr) — at the standard rent-burdened threshold; future hikes will face affordability resistance.
Forward outlook
- Local home prices are declining (-3.0%/yr); year-one equity from $1k of loan paydown is wiped out by about $5k of value loss. Plan a longer hold.
- Marion County population projected at -18% by 2050 — secular population decline; favor cash flow + early exit over multi-decade hold.
Negotiation context
- Only 5 days on market — expect competitive offers; lowballing is unlikely to land.
Risks & watch-outs
- Watch-outs: built in 1902 — expect roof / HVAC / electrical / plumbing capex.
Questions for the listing agent
- Built in 1902 — when were the roof, HVAC, electrical panel, plumbing, and water heater last replaced?
- Is there a deadline driving the sale (1031 exchange, divorce, estate, relocation)? That informs how much negotiation room exists.
- Schools are D-rated, which usually means shorter tenancies and higher turnover. Who's the typical renter profile here, and what's been the actual vacancy rate?
- Crime grade is D in this area — have there been break-ins, vandalism, or insurance claims at this property in the last 3 years? What carrier currently insures it and at what premium?
- The area grade is low — what's the realistic commute time and amenity access for the typical tenant pool here? Any planned neighborhood developments (good or bad) we should know about?
- What's the average days-on-market for RENTAL listings here right now (not sales)? A rising rental-DOM trend means longer vacancies and softer asking-rent achievability than the comps imply.
- What's the recent tenant-quality profile in this submarket — average credit score on applications, eviction rate, late-payment / NSF rate, and stable-employment percentage? A property-management company in the area should have these aggregated.
- How much new for-sale + rental construction is in the pipeline within 1–3 miles? Heavy new supply typically softens prices + rents 12–24 months out; constrained supply supports both.
Investment metrics
- 1% rule
- 0.87% ✗
- Cap rate
- 7.19%
- Cash-on-cash
- 3.19%
- DSCR
- 1.14
- GRM
- 9.6
CMA / ARV
- ARV (on-the-fly)
- $140,910
- Comps found
- 12
Show comp detail 12 sales within ~0.75 mi
| Address | Dist | Beds/Ba | Sqft | Sold | Price | $/sf | Match |
|---|---|---|---|---|---|---|---|
| 350 Mary St | 0.31mi | 4/2.0 (+1) | 1,384 (+3%) | 4mo | $170,500 | $123 | 72 |
| 501 Roberts Ave | 0.61mi | 3/2.0 | 1,344 (+0%) | 3mo | $167,000 | $124 | 69 |
| 464 Ballentine Ave | 0.23mi | 2/1.0 (-1) | 1,280 (-5%) | 5mo | $135,000 | $105 | 69 |
| 125 Wallace St | 0.23mi | 3/1.0 | 1,242 (-8%) | 5mo | $55,000 | $44 | 68 |
| 749 Richmond Ave | 0.57mi | 3/1.5 | 1,345 (+0%) | 4mo | $179,900 | $134 | 68 |
| 523 Mary St | 0.32mi | 3/1.5 | 1,524 (+14%) | 0mo | $175,000 | $115 | 60 |
| 279 E Fairground St | 0.33mi | 2/1.0 (-1) | 1,168 (-13%) | 2mo | $163,000 | $140 | 52 |
| 636 Mary St | 0.38mi | 3/1.0 | 1,144 (-15%) | 5mo | $57,360 | $50 | 50 |
| 210 Leader St | 0.60mi | 3/3.0 | 1,495 (+11%) | 1mo | $35,000 | $23 | 48 |
| 482 E George St | 0.52mi | 3/1.0 | 1,539 (+15%) | 1mo | $85,000 | $55 | 46 |
| 594 E George St | 0.67mi | 4/2.0 (+1) | 1,543 (+15%) | 3mo | $26,500 | $17 | 36 |
| 405 Fairview St | 0.72mi | 4/1.0 (+1) | 1,500 (+12%) | 2mo | $140,000 | $93 | 36 |
Match score weights: distance 35% · size 25% · config 20% · recency 20%. Top-matched comps best support the ARV.
Projected returns pro-forma
-3.0% appreciation · 3.0% rent growth · sell at horizon
- IRR
- -11.3%
- Equity multiple
- 0.59×
- Total profit
- $-20,226
- Equity at exit
- $26,227
- IRR
- -2.1%
- Equity multiple
- 0.86×
- Total profit
- $-7,124
- Equity at exit
- $15,209
Cash invested: $49,252 (down + closing). Projections, not guarantees.
Landlord ↔ Tenant lean methodology
- Overall (STATE)
- 73 Landlord-Friendly
- State Ohio
- 73 Landlord-Friendly · R+6
- County
- — inherits STATE
- City
- — inherits STATE
ZIP-level market 43302
- Home prices YoY
- -33.9%
- Active inventory
- 212
- Price-to-rent
- 9.6×
Monthly cashflow live
- Estimated rent
- $1,531 medium interval (Pro) →
- Mortgage (P&I)
- −$922
- Tax from tax record
- −$83 /mo · $991/yr
- Insurance
- −$73
- HOA
- −$0
- Lot rent
- −$0
- Vacancy / Maint / Mgmt
- −$321
- Net cashflow
- $131
Break-even live
Sensitivity live
| Price | -10% $230 | -5% $181 | +0% $131 | +5% $81 | +10% $31 |
|---|---|---|---|---|---|
| Rent | -10% $10 | -5% $70 | +0% $131 | +5% $191 | +10% $252 |
| Rate | -1.0pp $220 | -0.5pp $176 | base $131 | +0.5pp $85 | +1.0pp $39 |
UW: 25.0% down · 7.5% · 30yr · 1.5% tax · 5.0% vac · 8.0% maint · 8.0% mgmt
Financing live
Cash to close
- Down payment
- $43,975
- Closing costs
- $5,277
- Reserves months
- —
- Total cash needed
- —
Loan-product check · same deal, 3 products live
Conventional
25% down · 7.5% · 30yr
- Down + closing
- —
- Monthly P&I
- —
- Monthly cashflow
- —
- DSCR
- —
- Eligible?
- —
Personal DTI + credit; lowest rate.
DSCR
20% down · 8.5% · 30yr
- Down + closing
- —
- Monthly P&I
- —
- Monthly cashflow
- —
- DSCR
- —
- Eligible?
- —
No personal income docs; deal must DSCR.
Hard money
10% down · 12.0% · 12mo
- Down + closing
- —
- Monthly P&I
- —
- Monthly cashflow
- —
- DSCR
- —
- Eligible?
- —
Short-term bridge; refi at stabilization.
Listing history 5 events
-
2026-06-22days on market $175,900 Active 5 DOM
-
2026-06-21days on market $175,900 Active 4 DOM
-
2026-06-19days on market $175,900 Active 2 DOM
-
2026-06-17remarks 699-char remark
-
2026-06-17$175,900 Active 1 DOM
ⓘ Source: listings_history table (triggers on properties + properties_extension) + one-shot
backfill from property_details.listing_events for pre-trigger history.
Tax reassessment forecast OH · Partial reset (capped growth)
- Current annual tax
- $991 · $83/mo
- Projected year-2 tax
- $1,868 · $156/mo
- Expected delta
- +$876/yr (+$73/mo · 88.4%)
ⓘ Screening estimate from a state-policy table — verify with the county assessor before closing.
Climate risk First Street
- Flood 1/10 Low FEMA zone X (unshaded) · 0% chance over 30 yrs
- Wildfire 1/10 Low
- Heat 3/10 Moderate 7 d/yr ≥100°F today · 17 d/yr by 30 yrs out
- Wind 2/10 Low
- Air quality 2/10 Low 1 unhealthy d/yr today · 1 by 30 yrs out
Nearby sold comps map
Loading sold comps map…
Walkable amenities ~0.75 mi
Loading nearby amenities…
Taxation est. · year 1
- Rental income
- $18,368
- − Mortgage interest
- −$9,853
- − Property taxes
- −$991
- − Insurance
- −$880
- − Repairs & maintenance
- −$1,469
- − Management
- −$1,469
- − Depreciation
- −$5,117
- Taxable loss
- −$1,411
- Est. tax savings @ 24.0%
- +$339
- After-tax cash flow
- $1,910/yr
For passive investors: Depreciation is non-cash, so a rental often shows a tax loss while cash-flowing — sheltering income. Rental losses are passive: they offset passive income freely, and up to $25,000/yr can offset ordinary (W-2) income if you actively participate and your MAGI is under $100k (phasing out to $0 by $150k); unused losses carry forward. On sale, claimed depreciation is recaptured at up to 25%, and gains may owe capital-gains tax (a 1031 exchange can defer both). Figures are a year-1 estimate at your 24.0% rate — not tax advice; consult a CPA.
Schools (NCES district)
- District
- Marion City
- NCES district ID
- 3904433
- Math proficiency
- 22% ▼ -17.00%
- Reading proficiency
- 31% ▼ -8.00%
- Median HH income
- $32,327
- Composite
- 21.58/100
- National rank
- #8306
- State rank
- #600 of 656 in OH
Livability — Marion
- Score
- 65/100
- State rank
- #704
- US rank
- #12605
Category grades
Schools grade is shown separately in the Schools card above.
Census & demographics
- Census place
- Marion, OH
- County
- Marion County · 53,702 people
- City population
- 53,702
- Metro
- Marion, OH
- Population (ZIP)
- 53,702
- Household income
- $55,057
- Rent vs Own
- Severe rent burden
- 1554.0
Population outlook (Marion County) Hauer SSP2
- Today (2025)
- 62,078 people
- By 2030
- 60,049 · -3.3%
- By 2040
- 55,413 · -10.7%
- By 2050
- 50,604 · -18.5%
- By 2075
- 40,162 · -35.3%
- By 2100
- 29,105 · -53.1%
Race, ethnicity, and origin ACS 2023
- Neighborhood character
- Predominantly White (85%)
- Race & ethnicity
- White 85% Black 6% Two or more races 6% Hispanic / Latino 3%
- Common ancestry
- Slovak 2% Romanian 2% Lithuanian 2%
- Foreign-born
- 2% · Canada
- Languages at home
- 96% English-only · Spanish 2% Arabic 1%
Political lean MEDSL · Marion
- 2024 margin
- Solid R (+41.4) · D 28.9% · R 70.3%
- 2008→2024 swing
- -32.5pp toward R · 2008: -8.9pp · 2024: -41.4pp
- All cycles
- 2024: R+41.4 2020: R+38.6 2016: R+34.4 2012: R+7.6 2008: R+8.9
Not yet ingested
- Civics
- —
Market trends
- HPI YoY
- ▼ -114.52%
- Current HPI
- 223.5344
- Rent YoY
- —
- Metro
- Marion, OH
- State GDP YoY
- ▲ 1.98%
- F500 in state
- 48
Industry mix (Fortune 500 HQ in OH)
| Industry | F500 HQs | Revenue |
|---|---|---|
| Insurance | 3 | $145B |
|
||
| Industrial Machinery | 3 | $49B |
|
||
| Financial Services | 3 | $24B |
|
||
| Consumer Goods | 2 | $93B |
|
||
| Aerospace / Defense | 2 | $47B |
|
||
| Utilities | 2 | $33B |
|
||
Price history
1 event — show timeline
- 2026-06-17 Listed $175,900 CBRMLS
Property tax history
+0.9%/yrLatest (2025): $991 · +0.0% YoY. Source: county tax records.
Cash-flow waterfall
monthlySold comps — $/sqft
last 12 mo · ≤1 miLoading sold comps…