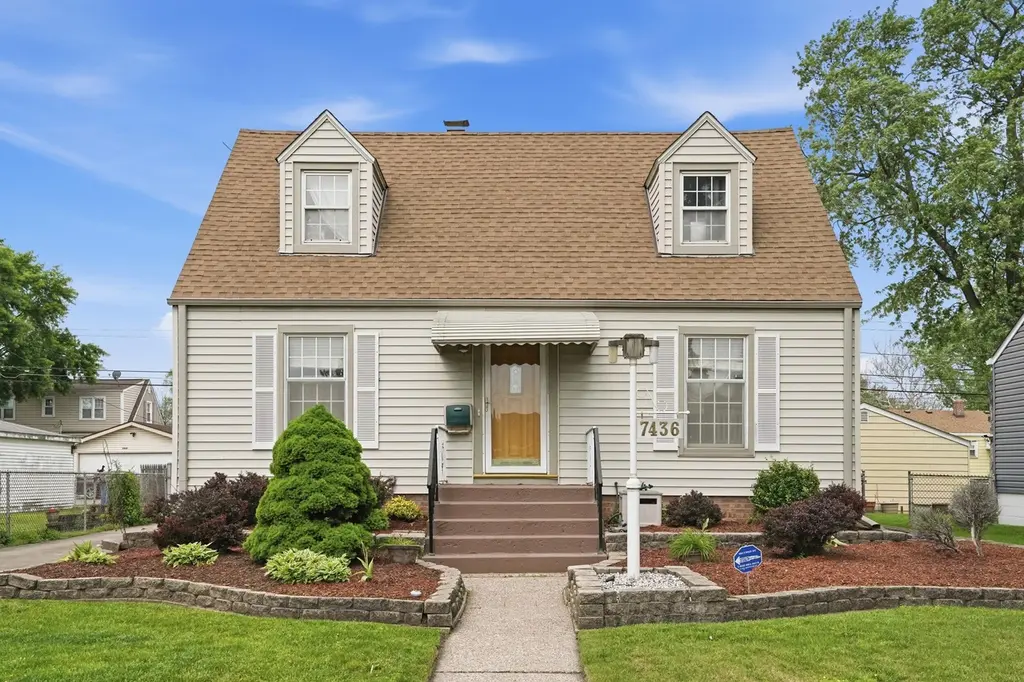
7436 Magoun Ave · Hammond, IN
Flood risk 1/10 · Minimal
- FEMA flood zone
- X
- Chance of flooding over 30 yrs
- 0.0%
- Est. flood insurance / yr
- $507 – $1,088
Fire risk 1/10 · Minimal
- Est. fire insurance / yr
- $717 – $1,331
Heat risk 3/10 · Minor
- Hot days now (above 102°F)
- 7 days/yr
- Hot days in 30 yrs
- 15 days/yr
Wind risk 2/10 · Minimal
- Chance of severe wind over 30 yrs
- 0.0%
Air-quality risk 4/10 · Minor
- Unhealthy air days now
- 5 days/yr
- Unhealthy air days in 30 yrs
- 6 days/yr
Risk factors via First Street. Map © Google.
Why this score? — see what drove the D grade
The composite is a weighted blend of 9 inputs, each scored 0–100. Each bar is that input's sub-score; the figure is the points it added to the 100-point composite (weight × sub-score).
- Cash flow +15.0/30.0
- ARV discount +6.3/15.0
- DSCR +4.6/10.0
- Rent growth +3.9/5.0
- 1% rule +3.5/10.0
- Livability +3.5/5.0
- Condition / age +2.5/5.0
- Schools +1.1/10.0
- Appreciation +0.0/10.0
$238,000
🖨 Deal sheet (PDF) 📄 Offer letter ✓ Due diligence
Listing remarks MLS
Maintenance free exterior; deck, newer Pella windows, fenced yard, and newer roof. Basement finished, kitchen totally redone, appliances (except washer & dryer) included, 3 baths, hardwood floors, move in condition.
Key facts
- Updated living space
- Two fireplaces
- 6,750 sq ft lot
Tags
Property features AI
Exterior
- Parking: Detached garage; Garage faces front; Driveway with concrete surface; Garage door opener; Approximately 2.5 garage spaces
- Security: Smoke detectors; Carbon monoxide detectors
- Utilities: Public water; Public sewer; Electricity connected; Natural gas connected; Cable connected
- Home design: One and one-half story home; Built in 1949
- Construction: Vinyl siding; Shingle roof; Has basement
- Exterior features: Front porch; Deck; Partial fencing; Rain gutters; Neighborhood view; Wood frame windows; Garage(s) structure present
Interior
- Kitchen: Gas range; Microwave; Dishwasher; Refrigerator; Disposal
- Bedrooms: Primary bedroom; Two additional bedrooms
- Flooring: Hardwood; Carpet; Laminate; Tile; Concrete
- Bathrooms: Two full bathrooms; One three-quarter bathroom
- Heating & cooling: Forced air heating (natural gas); Central air conditioning; Gas water heater
- Interior features: Eat-in kitchen; Soaking tub; Two fireplaces (living room and basement; gas and electric); Partially finished basement with storage, sump pump, and bath stubbed; Basement-level sink
- Laundry & utility: Washer hookup; Gas dryer hookup
Neighborhood map
What this means for you Summary
Snapshot
- This is a 3-bed/1.0-bath single-family listed at $238k.
Deal economics
- At list price, monthly cash flow is $74 ($883/yr) — positive.
- The deal already cash-flows at list — no discount required.
- To meet the 1% rule (rent ≥ 1% of price), the offer needs to be $201k (15.4% below list).
- Recommended offer: $201k (15.4% below list) — sets the bar for 1% rule.
Location & tenants
- Location reads 70/100 on livability (#143 in IN) — a middle-class / working-renter tenant base. Strengths: cost of living A+, housing A+, commute A; Watch: health & safety D+, employment D, crime F.
- School City Of Hammond (suburban): math 8% / reading 18% proficiency, ranked #289 of 301 in IN (top 96%) — low school quality limits family demand, transient renter base, plan for 1-2y turnover; 74% free/reduced lunch — lower-income household profile, screen leases tightly.
- Zoned schools: Thomas Jefferson Elementary School (math 12% / reading 16%, grade F, #874 of 994 statewide, top 89%, 439 students, 77% FRL) — zoned schools at 77% FRL track the district average.
- Market conditions: Rents rising fast (+5.5%/yr); 63 active listings in the ZIP; 4 comparable units currently listed for rent nearby; rentals leasing fast (median 12d on market — plan ~1-2 weeks tenant-placement turnaround); 1,642 units permitted in Lake County in 2024 (14 in 5+ unit buildings).
- This rent runs 38% of the median local income ($63k/yr) — at the standard rent-burdened threshold; future hikes will face affordability resistance.
Forward outlook
- Local home prices are declining (-3.0%/yr); year-one equity from $2k of loan paydown is wiped out by about $7k of value loss. Plan a longer hold.
- Lake County population projected to shrink 7% by 2050 — rents likely to lag national; underwrite the cash flow, not the appreciation.
Negotiation context
- Only 2 days on market — expect competitive offers; lowballing is unlikely to land.
- 3 sale attempts since 26y ago with the ask held roughly flat each time — persistent listings suggest the price (not the market) is what's stuck; bring a comps-based counter.
Risks & watch-outs
- Watch-outs: built in 1949 — expect roof / HVAC / electrical / plumbing capex.
Questions for the listing agent
- Built in 1949 — when were the roof, HVAC, electrical panel, plumbing, and water heater last replaced?
- Is there a deadline driving the sale (1031 exchange, divorce, estate, relocation)? That informs how much negotiation room exists.
- Schools are F-rated, which usually means shorter tenancies and higher turnover. Who's the typical renter profile here, and what's been the actual vacancy rate?
- Crime grade is F in this area — have there been break-ins, vandalism, or insurance claims at this property in the last 3 years? What carrier currently insures it and at what premium?
- The area grade is low — what's the realistic commute time and amenity access for the typical tenant pool here? Any planned neighborhood developments (good or bad) we should know about?
- What's the average days-on-market for RENTAL listings here right now (not sales)? A rising rental-DOM trend means longer vacancies and softer asking-rent achievability than the comps imply.
- What's the recent tenant-quality profile in this submarket — average credit score on applications, eviction rate, late-payment / NSF rate, and stable-employment percentage? A property-management company in the area should have these aggregated.
- How much new for-sale + rental construction is in the pipeline within 1–3 miles? Heavy new supply typically softens prices + rents 12–24 months out; constrained supply supports both.
Investment metrics
- 1% rule
- 0.85% ✗
- Cap rate
- 6.66%
- Cash-on-cash
- 1.33%
- DSCR
- 1.06
- GRM
- 9.9
CMA / ARV
- ARV (on-the-fly)
- $231,936
- Comps found
- 12
Show comp detail 12 sales within ~0.75 mi
| Address | Dist | Beds/Ba | Sqft | Sold | Price | $/sf | Match |
|---|---|---|---|---|---|---|---|
| 7345 Woodmar Ave | 0.36mi | 3/1.5 | 1,550 (+1%) | 5mo | $255,000 | $165 | 76 |
| 7344 Woodmar Ave | 0.33mi | 3/1.5 | 1,488 (-3%) | 2mo | $290,000 | $195 | 75 |
| 7338 Magoun Ave | 0.11mi | 3/2.0 | 1,430 (-7%) | 5mo | $229,900 | $161 | 75 |
| 7561 Golfway Ct | 0.19mi | 3/2.0 | 1,406 (-8%) | 4mo | $142,000 | $101 | 70 |
| 7231 Olcott Ave | 0.30mi | 2/2.0 (-1) | 1,650 (+7%) | 3mo | $223,000 | $135 | 62 |
| 7552 Southeastern Ave | 0.16mi | 3/1.0 | 1,760 (+15%) | 8mo | $154,000 | $88 | 62 |
| 7420 White Oak Ave | 0.43mi | 3/1.0 | 1,440 (-6%) | 10mo | $210,000 | $146 | 62 |
| 7149 Ontario Ave | 0.63mi | 3/2.0 | 1,488 (-3%) | 0mo | $250,000 | $168 | 61 |
| 7141 Ontario Ave | 0.64mi | 3/1.0 | 1,584 (+3%) | 8mo | $240,000 | $152 | 58 |
| 1703 170th Pl | 0.60mi | 3/1.0 | 1,703 (+11%) | 1mo | $245,000 | $144 | 53 |
| 1716 170th Pl | 0.56mi | 2/1.0 (-1) | 1,440 (-6%) | 9mo | $218,000 | $151 | 51 |
| 7216 Mclaughlin Ave | 0.63mi | 3/1.0 | 1,404 (-9%) | 8mo | $207,000 | $147 | 50 |
Match score weights: distance 35% · size 25% · config 20% · recency 20%. Top-matched comps best support the ARV.
Projected returns pro-forma
-3.0% appreciation · 5.51% rent growth · sell at horizon
- IRR
- -11.6%
- Equity multiple
- 0.57×
- Total profit
- $-28,717
- Equity at exit
- $35,487
- IRR
- 0.6%
- Equity multiple
- 1.05×
- Total profit
- $3,340
- Equity at exit
- $20,578
Cash invested: $66,640 (down + closing). Projections, not guarantees.
Landlord ↔ Tenant lean methodology
- Overall (STATE)
- 90 Strongly Landlord-Friendly
- State Indiana
- 90 Strongly Landlord-Friendly · R+11
- County
- — inherits STATE
- City
- — inherits STATE
ZIP-level market 46324
- Home prices YoY
- -9.6%
- Rents YoY
- 5.5%
- Active inventory
- 63
- Price-to-rent
- 9.9×
Monthly cashflow live
- Estimated rent
- $2,012 medium interval (Pro) →
- Mortgage (P&I)
- −$1,248
- Tax from tax record
- −$169 /mo · $2,027/yr
- Insurance
- −$99
- HOA
- −$0
- Vacancy / Maint / Mgmt
- −$423
- Net cashflow
- $74
Break-even live
Sensitivity live
| Price | -10% $208 | -5% $141 | +0% $74 | +5% $6 | +10% $-61 |
|---|---|---|---|---|---|
| Rent | -10% $-85 | -5% $-6 | +0% $74 | +5% $153 | +10% $233 |
| Rate | -1.0pp $193 | -0.5pp $134 | base $74 | +0.5pp $12 | +1.0pp $-51 |
UW: 25.0% down · 7.5% · 30yr · 1.5% tax · 5.0% vac · 8.0% maint · 8.0% mgmt
Financing live
Cash to close
- Down payment
- $59,500
- Closing costs
- $7,140
- Reserves months
- —
- Total cash needed
- —
Loan-product check · same deal, 3 products live
Conventional
25% down · 7.5% · 30yr
- Down + closing
- —
- Monthly P&I
- —
- Monthly cashflow
- —
- DSCR
- —
- Eligible?
- —
Personal DTI + credit; lowest rate.
DSCR
20% down · 8.5% · 30yr
- Down + closing
- —
- Monthly P&I
- —
- Monthly cashflow
- —
- DSCR
- —
- Eligible?
- —
No personal income docs; deal must DSCR.
Hard money
10% down · 12.0% · 12mo
- Down + closing
- —
- Monthly P&I
- —
- Monthly cashflow
- —
- DSCR
- —
- Eligible?
- —
Short-term bridge; refi at stabilization.
Rent comps 4 comps
| Address | Beds | Baths | Sqft | Rent | $/sqft | DOM | Units | Dist |
|---|---|---|---|---|---|---|---|---|
| 7202 Chestnut Ave Hammond, IN | 3.0 | 2.0 | 2178 | $1,900 | $0.87 | 0d | 1 | 0.74mi |
| 7019 Chestnut Ave Hammond, IN | 3.0 | 1.5 | 1440 | $1,895 | $1.32 | 22d | 1 | 0.83mi |
| 8016 Monaldi Dr Munster, IN | 4.0 | 2.0 | 2000 | $2,999 | $1.50 | 12d | 1 | 1.30mi |
| 6949 Alabama Ave Hammond, IN | 2.0 | 1.5 | 1200 | $1,795 | $1.50 | 5d | 1 | 1.32mi |
Listing history 4 events
-
2026-05-22status Pending
-
2026-05-20$238,000 Active
-
2002-01-13$137,000 221-char remark
Show marketing remark (221 chars)
Maintenance free exterior; deck, newer Pella windows, fenced yard, and newer roof. Basement finished, kitchen totally redone, appliances (except washer & dryer) included, 3 baths, hardwood floors, move in condition.
-
2000-09-12$132,000
ⓘ Source: listings_history table (triggers on properties + properties_extension) + one-shot
backfill from property_details.listing_events for pre-trigger history.
Tax reassessment forecast IN · Partial reset (capped growth)
- Current annual tax
- $2,027 · $169/mo
- Projected year-2 tax
- $2,027 · $169/mo
- Expected delta
- $0/yr ($0/mo · 0.0%)
ⓘ Screening estimate from a state-policy table — verify with the county assessor before closing.
Climate risk First Street
- Flood 1/10 Low FEMA zone X · 0% chance over 30 yrs
- Wildfire 1/10 Low
- Heat 3/10 Moderate 7 d/yr ≥102°F today · 15 d/yr by 30 yrs out
- Wind 2/10 Low 0% chance of damaging wind over 30 yrs
- Air quality 4/10 Moderate 5 unhealthy d/yr today · 6 by 30 yrs out
Nearby sold comps map
Loading sold comps map…
Walkable amenities ~0.75 mi
Loading nearby amenities…
Taxation est. · year 1
- Rental income
- $24,149
- − Mortgage interest
- −$13,332
- − Property taxes
- −$2,027
- − Insurance
- −$1,190
- − Repairs & maintenance
- −$1,932
- − Management
- −$1,932
- − Depreciation
- −$6,924
- Taxable loss
- −$3,187
- Est. tax savings @ 24.0%
- +$765
- After-tax cash flow
- $1,648/yr
For passive investors: Depreciation is non-cash, so a rental often shows a tax loss while cash-flowing — sheltering income. Rental losses are passive: they offset passive income freely, and up to $25,000/yr can offset ordinary (W-2) income if you actively participate and your MAGI is under $100k (phasing out to $0 by $150k); unused losses carry forward. On sale, claimed depreciation is recaptured at up to 25%, and gains may owe capital-gains tax (a 1031 exchange can defer both). Figures are a year-1 estimate at your 24.0% rate — not tax advice; consult a CPA.
Schools (NCES district)
- District
- School City Of Hammond
- NCES district ID
- 1804320
- Math proficiency
- 8% ▼ -18.00%
- Reading proficiency
- 18% ▼ -15.00%
- Median HH income
- $39,970
- Composite
- 11.11/100
- National rank
- #9730
- State rank
- #289 of 301 in IN
Livability — Hammond
- Score
- 70/100
- State rank
- #143
- US rank
- #7343
Category grades
Schools grade is shown separately in the Schools card above.
Census & demographics
- Census place
- Hammond, IN
- County
- Lake County · 422,878 people
- City population
- 58,809
- Metro
- Chicago-Naperville-Elgin, IL-IN-WI
- Population (ZIP)
- 21,409
- Household income
- $63,052
- Rent vs Own
- Severe rent burden
- 507.0
Population outlook (Lake County) Hauer SSP2
- Today (2025)
- 484,026 people
- By 2030
- 478,091 · -1.2%
- By 2040
- 462,974 · -4.3%
- By 2050
- 449,894 · -7.1%
- By 2075
- 436,169 · -9.9%
- By 2100
- 426,607 · -11.9%
Race, ethnicity, and origin ACS 2023
- Neighborhood character
- Diverse neighborhood (Simpson 0.69)
- Race & ethnicity
- Hispanic / Latino 39% White 34% Black 22% Two or more races 14% Asian 1% Native American 1%
- Hispanic origin (detail)
- Mexican 31% Puerto Rican 5%
- Common ancestry
- Romanian 5% Lithuanian 1% Italian 1%
- Foreign-born
- 10% · Canada
- Languages at home
- 79% English-only · Spanish 20%
Political lean MEDSL · Lake
- 2024 margin
- Lean D (+5.6) · D 52.1% · R 46.5% · Other 1.5%
- 2008→2024 swing
- -28.6pp toward R · 2008: 34.3pp · 2024: 5.6pp
- All cycles
- 2024: D+5.6 2020: D+15.1 2016: D+20.6 2012: D+31.0 2008: D+34.3
Not yet ingested
- Civics
- —
Market trends
- HPI YoY
- ▼ -37.65%
- Current HPI
- 352.8678
- Rent YoY
- ▲ 5.51%
- Metro
- Chicago-Naperville-Elgin, IL-IN-WI
- State GDP YoY
- ▲ 2.90%
- F500 in state
- 18
Industry mix (Fortune 500 HQ in IN)
| Industry | F500 HQs | Revenue |
|---|---|---|
| Industrial Machinery | 2 | $37B |
|
||
| Healthcare | 1 | $177B |
|
||
| Pharmaceuticals | 1 | $45B |
|
||
| Metals / Steel | 1 | $18B |
|
||
| Agriculture | 1 | $17B |
|
||
| Packaging | 1 | $12B |
|
||
Price history
+80.3% since first listed4 events — show timeline
- 2026-05-22 Pending — NIRA MLS as Distributed by MLS Grid
- 2026-05-20 Listed $238,000 NIRA MLS as Distributed by MLS Grid
- 2002-01-13 Listed $137,000 NIRA MLS as Distributed by MLS Grid
- 2000-09-12 Listed $132,000 NIRA MLS as Distributed by MLS Grid
Property tax history
+2.0%/yrLatest (2024): $2,027 · -8.5% YoY. Source: county tax records.
Cash-flow waterfall
monthlySold comps — $/sqft
last 12 mo · ≤1 miLoading sold comps…