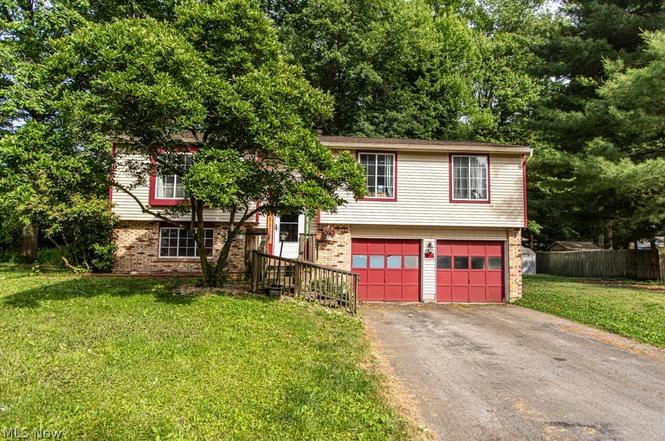
7764 Micawber Rd NE · Howland Center, OH
Flood risk 4/10 · Minor
- FEMA flood zone
- X (unshaded)
- Chance of flooding over 30 yrs
- 0.22%
- Est. flood insurance / yr
- $507 – $1,088
Fire risk 1/10 · Minimal
- Est. fire insurance / yr
- $713 – $1,323
Heat risk 2/10 · Minimal
- Hot days now (above 96°F)
- 7 days/yr
- Hot days in 30 yrs
- 17 days/yr
Wind risk 1/10 · Minimal
- Chance of severe wind over 30 yrs
- —
Air-quality risk 3/10 · Minor
- Unhealthy air days now
- 1 days/yr
- Unhealthy air days in 30 yrs
- 4 days/yr
Risk factors via First Street. Map © Google.
Why this score? — see what drove the B- grade
The composite is a weighted blend of 9 inputs, each scored 0–100. Each bar is that input's sub-score; the figure is the points it added to the 100-point composite (weight × sub-score).
- Cash flow +24.8/30.0
- ARV discount +15.0/15.0
- DSCR +8.0/10.0
- 1% rule +6.2/10.0
- Schools +5.3/10.0
- Livability +3.8/5.0
- Rent growth +2.5/5.0
- Condition / age +2.5/5.0
- Appreciation +0.0/10.0
$189,900
🖨 Deal sheet (PDF) 📄 Offer letter ✓ Due diligence
Listing remarks MLS
Don’t miss out on this find! This home has so much to offer! The house located in Warren with Holland Schools is in a nice quiet neighborhood. The sellers are not willing to make any repairs. With new paint, floors, and a bit of updating you will have your dream home! This 3 bed, 2.5 bath home also has a beautiful family room with a gorgeous fireplace with blower that will heat the entire home. All appliances stay. Roof less than 5yrs old gutters only 2 yrs. old, refrigerator 1yr old.
Key facts
- 0.47 acre lot
- 2 garage spots
- Built 1979
Property features AI
Exterior
- Parking: Attached garage; Garage (2 spaces); Paved parking
- Utilities: Public water; Public sewer
- Home design: Two-story home; Home warranty included
- Construction: Aluminum siding; Asphalt/fiberglass roof; Block foundation; Built (year source: public records)
- Exterior features: Irregular lot
Interior
- Kitchen: Dishwasher; Microwave; Range; Refrigerator
- Bedrooms: 3 main-level bedrooms
- Bathrooms: 2 full bathrooms; 1 half bathroom; 2 bathrooms on the main level
- Heating & cooling: Forced air heating (gas); Central air conditioning
- Interior features: Basement
- Laundry & utility: Washer; Dryer
Neighborhood map
What this means for you Summary
Snapshot
- This is a 3-bed/1.5-bath single-family listed at $190k.
Deal economics
- At list price, monthly cash flow is $402 ($5k/yr) — positive.
- The deal already cash-flows at list — no discount required.
- Meets the 1% rule at list price ($2k rent vs $190k).
- Cap rate 8.8% vs local median 3.9% in Howland Center — top-decile yield for the area; either an underpriced asset or a hidden risk that comps aren't pricing in. Stress-test before assuming the spread holds.
Location & tenants
- Location reads 76/100 on livability (#207 in OH, #3,283 nationally) — a middle-class / working-renter tenant base. Strengths: cost of living A+, housing A+, health & safety A+; Watch: amenities F, commute F.
- Howland Local (suburban): math 59% / reading 65% proficiency, ranked #260 of 656 in OH (top 40%) — acceptable for families but not a draw, mixed tenant base, ~2y average lease.
- Zoned schools: Mines Elementary School (math 67% / reading 58%, grade B, #580 of 1,584 statewide, top 37%, 330 students, 41% FRL); Howland Middle School (math 56% / reading 66%, grade B+, #252 of 654 statewide, top 39%, 766 students, 38% FRL); Howland High School (math 58% / reading 74%, grade B, #155 of 781 statewide, top 20%, 742 students, 38% FRL).
- Market conditions: 90 active listings in the ZIP; 2 comparable units currently listed for rent nearby; 129 units permitted in Trumbull County in 2024 (0 in 5+ unit buildings).
- This rent runs 39% of the median local income ($65k/yr) — at the standard rent-burdened threshold; future hikes will face affordability resistance.
Forward outlook
- Local home prices are declining (-3.0%/yr); year-one equity from $1k of loan paydown is wiped out by about $6k of value loss. Plan a longer hold.
- Trumbull County population projected at -22% by 2050 — secular population decline; favor cash flow + early exit over multi-decade hold.
Negotiation context
- Only 11 days on market — expect competitive offers; lowballing is unlikely to land.
- 2 sale attempts since 4y ago with the ask held roughly flat each time — persistent listings suggest the price (not the market) is what's stuck; bring a comps-based counter.
- Current owner paid $124k; list at $190k implies a 53% gain — meaningful room to come down on a strong offer.
Questions for the listing agent
- Built in 1979 — when were the roof, HVAC, electrical panel, plumbing, and water heater last replaced?
- Is there a deadline driving the sale (1031 exchange, divorce, estate, relocation)? That informs how much negotiation room exists.
- Schools are B-rated — typically a magnet for longer-tenancy family renters. What's the average tenant stay here, and is there a school-zone premium baked into asking?
- What's the average days-on-market for RENTAL listings here right now (not sales)? A rising rental-DOM trend means longer vacancies and softer asking-rent achievability than the comps imply.
- What's the recent tenant-quality profile in this submarket — average credit score on applications, eviction rate, late-payment / NSF rate, and stable-employment percentage? A property-management company in the area should have these aggregated.
- How much new for-sale + rental construction is in the pipeline within 1–3 miles? Heavy new supply typically softens prices + rents 12–24 months out; constrained supply supports both.
Investment metrics
- 1% rule
- 1.12% ✓
- Cap rate
- 8.84%
- Cash-on-cash
- 9.08%
- DSCR
- 1.40
- GRM
- 7.4
CMA / ARV
- ARV (on-the-fly)
- $237,330
- Comps found
- 12
Show comp detail 12 sales within ~0.75 mi
| Address | Dist | Beds/Ba | Sqft | Sold | Price | $/sf | Match |
|---|---|---|---|---|---|---|---|
| 7797 Raglan Dr | 0.07mi | 3/2.5 | 1,758 (0%) | 8mo | $237,000 | $135 | 85 |
| 1495 Castillion Dr NE | 0.15mi | 3/2.0 | 1,620 (-8%) | 14mo | $255,000 | $157 | 66 |
| 7770 Castle Rock Dr NE | 0.31mi | 3/2.0 | 1,669 (-5%) | 14mo | $195,000 | $117 | 63 |
| 7915 Brookwood St NE | 0.38mi | 4/2.0 (+1) | 1,628 (-7%) | 2mo | $240,000 | $147 | 62 |
| 8094 Castle Rock Dr NE | 0.42mi | 4/2.0 (+1) | 1,783 (+1%) | 12mo | $249,000 | $140 | 61 |
| 8080 Glen Oaks | 0.47mi | 4/2.5 (+1) | 1,792 (+2%) | 10mo | $186,000 | $104 | 58 |
| 1358 Cranbrook Dr NE | 0.58mi | 3/2.0 | 1,714 (-2%) | 14mo | $263,000 | $153 | 55 |
| 7814 Sutton Pl NE | 0.22mi | 3/2.0 | 1,520 (-14%) | 13mo | $232,000 | $153 | 54 |
| 7751 Castle Rock Dr NE | 0.32mi | 3/1.0 | 1,508 (-14%) | 8mo | $165,000 | $109 | 53 |
| 8077 Glen Oaks Dr NE | 0.45mi | 3/2.0 | 1,892 (+8%) | 14mo | $250,000 | $132 | 53 |
| 8001 Cherry Hl | 0.50mi | 4/1.5 (+1) | 1,632 (-7%) | 11mo | $177,000 | $108 | 51 |
| 7985 Venice Heights Dr NE | 0.60mi | 4/2.0 (+1) | 1,800 (+2%) | 14mo | $185,000 | $103 | 50 |
Match score weights: distance 35% · size 25% · config 20% · recency 20%. Top-matched comps best support the ARV.
Projected returns pro-forma
-3.0% appreciation · 3.0% rent growth · sell at horizon
- IRR
- -2.6%
- Equity multiple
- 0.90×
- Total profit
- $-5,127
- Equity at exit
- $28,315
- IRR
- 7.1%
- Equity multiple
- 1.54×
- Total profit
- $28,593
- Equity at exit
- $16,419
Cash invested: $53,172 (down + closing). Projections, not guarantees.
Landlord ↔ Tenant lean methodology
- Overall (STATE)
- 73 Landlord-Friendly
- State Ohio
- 73 Landlord-Friendly · R+6
- County
- — inherits STATE
- City
- — inherits STATE
ZIP-level market 44484
- Home prices YoY
- -17.5%
- Active inventory
- 90
- Price-to-rent
- 7.4×
Monthly cashflow live
- Estimated rent
- $2,130 medium interval (Pro) →
- Mortgage (P&I)
- −$996
- Tax from tax record
- −$205 /mo · $2,466/yr
- Insurance
- −$79
- HOA
- −$0
- Vacancy / Maint / Mgmt
- −$447
- Net cashflow
- $402
Break-even live
Sensitivity live
| Price | -10% $510 | -5% $456 | +0% $402 | +5% $349 | +10% $295 |
|---|---|---|---|---|---|
| Rent | -10% $234 | -5% $318 | +0% $402 | +5% $487 | +10% $571 |
| Rate | -1.0pp $498 | -0.5pp $451 | base $402 | +0.5pp $353 | +1.0pp $303 |
UW: 25.0% down · 7.5% · 30yr · 1.5% tax · 5.0% vac · 8.0% maint · 8.0% mgmt
Financing live
Cash to close
- Down payment
- $47,475
- Closing costs
- $5,697
- Reserves months
- —
- Total cash needed
- —
Loan-product check · same deal, 3 products live
Conventional
25% down · 7.5% · 30yr
- Down + closing
- —
- Monthly P&I
- —
- Monthly cashflow
- —
- DSCR
- —
- Eligible?
- —
Personal DTI + credit; lowest rate.
DSCR
20% down · 8.5% · 30yr
- Down + closing
- —
- Monthly P&I
- —
- Monthly cashflow
- —
- DSCR
- —
- Eligible?
- —
No personal income docs; deal must DSCR.
Hard money
10% down · 12.0% · 12mo
- Down + closing
- —
- Monthly P&I
- —
- Monthly cashflow
- —
- DSCR
- —
- Eligible?
- —
Short-term bridge; refi at stabilization.
Rent comps 2 comps
| Address | Beds | Baths | Sqft | Rent | $/sqft | DOM | Units | Dist |
|---|---|---|---|---|---|---|---|---|
| 300 Pegotty Ct NE Warren, OH | 3.0 | 2.5 | 1820 | $2,300 | $1.26 | 15d | 1 | 0.27mi |
| 1826 Cranberry Ln NE Warren, OH | 2.0–3.0 | 1.5 | 1389 | $1,160 | $0.83 | 15d | 1 | 1.24mi |
Listing history 9 events
-
2026-06-22days on market $189,900 Active 11 DOM
-
2026-06-19days on market $189,900 Active 9 DOM
-
2026-06-18days on market $189,900 Active 8 DOM
-
2026-06-17days on market $189,900 Active 7 DOM
-
2026-06-16days on market $189,900 Active 6 DOM
-
2026-06-15days on market $189,900 Active 5 DOM
-
2026-06-14days on market $189,900 Active 3 DOM
-
2026-06-13remarks 439-char remark
-
2026-06-13$189,900 Active 2 DOM
ⓘ Source: listings_history table (triggers on properties + properties_extension) + one-shot
backfill from property_details.listing_events for pre-trigger history.
Tax reassessment forecast OH · Partial reset (capped growth)
- Current annual tax
- $2,466 · $205/mo
- Projected year-2 tax
- $2,714 · $226/mo
- Expected delta
- +$248/yr (+$21/mo · 10.1%)
ⓘ Screening estimate from a state-policy table — verify with the county assessor before closing.
Climate risk First Street
- Flood 4/10 Moderate FEMA zone X (unshaded) · 22% chance over 30 yrs
- Wildfire 1/10 Low
- Heat 2/10 Low 7 d/yr ≥96°F today · 17 d/yr by 30 yrs out
- Wind 1/10 Low
- Air quality 3/10 Moderate 1 unhealthy d/yr today · 4 by 30 yrs out
Nearby sold comps map
Loading sold comps map…
Walkable amenities ~0.75 mi
Loading nearby amenities…
Taxation est. · year 1
- Rental income
- $25,563
- − Mortgage interest
- −$10,637
- − Property taxes
- −$2,466
- − Insurance
- −$950
- − Repairs & maintenance
- −$2,045
- − Management
- −$2,045
- − Depreciation
- −$5,524
- Taxable income
- $1,896
- Est. tax owed @ 24.0%
- −$455
- After-tax cash flow
- $4,374/yr
For passive investors: Depreciation is non-cash, so a rental often shows a tax loss while cash-flowing — sheltering income. Rental losses are passive: they offset passive income freely, and up to $25,000/yr can offset ordinary (W-2) income if you actively participate and your MAGI is under $100k (phasing out to $0 by $150k); unused losses carry forward. On sale, claimed depreciation is recaptured at up to 25%, and gains may owe capital-gains tax (a 1031 exchange can defer both). Figures are a year-1 estimate at your 24.0% rate — not tax advice; consult a CPA.
Schools (NCES district)
- District
- Howland Local
- NCES district ID
- 3905016
- Math proficiency
- 59% ▼ -17.00%
- Reading proficiency
- 65% ▼ -13.00%
- Median HH income
- $49,022
- Composite
- 52.63/100
- National rank
- #1556
- State rank
- #260 of 656 in OH
Livability — Howland Center
- Score
- 76/100
- State rank
- #207
- US rank
- #3283
Category grades
Schools grade is shown separately in the Schools card above.
Census & demographics
- Census place
- Howland Center, OH
- County
- Trumbull · 193,293 people
- City population
- 21,634
- Metro
- Youngstown-Warren, OH
- Population (ZIP)
- 21,634
- Household income
- $65,435
- Rent vs Own
- Severe rent burden
- 6.7
Population outlook (Trumbull County) Hauer SSP2
- Today (2025)
- 191,696 people
- By 2030
- 184,015 · -4.0%
- By 2040
- 166,810 · -13.0%
- By 2050
- 149,857 · -21.8%
- By 2075
- 115,769 · -39.6%
- By 2100
- 83,617 · -56.4%
Race, ethnicity, and origin ACS 2023
- Neighborhood character
- Predominantly White (84%)
- Race & ethnicity
- White 84% Black 8% Two or more races 5% Hispanic / Latino 3% Asian 2%
- Common ancestry
- Romanian 3% Lithuanian 2% Serbian 1%
- Foreign-born
- 3% · China, Canada
- Languages at home
- 96% English-only · Other Indo-European 2% Other Asian/Pacific 1% Spanish 1%
Political lean MEDSL · Trumbull
- 2024 margin
- R (+16.8) · D 41.2% · R 58.0%
- 2008→2024 swing
- -39.2pp toward R · 2008: 22.4pp · 2024: -16.8pp
- All cycles
- 2024: R+16.8 2020: R+10.6 2016: R+6.4 2012: D+22.2 2008: D+22.4
Not yet ingested
- Civics
- —
Market trends
- HPI YoY
- ▼ -46.24%
- Current HPI
- 217.6603
- Rent YoY
- —
- Metro
- —
- State GDP YoY
- ▲ 1.98%
- F500 in state
- 48
Industry mix (Fortune 500 HQ in OH)
| Industry | F500 HQs | Revenue |
|---|---|---|
| Insurance | 3 | $145B |
|
||
| Industrial Machinery | 3 | $49B |
|
||
| Financial Services | 3 | $24B |
|
||
| Consumer Goods | 2 | $93B |
|
||
| Aerospace / Defense | 2 | $47B |
|
||
| Utilities | 2 | $33B |
|
||
Price history
+208.8% since first listed9 events — show timeline
- 2026-06-10 Listed $189,900 MLSNOW
- 2022-06-06 Sold (Public Records) $124,000 Public Records
- 2022-06-03 Pending — MLSNOW
- 2022-06-03 Sold (MLS) $124,000 MLSNOW
- 2022-05-02 Contingent — MLSNOW
- 2022-04-21 Price Changed $135,900 MLSNOW
- 2022-04-04 Listed $142,900 MLSNOW
- 1993-11-29 Sold (Public Records) $77,000 Public Records
- 1985-12-24 Sold (Public Records) $61,500 Public Records
Property tax history
+2.6%/yrLatest (2025): $2,466 · +0.6% YoY. Source: county tax records.
Cash-flow waterfall
monthlySold comps — $/sqft
last 12 mo · ≤1 miLoading sold comps…