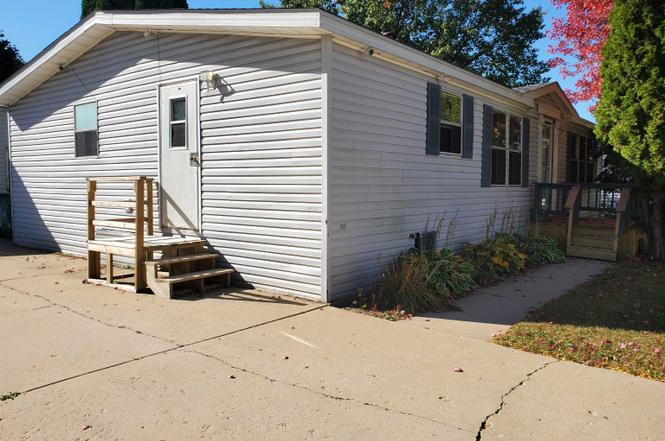
5421 Ebonywood Ln · Roscoe, IL
Flood risk 1/10 · Minimal
- FEMA flood zone
- X (unshaded)
- Chance of flooding over 30 yrs
- 0.0%
- Est. flood insurance / yr
- $507 – $1,088
Fire risk 1/10 · Minimal
- Est. fire insurance / yr
- $804 – $1,492
Heat risk 3/10 · Minor
- Hot days now (above 101°F)
- 7 days/yr
- Hot days in 30 yrs
- 15 days/yr
Wind risk 2/10 · Minimal
- Chance of severe wind over 30 yrs
- —
Air-quality risk 3/10 · Minor
- Unhealthy air days now
- 2 days/yr
- Unhealthy air days in 30 yrs
- 3 days/yr
Risk factors via First Street. Map © Google.
Why this score? — see what drove the D grade
The composite is a weighted blend of 9 inputs, each scored 0–100. Each bar is that input's sub-score; the figure is the points it added to the 100-point composite (weight × sub-score).
- Cash flow +15.0/30.0
- ARV discount +7.5/15.0
- 1% rule +5.0/10.0
- DSCR +5.0/10.0
- Livability +4.1/5.0
- Rent growth +2.5/5.0
- Condition / age +2.5/5.0
- Schools +1.8/10.0
- Appreciation +0.0/10.0
$30,000
🖨 Deal sheet 📄 Offer letter ✓ Due diligence
Listing remarks
Diamond in the Rough! Opportunity in Forest View 55+ Community! Comfortable 3 bedroom, 2 bath home featuring a desirable split floor plan with a private primary suite. Enjoy a fenced backyard and an oversized 2.5 car garage. Property needs work and is priced accordingly, offering excellent potential for investors or owner-occupants. Property is being sold As-Is. Cash Offers Only!
Key facts
- 2 garage spots
- Built 1994
- Listed 140 days
Property features AI
Finance
- HOA & community: Homeowners association with a monthly fee of $773
Exterior
- Parking: Detached garage; Approximately 2.5 garage spaces
- Utilities: Public water service; Public sewer service
- Home design: Residential mobile home
- Exterior features: Shingle roof; Public water; Public sewer
Interior
- Bathrooms: Two full bathrooms; Two main-level bathrooms
- Interior features: Gas water heater; Central air conditioning; Forced air heating (natural gas)
Neighborhood map
What this means for you Summary
Snapshot
- This is a 3-bed/2.0-bath manufactured listed at $30k.
Deal economics
- At list price, monthly cash flow is $380 ($5k/yr) — positive.
- The deal already cash-flows at list — no discount required.
- Meets the 1% rule at list price ($2k rent vs $30k).
- Recommended offer: $26k (12.0% below list) — sets the bar for market timing.
- Cap rate 21.5% vs local median 2.8% in Roscoe — top-decile yield for the area; either an underpriced asset or a hidden risk that comps aren't pricing in. Stress-test before assuming the spread holds.
Location & tenants
- Location reads 82/100 on livability (#61 in IL, #1,071 nationally) — a professional / high-income tenant draw. Strengths: crime A+, employment A+, cost of living A+; Watch: amenities F, commute F.
- Harlem UD 122 (suburban): math 17% / reading 23% proficiency, ranked #418 of 620 in IL (top 67%) — low school quality limits family demand, transient renter base, plan for 1-2y turnover.
- Zoned schools: Olson Park Elem School (math 29% / reading 37%, grade F, #577 of 2,056 statewide, top 28%, 343 students, 0% FRL); Harlem High School (math 18% / reading 23%, grade F, #350 of 693 statewide, top 51%, 1,875 students, 0% FRL) — zoned schools average 0% FRL vs 45% district-wide (45 pts lower); this property's tenant base skews higher-income than the district average.
- Market conditions: 115 active listings in the ZIP; 2 comparable units currently listed for rent nearby; 285 units permitted in Winnebago County in 2024 (0 in 5+ unit buildings).
Forward outlook
- Local home prices are declining (-3.0%/yr); year-one equity from $207 of loan paydown is wiped out by about $900 of value loss. Plan a longer hold.
- Winnebago County population projected at -20% by 2050 — secular population decline; favor cash flow + early exit over multi-decade hold.
- At projected returns (-3.0% appreciation + 3.0% rent growth), your $8k cash investment doubles in ~3 years — after that, you're playing with house money.
Negotiation context
- It's been on market 141 days — a 12% lower offer ($26k) is reasonable based on typical stale-listing flexibility.
Risks & watch-outs
- Watch-outs: HOA is 45% of rent.
Questions for the listing agent
- It's been on market 141 days. Have you received any prior offers? Is the seller open to a 12% concession, seller financing, or rate buy-down credit?
- What does the HOA fee cover, when was the last increase, and are there any pending special assessments or reserve-fund shortfalls?
- Why hasn't it sold? Are there any deal-killer items the seller is aware of (foundation, flood, title, zoning, code violations)?
- Is there a deadline driving the sale (1031 exchange, divorce, estate, relocation)? That informs how much negotiation room exists.
- Schools are B-rated — typically a magnet for longer-tenancy family renters. What's the average tenant stay here, and is there a school-zone premium baked into asking?
- The area grade is low — what's the realistic commute time and amenity access for the typical tenant pool here? Any planned neighborhood developments (good or bad) we should know about?
- What's the average days-on-market for RENTAL listings here right now (not sales)? A rising rental-DOM trend means longer vacancies and softer asking-rent achievability than the comps imply.
- What's the recent tenant-quality profile in this submarket — average credit score on applications, eviction rate, late-payment / NSF rate, and stable-employment percentage? A property-management company in the area should have these aggregated.
- How much new for-sale + rental construction is in the pipeline within 1–3 miles? Heavy new supply typically softens prices + rents 12–24 months out; constrained supply supports both.
Investment metrics
- 1% rule
- 5.74% ✓
- Cap rate
- 21.47%
- Cash-on-cash
- 54.22%
- DSCR
- 3.41
- GRM
- 1.5
CMA / ARV
- ARV (on-the-fly)
- $74,844
- Comps found
- 12
Show comp detail 12 sales within ~0.75 mi
| Address | Dist | Beds/Ba | Sqft | Sold | Price | $/sf | Match |
|---|---|---|---|---|---|---|---|
| 5476 Ebonywood Ln | 0.06mi | 3/2.0 | 1,456 (+5%) | 1mo | $66,500 | $46 | 88 |
| 5396 Heartwood Ln | 0.04mi | 3/2.0 | 1,344 (-3%) | 7mo | $23,500 | $17 | 87 |
| 5447 Autumnash Ln | 0.11mi | 3/2.0 | 1,352 (-2%) | 7mo | $73,000 | $54 | 84 |
| 5411 Autumnash Ln | 0.10mi | 3/2.0 | 1,456 (+5%) | 4mo | $87,000 | $60 | 83 |
| 5492 Heartwood Ln | 0.08mi | 3/2.0 | 1,456 (+5%) | 9mo | $50,000 | $34 | 80 |
| 8581 Springwood Ct | 0.14mi | 3/2.0 | 1,456 (+5%) | 6mo | $77,400 | $53 | 80 |
| 5381 Cypress Ln | 0.14mi | 3/2.0 | 1,456 (+5%) | 11mo | $84,000 | $58 | 76 |
| 5370 Irving Dr | 0.17mi | 3/2.0 | 1,456 (+5%) | 14mo | $93,000 | $64 | 72 |
| 5367 Autumnash Ln | 0.10mi | 3/2.0 | 1,456 (+5%) | 21mo | $65,000 | $45 | 69 |
| 5437 Cypress Ln | 0.15mi | 3/2.0 | 1,456 (+5%) | 22mo | $97,000 | $67 | 66 |
| 5477 White Pine Ln | 0.14mi | 3/2.0 | 1,568 (+13%) | 10mo | $87,500 | $56 | 63 |
| 8402 Tamarack Dr | 0.35mi | 3/2.0 | 1,568 (+13%) | 18mo | $70,000 | $45 | 47 |
Match score weights: distance 35% · size 25% · config 20% · recency 20%. Top-matched comps best support the ARV.
Projected returns pro-forma
-3.0% appreciation · 3.0% rent growth · sell at horizon
- IRR
- 53.1%
- Equity multiple
- 3.36×
- Total profit
- $19,811
- Equity at exit
- $4,473
- IRR
- 58.6%
- Equity multiple
- 7.00×
- Total profit
- $50,411
- Equity at exit
- $2,594
Cash invested: $8,400 (down + closing). Projections, not guarantees.
Landlord ↔ Tenant lean methodology
- Overall (STATE)
- 43 Moderately Tenant-Leaning
- State Illinois
- 43 Moderately Tenant-Leaning · D+7
- County
- — inherits STATE
- City
- — inherits STATE
ZIP-level market 61073
- Home prices YoY
- -34.5%
- Active inventory
- 115
- Price-to-rent
- 1.5×
Monthly cashflow live
- Estimated rent
- $1,721 medium interval (Pro) →
- Mortgage (P&I)
- −$157
- Tax est. 1.5%
- −$38 /mo · $450/yr
- Insurance
- −$12
- HOA
- −$773
- Vacancy / Maint / Mgmt
- −$361
- Net cashflow
- $380
Break-even live
UW: 25.0% down · 7.5% · 30yr · 1.5% tax · 5.0% vac · 8.0% maint · 8.0% mgmt
Financing live
Cash to close
- Down payment
- $7,500
- Closing costs
- $900
- Reserves months
- —
- Total cash needed
- —
Loan-product check · same deal, 3 products live
Conventional
25% down · 7.5% · 30yr
- Down + closing
- —
- Monthly P&I
- —
- Monthly cashflow
- —
- DSCR
- —
- Eligible?
- —
Personal DTI + credit; lowest rate.
DSCR
20% down · 8.5% · 30yr
- Down + closing
- —
- Monthly P&I
- —
- Monthly cashflow
- —
- DSCR
- —
- Eligible?
- —
No personal income docs; deal must DSCR.
Hard money
10% down · 12.0% · 12mo
- Down + closing
- —
- Monthly P&I
- —
- Monthly cashflow
- —
- DSCR
- —
- Eligible?
- —
Short-term bridge; refi at stabilization.
Rent comps 2 comps
| Address | Beds | Baths | Sqft | Rent | $/sqft | DOM | Units | Dist |
|---|---|---|---|---|---|---|---|---|
| 5515 Tall Pines Pkwy Unit 1 Roscoe, IL | 2.0 | 1.0 | 1100 | $1,450 | $1.32 | 13d | 1 | 0.99mi |
| 6410 Harvest Ln Machesney Park, IL | 2.0–3.0 | 2.0 | 1535 | $2,000 | $1.30 | 13d | 2 | 1.15mi |
HOA detail
- Monthly dues
- $773 · $9,276/yr
Listing history 17 events
-
2026-06-19days on market $30,000 Active 141 DOM
-
2026-06-18days on market $30,000 Active 140 DOM
-
2026-06-17days on market $30,000 Active 139 DOM
-
2026-06-16days on market $30,000 Active 138 DOM
-
2026-06-15days on market $30,000 Active 137 DOM
-
2026-06-14days on market $30,000 Active 135 DOM
-
2026-06-13days on market $30,000 Active 134 DOM
-
2026-06-10days on market $30,000 Active 132 DOM
-
2026-06-09days on market $30,000 Active 131 DOM
-
2026-06-08days on market $30,000 Active 130 DOM
-
2026-06-07days on market $30,000 Active 129 DOM
-
2026-06-03days on market $30,000 Active 125 DOM
-
2026-06-02days on market $30,000 Active 124 DOM
-
2026-06-01days on market $30,000 Active 123 DOM
-
2026-05-31days on market $30,000 Active 122 DOM
-
2026-05-30days on market $30,000 Active 121 DOM
-
2026-01-29$30,000 Active
ⓘ Source: listings_history table (triggers on properties + properties_extension) + one-shot
backfill from property_details.listing_events for pre-trigger history.
Climate risk First Street
- Flood 1/10 Low FEMA zone X (unshaded) · 0% chance over 30 yrs
- Wildfire 1/10 Low
- Heat 3/10 Moderate 7 d/yr ≥101°F today · 15 d/yr by 30 yrs out
- Wind 2/10 Low
- Air quality 3/10 Moderate 2 unhealthy d/yr today · 3 by 30 yrs out
Nearby sold comps map
Loading sold comps map…
Walkable amenities ~0.75 mi
Loading nearby amenities…
Taxation est. · year 1
- Rental income
- $20,656
- − Mortgage interest
- −$1,680
- − Property taxes
- −$450
- − Insurance
- −$150
- − Repairs & maintenance
- −$1,652
- − Management
- −$1,652
- − HOA
- −$9,276
- − Depreciation
- −$873
- Taxable income
- $4,922
- Est. tax owed @ 24.0%
- −$1,181
- After-tax cash flow
- $3,373/yr
For passive investors: Depreciation is non-cash, so a rental often shows a tax loss while cash-flowing — sheltering income. Rental losses are passive: they offset passive income freely, and up to $25,000/yr can offset ordinary (W-2) income if you actively participate and your MAGI is under $100k (phasing out to $0 by $150k); unused losses carry forward. On sale, claimed depreciation is recaptured at up to 25%, and gains may owe capital-gains tax (a 1031 exchange can defer both). Figures are a year-1 estimate at your 24.0% rate — not tax advice; consult a CPA.
Schools (NCES district)
- District
- Harlem UD 122
- NCES district ID
- 1718240
- Math proficiency
- 17% ▼ -8.00%
- Reading proficiency
- 23% ▼ -7.00%
- Median HH income
- $51,228
- Composite
- 18.01/100
- National rank
- #8982
- State rank
- #418 of 620 in IL
Livability — Roscoe
- Score
- 82/100
- State rank
- #61
- US rank
- #1071
Category grades
Schools grade is shown separately in the Schools card above.
Census & demographics
- Census place
- Roscoe, IL
- City population
- 20,008
- Population (ZIP)
- 20,008
Population outlook (Winnebago County) Hauer SSP2
- Today (2025)
- 271,080 people
- By 2030
- 260,684 · -3.8%
- By 2040
- 238,405 · -12.1%
- By 2050
- 216,129 · -20.3%
- By 2075
- 172,882 · -36.2%
- By 2100
- 135,336 · -50.1%
Race, ethnicity, and origin ACS 2023
- Neighborhood character
- Predominantly White (86%)
- Race & ethnicity
- White 86% Hispanic / Latino 7% Two or more races 6% Black 3% Asian 2%
- Hispanic origin (detail)
- Mexican 5%
- Common ancestry
- Romanian 6% Portuguese 3% Lithuanian 2%
- Foreign-born
- 4% · Canada, China
- Languages at home
- 94% English-only · Spanish 4% Other Indo-European 1% Russian/Polish/Slavic 1%
Political lean MEDSL · Winnebago
- 2024 margin
- Toss-up / Even · D 49.5% · R 49.0% · Other 1.5%
- 2008→2024 swing
- -12.2pp toward R · 2008: 12.8pp · 2024: 0.6pp
- All cycles
- 2024: D+0.6 2020: D+2.5 2016: R+1.2 2012: D+5.7 2008: D+12.8
Not yet ingested
- Civics
- —
Market trends
- HPI YoY
- ▼ -131.22%
- Current HPI
- 248.8712
- Rent YoY
- —
- Metro
- —
- State GDP YoY
- ▲ 1.59%
- F500 in state
- 60
Industry mix (Fortune 500 HQ in IL)
| Industry | F500 HQs | Revenue |
|---|---|---|
| Insurance | 4 | $201B |
|
||
| Consumer Goods | 4 | $87B |
|
||
| Industrial Machinery | 3 | $64B |
|
||
| Healthcare | 2 | $55B |
|
||
| Retail / Pharmacy | 1 | $148B |
|
||
| Agriculture / Food | 1 | $86B |
|
||
Price history
1 event — show timeline
- 2026-01-29 Listed $30,000 NWIAR
Cash-flow waterfall
monthlySold comps — $/sqft
last 12 mo · ≤1 miLoading sold comps…