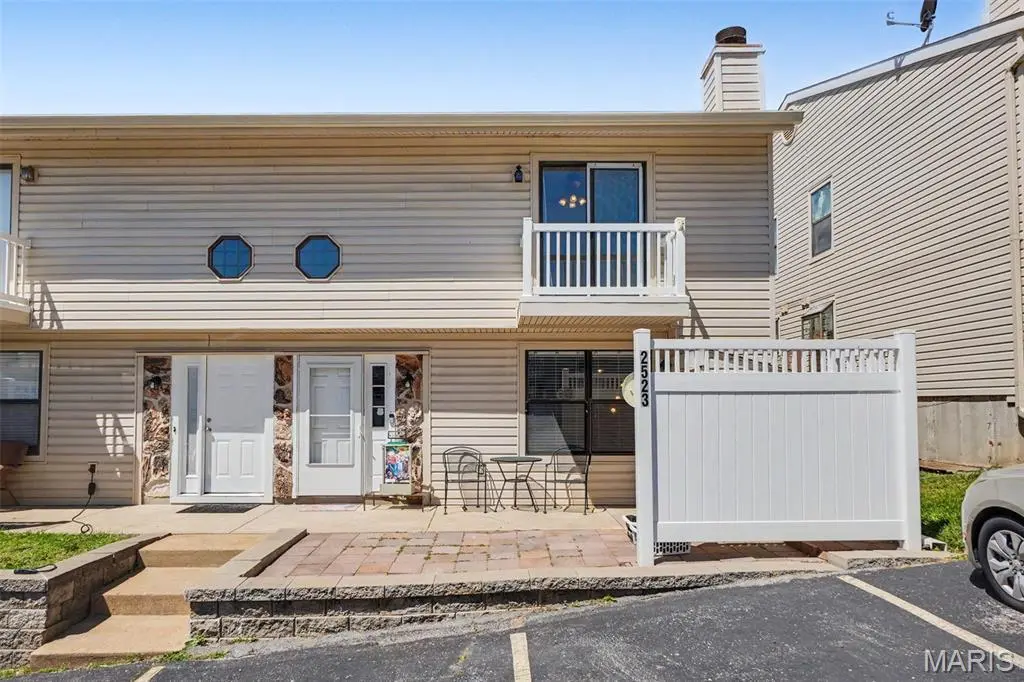
2523 Wyaconda Ct · Arnold, MO
Flood risk 1/10 · Minimal
- FEMA flood zone
- X (unshaded)
- Chance of flooding over 30 yrs
- 0.0%
- Est. flood insurance / yr
- $507 – $1,088
Fire risk 3/10 · Minor
- Est. fire insurance / yr
- $1,054 – $1,958
Heat risk 5/10 · Moderate
- Hot days now (above 107°F)
- 7 days/yr
- Hot days in 30 yrs
- 22 days/yr
Wind risk 2/10 · Minimal
- Chance of severe wind over 30 yrs
- 1.0%
Air-quality risk 2/10 · Minimal
- Unhealthy air days now
- 1 days/yr
- Unhealthy air days in 30 yrs
- 2 days/yr
Risk factors via First Street. Map © Google.
Why this score? — see what drove the F grade
The composite is a weighted blend of 9 inputs, each scored 0–100. Each bar is that input's sub-score; the figure is the points it added to the 100-point composite (weight × sub-score).
- Cash flow +10.4/30.0
- Rent growth +4.4/5.0
- Schools +3.8/10.0
- ARV discount +3.4/15.0
- 1% rule +3.2/10.0
- Livability +3.1/5.0
- DSCR +3.0/10.0
- Condition / age +2.5/5.0
- Appreciation +0.0/10.0
$139,900
🖨 Deal sheet (PDF) 📄 Offer letter ✓ Due diligence
Listing remarks
Welcome home to this charming 2-story townhouse in the heart of Fenton! Conveniently located just minutes from Gravois Bluffs, shopping and dining in Arnold, and easy access to Highway 141, I-55, Highway 21, & Highway 30, this home offers both convenience and low-maintenance living. The main floor features a spacious living room, an updated kitchen with a custom pantry and dining area, convenient main-floor laundry, and a half bath. Upstairs, you’ll find two generously sized bedrooms and a full bath complete with an added storage cabinet for extra organization. Fresh updates throughout include new flooring and updated paint, giving the home a clean, modern feel. Enjoy bonus outd
Key facts
- Private balcony
- Custom pantry
- Main floor laundry
Tags
Property features AI
Finance
- Other: No other grouped amenities provided
- Financial info: No additional financial details provided
- HOA & community: HOA: Bluff View; HOA fee $110 per month; HOA covers exterior maintenance, parking/road maintenance, and trash; Association amenities listed as None
Exterior
- Parking: No parking details provided
- Security: No security details provided
- Utilities: Public water; Public sewer; Electric service by Ameren; Electricity, water, and sewer connected
- Home design: Townhouse; Residential property; Two levels; Entry level information not provided; Facing direction not provided
- Construction: Vinyl siding
- Exterior features: Small lot (about 0.03 acre); Lot described as 'Other'
Interior
- Kitchen: No kitchen appliance details provided
- Bedrooms: 2 bedrooms (both on the upper level)
- Flooring: No flooring details provided
- Bathrooms: 1 full bathroom; 1 half bathroom (main level)
- Heating & cooling: Electric heating; Central air conditioning
- Interior features: Fireplace in the living room; Central air
- Laundry & utility: No laundry details provided
Neighborhood map
What this means for you Summary
Snapshot
- This is a 2-bed/1.5-bath townhouse listed at $140k.
Deal economics
- At list price, monthly cash flow is $-74 ($-883/yr) — negative.
- To cash-flow at today's rent, offer at most $127k (9.3% below list).
- To meet the 1% rule (rent ≥ 1% of price), the offer needs to be $115k (17.9% below list).
- Recommended offer: $115k (17.9% below list) — sets the bar for 1% rule.
- Cap rate 5.7% vs local median 3.7% in Arnold — top-decile yield for the area; either an underpriced asset or a hidden risk that comps aren't pricing in. Stress-test before assuming the spread holds.
Location & tenants
- Location reads 62/100 on livability (#396 in MO) — a middle-class / working-renter tenant base. Strengths: cost of living A+, housing A+, employment B; Watch: crime D+, amenities F, commute F.
- Fox C-6 (suburban): math 35% / reading 50% proficiency, ranked #103 of 324 in MO (top 32%) — families likely to look elsewhere, expect single-tenant / working-renter base with shorter leases.
- Zoned schools: Meramec Heights Elem. (math 39% / reading 42%, grade F, #525 of 1,115 statewide, top 47%, 425 students, 52% FRL); Fox Sr. High (math 12% / reading 57%, grade F, #321 of 521 statewide, top 67%, 1,742 students, 28% FRL).
- Market conditions: Rents rising fast (+7.7%/yr); 150 active listings in the ZIP; solid renter incomes; 807 units permitted in Jefferson County in 2024 (104 in 5+ unit buildings).
- This rent is only 14% of the median local income ($98k/yr) — well below the 30% rent-burden line; pricing power to push rent on renewal without tenant pushback.
Forward outlook
- Local home prices are declining (-3.0%/yr); year-one equity from $967 of loan paydown is wiped out by about $4k of value loss. Plan a longer hold.
Negotiation context
- Only 14 days on market — expect competitive offers; lowballing is unlikely to land.
- Current owner paid $90k; list at $140k implies a 56% gain — meaningful room to come down on a strong offer.
Risks & watch-outs
- Climate carrying-cost: extreme-heat days projected 7→22/yr by 2055 (HVAC capex compounding) — expect insurance premiums to compound above CPI over the hold.
Questions for the listing agent
- What do current leases actually rent for vs. the listed asking? Can we see a recent rent roll and the last 12 months of T-12 income?
- What does the HOA fee cover, when was the last increase, and are there any pending special assessments or reserve-fund shortfalls?
- Is there a deadline driving the sale (1031 exchange, divorce, estate, relocation)? That informs how much negotiation room exists.
- Schools are D-rated, which usually means shorter tenancies and higher turnover. Who's the typical renter profile here, and what's been the actual vacancy rate?
- Crime grade is D in this area — have there been break-ins, vandalism, or insurance claims at this property in the last 3 years? What carrier currently insures it and at what premium?
- The area grade is low — what's the realistic commute time and amenity access for the typical tenant pool here? Any planned neighborhood developments (good or bad) we should know about?
- What's the average days-on-market for RENTAL listings here right now (not sales)? A rising rental-DOM trend means longer vacancies and softer asking-rent achievability than the comps imply.
- What's the recent tenant-quality profile in this submarket — average credit score on applications, eviction rate, late-payment / NSF rate, and stable-employment percentage? A property-management company in the area should have these aggregated.
- How much new for-sale + rental construction is in the pipeline within 1–3 miles? Heavy new supply typically softens prices + rents 12–24 months out; constrained supply supports both.
Investment metrics
- 1% rule
- 0.82% ✗
- Cap rate
- 5.66%
- Cash-on-cash
- -2.25%
- DSCR
- 0.90
- GRM
- 10.1
CMA / ARV
- ARV (median comp)
- $128,228
- List price
- $139,900
- Delta
- 9.10%
- Verdict
- FAIR
- Comps
- 12 within 1.0 mi
Projected returns pro-forma
-3.0% appreciation · 7.72% rent growth · sell at horizon
- IRR
- -14.8%
- Equity multiple
- 0.45×
- Total profit
- $-21,614
- Equity at exit
- $20,860
- IRR
- 0.3%
- Equity multiple
- 1.03×
- Total profit
- $1,110
- Equity at exit
- $12,096
Cash invested: $39,172 (down + closing). Projections, not guarantees.
Landlord ↔ Tenant lean methodology
- Overall (STATE)
- 81 Strongly Landlord-Friendly
- State Missouri
- 81 Strongly Landlord-Friendly · R+10
- County
- — inherits STATE
- City
- — inherits STATE
ZIP-level market 63026
- Rents YoY
- 7.7%
- Active inventory
- 150
- Price-to-rent
- 10.1×
Monthly cashflow live
- Estimated rent
- $1,149 medium interval (Pro) →
- Mortgage (P&I)
- −$734
- Tax from tax record
- −$79 /mo · $949/yr
- Insurance
- −$58
- HOA
- −$110
- Vacancy / Maint / Mgmt
- −$241
- Net cashflow
- $-74
Break-even live
Sensitivity live
| Price | -10% $6 | -5% $-34 | +0% $-74 | +5% $-113 | +10% $-153 |
|---|---|---|---|---|---|
| Rent | -10% $-164 | -5% $-119 | +0% $-74 | +5% $-28 | +10% $17 |
| Rate | -1.0pp $-3 | -0.5pp $-38 | base $-74 | +0.5pp $-110 | +1.0pp $-147 |
UW: 25.0% down · 7.5% · 30yr · 1.5% tax · 5.0% vac · 8.0% maint · 8.0% mgmt
Financing live
Cash to close
- Down payment
- $34,975
- Closing costs
- $4,197
- Reserves months
- —
- Total cash needed
- —
Loan-product check · same deal, 3 products live
Conventional
25% down · 7.5% · 30yr
- Down + closing
- —
- Monthly P&I
- —
- Monthly cashflow
- —
- DSCR
- —
- Eligible?
- —
Personal DTI + credit; lowest rate.
DSCR
20% down · 8.5% · 30yr
- Down + closing
- —
- Monthly P&I
- —
- Monthly cashflow
- —
- DSCR
- —
- Eligible?
- —
No personal income docs; deal must DSCR.
Hard money
10% down · 12.0% · 12mo
- Down + closing
- —
- Monthly P&I
- —
- Monthly cashflow
- —
- DSCR
- —
- Eligible?
- —
Short-term bridge; refi at stabilization.
HOA detail
- Monthly dues
- $110 · $1,320/yr
Listing history 5 events
-
2026-05-15$145,000 Active 833-char remark
-
2019-04-05soldstatus $89,900
-
2009-09-09soldstatus
-
2005-07-21soldstatus
-
2001-12-27soldstatus $50,000
ⓘ Source: listings_history table (triggers on properties + properties_extension) + one-shot
backfill from property_details.listing_events for pre-trigger history.
Tax reassessment forecast MO · Resets to sale price
- Current annual tax
- $949 · $79/mo
- Projected year-2 tax
- $1,357 · $113/mo
- Expected delta
- +$408/yr (+$34/mo · 43.0%)
ⓘ Screening estimate from a state-policy table — verify with the county assessor before closing.
Climate risk First Street
- Flood 1/10 Low FEMA zone X (unshaded) · 0% chance over 30 yrs
- Wildfire 3/10 Moderate
- Heat 5/10 Major 7 d/yr ≥107°F today · 22 d/yr by 30 yrs out
- Wind 2/10 Low 100% chance of damaging wind over 30 yrs
- Air quality 2/10 Low 1 unhealthy d/yr today · 2 by 30 yrs out
Nearby sold comps map
Loading sold comps map…
Walkable amenities ~0.75 mi
Loading nearby amenities…
Taxation est. · year 1
- Rental income
- $13,784
- − Mortgage interest
- −$7,837
- − Property taxes
- −$949
- − Insurance
- −$700
- − Repairs & maintenance
- −$1,103
- − Management
- −$1,103
- − HOA
- −$1,320
- − Depreciation
- −$4,070
- Taxable loss
- −$3,296
- Est. tax savings @ 24.0%
- +$791
- After-tax cash flow
- $-92/yr
For passive investors: Depreciation is non-cash, so a rental often shows a tax loss while cash-flowing — sheltering income. Rental losses are passive: they offset passive income freely, and up to $25,000/yr can offset ordinary (W-2) income if you actively participate and your MAGI is under $100k (phasing out to $0 by $150k); unused losses carry forward. On sale, claimed depreciation is recaptured at up to 25%, and gains may owe capital-gains tax (a 1031 exchange can defer both). Figures are a year-1 estimate at your 24.0% rate — not tax advice; consult a CPA.
Schools (NCES district)
- District
- Fox C-6
- NCES district ID
- 2912300
- Math proficiency
- 35% ▼ -11.00%
- Reading proficiency
- 50% ▼ -4.00%
- Median HH income
- $60,849
- Composite
- 37.54/100
- National rank
- #4392
- State rank
- #103 of 324 in MO
Livability — Arnold
- Score
- 62/100
- State rank
- #396
- US rank
- #17082
Category grades
Schools grade is shown separately in the Schools card above.
Census & demographics
- County
- Jefferson County · 108,544 people
- Metro
- St. Louis, MO-IL
- Population (ZIP)
- 45,354
- Household income
- $97,553
- Rent vs Own
- Severe rent burden
- 513.0
Population outlook (Jefferson County) Hauer SSP2
- Today (2025)
- 235,088 people
- By 2030
- 238,365 · +1.4%
- By 2040
- 240,156 · +2.2%
- By 2050
- 234,651 · -0.2%
- By 2075
- 214,569 · -8.7%
- By 2100
- 179,697 · -23.6%
Race, ethnicity, and origin ACS 2023
- Neighborhood character
- Predominantly White (87%)
- Race & ethnicity
- White 87% Two or more races 8% Hispanic / Latino 3% Asian 2% Black 1%
- Common ancestry
- Romanian 4% Lithuanian 3% Slovak 1%
- Foreign-born
- 3% · Canada, China
- Languages at home
- 95% English-only · Spanish 1% Russian/Polish/Slavic 1% Other Indo-European 1%
Political lean MEDSL · Jefferson
- 2024 margin
- Solid R (+36.7) · D 31.0% · R 67.7% · Other 1.3%
- 2008→2024 swing
- -39.3pp toward R · 2008: 2.5pp · 2024: -36.7pp
- All cycles
- 2024: R+36.7 2020: R+33.9 2016: R+35.3 2012: R+12.7 2008: D+2.5
Not yet ingested
- Civics
- —
Market trends
- HPI YoY
- ▼ -300.59%
- Current HPI
- 211.8944
- Rent YoY
- ▲ 7.72%
- Metro
- St. Louis, MO-IL
- State GDP YoY
- ▲ 1.84%
- F500 in state
- 20
Industry mix (Fortune 500 HQ in MO)
| Industry | F500 HQs | Revenue |
|---|---|---|
| Healthcare | 1 | $163B |
|
||
| Insurance | 1 | $21B |
|
||
| Industrial Technology | 1 | $17B |
|
||
| Retail | 1 | $16B |
|
||
| Industrial Distribution | 1 | $10B |
|
||
| Utilities | 1 | $9B |
|
||
Price history
+179.8% since first listed7 events — show timeline
- 2026-05-29 Pending — MARIS as Distributed by MLS Grid
- 2026-05-27 Price Changed $139,900 MARIS as Distributed by MLS Grid
- 2026-05-15 Listed $145,000 MARIS as Distributed by MLS Grid
- 2019-04-05 Sold (Public Records) $89,900 Public Records
- 2009-09-09 Sold (Public Records) — Public Records
- 2005-07-21 Sold (Public Records) — Public Records
- 2001-12-27 Sold (Public Records) $50,000 Public Records
Property tax history
+2.8%/yrLatest (2025): $949 · +5.3% YoY. Source: county tax records.
Cash-flow waterfall
monthlySold comps — $/sqft
last 12 mo · ≤1 miLoading sold comps…