 🏷️ Likely Rental
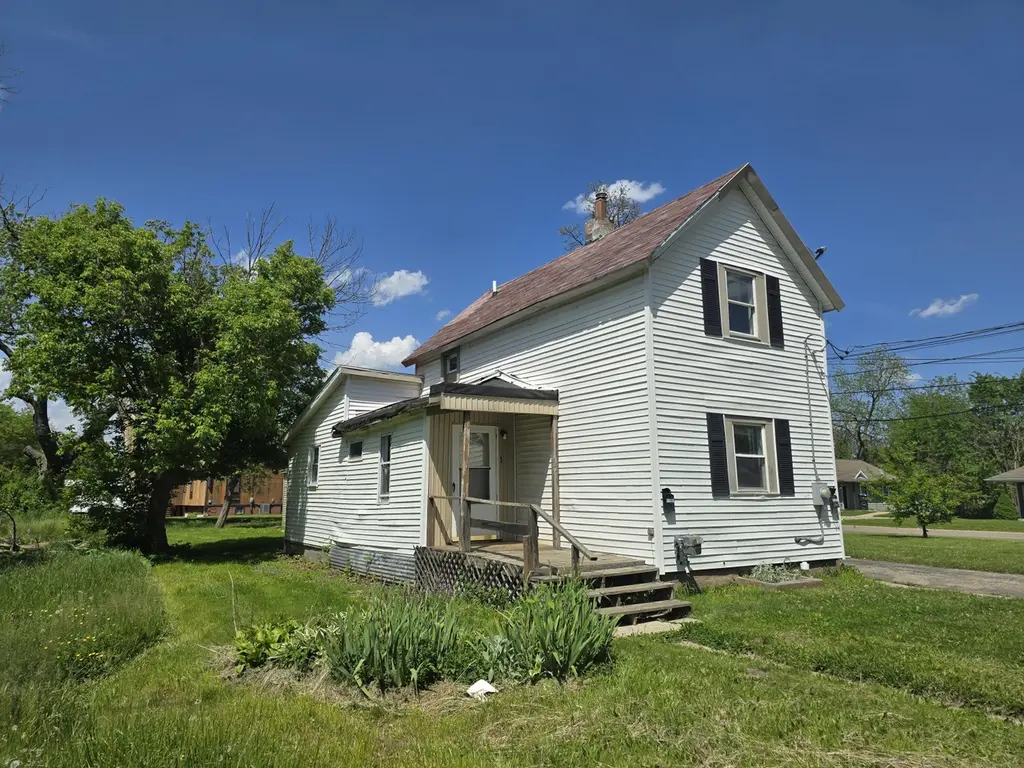
323 Ferry Ave · Pontiac, MI
Flood risk 1/10 · Minimal
- FEMA flood zone
- X (unshaded)
- Chance of flooding over 30 yrs
- 0.0%
- Est. flood insurance / yr
- $507 – $1,088
Fire risk 1/10 · Minimal
- Est. fire insurance / yr
- $784 – $1,456
Heat risk 2/10 · Minimal
- Hot days now (above 96°F)
- 7 days/yr
- Hot days in 30 yrs
- 15 days/yr
Wind risk 2/10 · Minimal
- Chance of severe wind over 30 yrs
- —
Air-quality risk 3/10 · Minor
- Unhealthy air days now
- 2 days/yr
- Unhealthy air days in 30 yrs
- 4 days/yr
Risk factors via First Street. Map © Google.
Why this score? — see what drove the B grade
The composite is a weighted blend of 9 inputs, each scored 0–100. Each bar is that input's sub-score; the figure is the points it added to the 100-point composite (weight × sub-score).
- Cash flow +30.0/30.0
- ARV discount +15.0/15.0
- 1% rule +10.0/10.0
- DSCR +10.0/10.0
- Livability +3.2/5.0
- Rent growth +2.5/5.0
- Condition / age +2.5/5.0
- Schools +1.0/10.0
- Appreciation +0.0/10.0
$100,000
🖨 Deal sheet 📄 Offer letter ✓ Due diligence
Listing remarks MLS
Investor Special - Value-Add Triplex Opportunity!Located at 323 Ferry Ave, Pontiac, MI 48341, this triplex features three 1-bedroom, 1-bath units, each previously rented at $750 per month, offering a projected gross income of $2,250/month when fully performing. This is a solid value-add opportunity for savvy investors. The property is being sold as-is, providing the flexibility to renovate, reposition, and maximize returns. Situated in Pontiac's growing rental market, this asset is ideal for investors seeking long-term cash flow or portfolio expansion. Land Contract available, making this an attractive option for buyers looking for flexible terms. Call for land contract details. Don't miss the chance to unlock the potential of this income-producing property.
Key facts
- Triplex opportunity
- 6,098 sq ft lot
- 6 parking spots
Tags
Neighborhood map
What this means for you Summary
Snapshot
- This is a 4-bed/3.0-bath single-family listed at $100k.
Deal economics
- At list price, monthly cash flow is $723 ($9k/yr) — positive.
- The deal already cash-flows at list — no discount required.
- Meets the 1% rule at list price ($2k rent vs $100k).
- Recommended offer: $88k (12.0% below list) — sets the bar for market timing.
- Cap rate 15.0% vs local median 6.7% in Pontiac — top-decile yield for the area; either an underpriced asset or a hidden risk that comps aren't pricing in. Stress-test before assuming the spread holds.
Location & tenants
- Location reads 64/100 on livability (#499 in MI) — a middle-class / working-renter tenant base. Strengths: commute A+, cost of living A+, housing A+; Watch: health & safety D, schools F, crime F.
- Pontiac City School District (urban): math 8% / reading 17% proficiency, ranked #514 of 540 in MI (top 95%) — low school quality limits family demand, transient renter base, plan for 1-2y turnover; 81% free/reduced lunch — lower-income household profile, screen leases tightly.
- Market conditions: 100 active listings in the ZIP; 5 comparable units currently listed for rent nearby; rentals lingering (median 44d on market — plan ~5-8 weeks vacancy on turnover, expect pricing pressure); 60% of comp listings sitting > 30 days — soft ceiling on asking rent; 2,614 units permitted in Oakland County in 2024 (721 in 5+ unit buildings).
- This rent runs 42% of the median local income ($51k/yr) — at the standard rent-burdened threshold; future hikes will face affordability resistance.
Forward outlook
- Local home prices are declining (-3.0%/yr); year-one equity from $691 of loan paydown is wiped out by about $3k of value loss. Plan a longer hold.
- Oakland County population projected at +10% by 2050 — modest demand growth; plan on rents tracking national, not racing it.
- At projected returns (-3.0% appreciation + 3.0% rent growth), your $28k cash investment doubles in ~4 years — after that, you're playing with house money.
Negotiation context
- It's been on market 154 days — a 12% lower offer ($88k) is reasonable based on typical stale-listing flexibility.
- 8 sale attempts since 4y ago; this cycle's ask has dropped $10k (9%) from the opening price — seller is motivated, your offer sets the floor, not the list.
Risks & watch-outs
- Watch-outs: built in 1910 — expect roof / HVAC / electrical / plumbing capex.
Questions for the listing agent
- It's been on market 154 days. Have you received any prior offers? Is the seller open to a 12% concession, seller financing, or rate buy-down credit?
- Built in 1910 — when were the roof, HVAC, electrical panel, plumbing, and water heater last replaced?
- Why hasn't it sold? Are there any deal-killer items the seller is aware of (foundation, flood, title, zoning, code violations)?
- Is there a deadline driving the sale (1031 exchange, divorce, estate, relocation)? That informs how much negotiation room exists.
- Schools are F-rated, which usually means shorter tenancies and higher turnover. Who's the typical renter profile here, and what's been the actual vacancy rate?
- Crime grade is F in this area — have there been break-ins, vandalism, or insurance claims at this property in the last 3 years? What carrier currently insures it and at what premium?
- What's the average days-on-market for RENTAL listings here right now (not sales)? A rising rental-DOM trend means longer vacancies and softer asking-rent achievability than the comps imply.
- What's the recent tenant-quality profile in this submarket — average credit score on applications, eviction rate, late-payment / NSF rate, and stable-employment percentage? A property-management company in the area should have these aggregated.
- How much new for-sale + rental construction is in the pipeline within 1–3 miles? Heavy new supply typically softens prices + rents 12–24 months out; constrained supply supports both.
Investment metrics
- 1% rule
- 1.79% ✓
- Cap rate
- 14.97%
- Cash-on-cash
- 30.99%
- DSCR
- 2.38
- GRM
- 4.7
CMA / ARV
- ARV (median comp)
- $132,360
- List price
- $100,000
- Delta
- -24.45%
- Verdict
- UNDERPRICED
- Comps
- 5 within 1.0 mi
Show comp detail 12 sales within ~0.75 mi
| Address | Dist | Beds/Ba | Sqft | Sold | Price | $/sf | Match |
|---|---|---|---|---|---|---|---|
| 443 South Blvd E | 0.30mi | 3/1.0 (-1) | 1,609 (+6%) | 10mo | $83,500 | $52 | 55 |
| 465 S Marshall St | 0.38mi | 3/2.0 (-1) | 1,368 (-10%) | 6mo | $133,000 | $97 | 52 |
| 159 Alice Ave | 0.69mi | 3/1.5 (-1) | 1,526 (+1%) | 8mo | $305,000 | $200 | 49 |
| 200 Prospect St | 0.29mi | 3/1.0 (-1) | 1,350 (-11%) | 9mo | $63,000 | $47 | 48 |
| 205 Hughes Ave | 0.73mi | 4/1.5 | 1,426 (-6%) | 5mo | $100,000 | $70 | 46 |
| 438 Franklin Rd | 0.74mi | 3/1.0 (-1) | 1,444 (-5%) | 1mo | $160,000 | $111 | 44 |
| 135 Osmun St | 0.57mi | 3/2.5 (-1) | 1,368 (-10%) | 10mo | $210,000 | $154 | 42 |
| 256 Cedardale Ave | 0.56mi | 3/1.0 (-1) | 1,348 (-11%) | 1mo | $100,000 | $74 | 41 |
| 499 Bloomfield Ave | 0.62mi | 3/2.5 (-1) | 1,669 (+10%) | 8mo | $225,000 | $135 | 40 |
| 518 Howland Ave | 0.63mi | 5/2.5 (+1) | 1,298 (-14%) | 3mo | $80,000 | $62 | 37 |
| 494 Bloomfield Ave | 0.65mi | 3/2.5 (-1) | 1,659 (+10%) | 12mo | $248,000 | $149 | 37 |
| 289 Nebraska Ave | 0.53mi | 3/1.0 (-1) | 1,712 (+13%) | 11mo | $123,600 | $72 | 31 |
Match score weights: distance 35% · size 25% · config 20% · recency 20%. Top-matched comps best support the ARV.
Projected returns pro-forma
-3.0% appreciation · 3.0% rent growth · sell at horizon
- IRR
- 25.8%
- Equity multiple
- 2.07×
- Total profit
- $29,871
- Equity at exit
- $14,910
- IRR
- 33.5%
- Equity multiple
- 4.05×
- Total profit
- $85,411
- Equity at exit
- $8,646
Cash invested: $28,000 (down + closing). Projections, not guarantees.
Landlord ↔ Tenant lean methodology
- Overall (STATE)
- 62 Landlord-Friendly
- State Michigan
- 62 Landlord-Friendly · EVEN
- County
- — inherits STATE
- City
- — inherits STATE
ZIP-level market 48341
- Active inventory
- 100
- Price-to-rent
- 4.7×
Monthly cashflow live
- Estimated rent
- $1,787 high interval (Pro) →
- Mortgage (P&I)
- −$524
- Tax from tax record
- −$123 /mo · $1,472/yr
- Insurance
- −$42
- HOA
- −$0
- Vacancy / Maint / Mgmt
- −$375
- Net cashflow
- $723
Break-even live
UW: 25.0% down · 7.5% · 30yr · 1.5% tax · 5.0% vac · 8.0% maint · 8.0% mgmt
Financing live
Cash to close
- Down payment
- $25,000
- Closing costs
- $3,000
- Reserves months
- —
- Total cash needed
- —
Loan-product check · same deal, 3 products live
Conventional
25% down · 7.5% · 30yr
- Down + closing
- —
- Monthly P&I
- —
- Monthly cashflow
- —
- DSCR
- —
- Eligible?
- —
Personal DTI + credit; lowest rate.
DSCR
20% down · 8.5% · 30yr
- Down + closing
- —
- Monthly P&I
- —
- Monthly cashflow
- —
- DSCR
- —
- Eligible?
- —
No personal income docs; deal must DSCR.
Hard money
10% down · 12.0% · 12mo
- Down + closing
- —
- Monthly P&I
- —
- Monthly cashflow
- —
- DSCR
- —
- Eligible?
- —
Short-term bridge; refi at stabilization.
Rent comps 5 comps
| Address | Beds | Baths | Sqft | Rent | $/sqft | DOM | Units | Dist |
|---|---|---|---|---|---|---|---|---|
| 124 Alice Ave Bloomfield Township, MI | 3.0 | 1.0 | 1440 | $2,000 | $1.39 | 5d | 1 | 0.75mi |
| 128 S Edith St Pontiac, MI | 2.0–3.0 | 2.0 | 1155 | $1,700 | $1.47 | 17d | 1 | 0.79mi |
| 611 Montana Ave Pontiac, MI | 3.0 | 1.0 | 1112 | $1,350 | $1.21 | 43d | 1 | 0.99mi |
| 38 N Shirley St Pontiac, MI | 3.0 | 1.0 | 1174 | $1,425 | $1.21 | 43d | 1 | 1.11mi |
| 107 N Sanford St Pontiac, MI | 4.0 | 1.5 | 1467 | $1,750 | $1.19 | 43d | 1 | 1.24mi |
Listing history 41 events
-
2026-06-18days on market $100,000 Active 154 DOM
-
2026-06-17days on market $100,000 Active 153 DOM
-
2026-06-16days on market $100,000 Active 152 DOM
-
2026-06-15days on market $100,000 Active 151 DOM
-
2026-06-13days on market $100,000 Active 149 DOM
-
2026-06-13days on market $100,000 Active 148 DOM
-
2026-06-09days on market $100,000 Active 145 DOM
-
2026-06-08days on market $100,000 Active 144 DOM
-
2026-06-07days on market $100,000 Active 143 DOM
-
2026-06-04days on market $100,000 Active 140 DOM
-
2026-06-03days on market $100,000 Active 139 DOM
-
2026-06-02days on market $100,000 Active 138 DOM
-
2026-06-01days on market $100,000 Active 137 DOM
-
2026-05-31days on market $100,000 Active 136 DOM
-
2026-04-15price $100,000 768-char remark
Show marketing remark (768 chars)
Investor Special - Value-Add Triplex Opportunity!Located at 323 Ferry Ave, Pontiac, MI 48341, this triplex features three 1-bedroom, 1-bath units, each previously rented at $750 per month, offering a projected gross income of $2,250/month when fully performing. This is a solid value-add opportunity for savvy investors. The property is being sold as-is, providing the flexibility to renovate, reposition, and maximize returns. Situated in Pontiac's growing rental market, this asset is ideal for investors seeking long-term cash flow or portfolio expansion. Land Contract available, making this an attractive option for buyers looking for flexible terms. Call for land contract details. Don't miss the chance to unlock the potential of this income-producing property.
-
2026-04-14price $100,000 768-char remark
Show marketing remark (768 chars)
Investor Special - Value-Add Triplex Opportunity!Located at 323 Ferry Ave, Pontiac, MI 48341, this triplex features three 1-bedroom, 1-bath units, each previously rented at $750 per month, offering a projected gross income of $2,250/month when fully performing. This is a solid value-add opportunity for savvy investors. The property is being sold as-is, providing the flexibility to renovate, reposition, and maximize returns. Situated in Pontiac's growing rental market, this asset is ideal for investors seeking long-term cash flow or portfolio expansion. Land Contract available, making this an attractive option for buyers looking for flexible terms. Call for land contract details. Don't miss the chance to unlock the potential of this income-producing property.
-
2026-01-16$110,000 Active 768-char remark
Show marketing remark (768 chars)
Investor Special - Value-Add Triplex Opportunity!Located at 323 Ferry Ave, Pontiac, MI 48341, this triplex features three 1-bedroom, 1-bath units, each previously rented at $750 per month, offering a projected gross income of $2,250/month when fully performing. This is a solid value-add opportunity for savvy investors. The property is being sold as-is, providing the flexibility to renovate, reposition, and maximize returns. Situated in Pontiac's growing rental market, this asset is ideal for investors seeking long-term cash flow or portfolio expansion. Land Contract available, making this an attractive option for buyers looking for flexible terms. Call for land contract details. Don't miss the chance to unlock the potential of this income-producing property.
-
2026-01-15$110,000 Active 768-char remark
Show marketing remark (768 chars)
Investor Special - Value-Add Triplex Opportunity!Located at 323 Ferry Ave, Pontiac, MI 48341, this triplex features three 1-bedroom, 1-bath units, each previously rented at $750 per month, offering a projected gross income of $2,250/month when fully performing. This is a solid value-add opportunity for savvy investors. The property is being sold as-is, providing the flexibility to renovate, reposition, and maximize returns. Situated in Pontiac's growing rental market, this asset is ideal for investors seeking long-term cash flow or portfolio expansion. Land Contract available, making this an attractive option for buyers looking for flexible terms. Call for land contract details. Don't miss the chance to unlock the potential of this income-producing property.
-
2025-12-30historical
-
2025-12-29historical
-
2025-03-25$110,000 Active
-
2025-03-25$110,000 Active
-
2025-01-08historical
-
2025-01-08historical
-
2024-12-12price $125,000
-
2024-12-12price $125,000
-
2024-08-30price $145,000
-
2024-08-30price $145,000
-
2024-08-30price $145,000
-
2024-07-16price $150,000
-
2024-07-15price $150,000
-
2024-07-15price $150,000
-
2024-04-02$155,000 Active
-
2024-04-02$155,000 Active
-
2022-08-05soldstatus $120,000
-
2022-08-01soldstatus $120,000 Sold
-
2022-08-01soldstatus $120,000 Closed
-
2022-07-15historical
-
2022-07-15$120,000
-
2022-07-15historical
-
2022-07-15$120,000
ⓘ Source: listings_history table (triggers on properties + properties_extension) + one-shot
backfill from property_details.listing_events for pre-trigger history.
Tax reassessment forecast MI · Partial reset (capped growth)
- Current annual tax
- $1,472 · $123/mo
- Projected year-2 tax
- $1,506 · $126/mo
- Expected delta
- +$34/yr (+$3/mo · 2.3%)
ⓘ Screening estimate from a state-policy table — verify with the county assessor before closing.
Climate risk First Street
- Flood 1/10 Low FEMA zone X (unshaded) · 0% chance over 30 yrs
- Wildfire 1/10 Low
- Heat 2/10 Low 7 d/yr ≥96°F today · 15 d/yr by 30 yrs out
- Wind 2/10 Low
- Air quality 3/10 Moderate 2 unhealthy d/yr today · 4 by 30 yrs out
Nearby sold comps map
Loading sold comps map…
Walkable amenities ~0.75 mi
Loading nearby amenities…
Taxation est. · year 1
- Rental income
- $21,445
- − Mortgage interest
- −$5,602
- − Property taxes
- −$1,472
- − Insurance
- −$500
- − Repairs & maintenance
- −$1,716
- − Management
- −$1,716
- − Depreciation
- −$2,909
- Taxable income
- $7,531
- Est. tax owed @ 24.0%
- −$1,807
- After-tax cash flow
- $6,869/yr
For passive investors: Depreciation is non-cash, so a rental often shows a tax loss while cash-flowing — sheltering income. Rental losses are passive: they offset passive income freely, and up to $25,000/yr can offset ordinary (W-2) income if you actively participate and your MAGI is under $100k (phasing out to $0 by $150k); unused losses carry forward. On sale, claimed depreciation is recaptured at up to 25%, and gains may owe capital-gains tax (a 1031 exchange can defer both). Figures are a year-1 estimate at your 24.0% rate — not tax advice; consult a CPA.
Schools (NCES district)
- District
- Pontiac City School District
- NCES district ID
- 2628740
- Math proficiency
- 8% ▼ -5.00%
- Reading proficiency
- 17% ▼ -3.00%
- Median HH income
- $33,888
- Composite
- 10.12/100
- National rank
- #9802
- State rank
- #514 of 540 in MI
Livability — Pontiac
- Score
- 64/100
- State rank
- #499
- US rank
- #14703
Category grades
Schools grade is shown separately in the Schools card above.
Census & demographics
- Census place
- Pontiac, MI
- County
- Oakland County · 1,009,092 people
- City population
- 44,593
- Metro
- Detroit-Warren-Dearborn, MI
- Population (ZIP)
- 18,924
- Household income
- $51,390
- Rent vs Own
- Severe rent burden
- 833.0
Population outlook (Oakland County) Hauer SSP2
- Today (2025)
- 1,335,747 people
- By 2030
- 1,375,100 · +2.9%
- By 2040
- 1,435,385 · +7.5%
- By 2050
- 1,469,250 · +10.0%
- By 2075
- 1,531,946 · +14.7%
- By 2100
- 1,450,485 · +8.6%
Race, ethnicity, and origin ACS 2023
- Neighborhood character
- Diverse neighborhood (Simpson 0.61)
- Race & ethnicity
- Black 57% White 22% Hispanic / Latino 12% Two or more races 11% Asian 3%
- Hispanic origin (detail)
- Mexican 4% Puerto Rican 2%
- Common ancestry
- Slovak 2% Romanian 1% Swiss 1%
- Foreign-born
- 10% · Canada
- Languages at home
- 86% English-only · Spanish 9% Other Indo-European 1% Other Asian/Pacific 1%
Political lean MEDSL · Oakland
- 2024 margin
- D (+10.6) · D 54.4% · R 43.8% · Other 1.9%
- 2008→2024 swing
- -3.9pp toward R · 2008: 14.5pp · 2024: 10.6pp
- All cycles
- 2024: D+10.6 2020: D+14.1 2016: D+8.1 2012: D+8.1 2008: D+14.5
Not yet ingested
- Civics
- —
Market trends
- HPI YoY
- ▼ -204.11%
- Current HPI
- 257.8941
- Rent YoY
- —
- Metro
- Detroit-Warren-Dearborn, MI
- State GDP YoY
- ▲ 1.37%
- F500 in state
- 28
Industry mix (Fortune 500 HQ in MI)
| Industry | F500 HQs | Revenue |
|---|---|---|
| Automotive Parts | 3 | $48B |
|
||
| Automotive | 2 | $372B |
|
||
| Chemicals | 1 | $45B |
|
||
| Automotive Retail | 1 | $29B |
|
||
| Healthcare / Medical Devices | 1 | $23B |
|
||
| Automotive Technology | 1 | $20B |
|
||
Price history
-16.7% since first listed27 events — show timeline
- 2026-04-15 Price Changed $100,000 MiRealSource-MiMLS
- 2026-04-14 Price Changed $100,000 REALCOMP
- 2026-01-16 Listed $110,000 REALCOMP
- 2026-01-15 Listed $110,000 MiRealSource-MiMLS
- 2025-12-30 Listing Removed — MiRealSource-MiMLS
- 2025-12-29 Listing Removed — REALCOMP
- 2025-03-25 Listed $110,000 REALCOMP
- 2025-03-25 Listed $110,000 MiRealSource-MiMLS
- 2025-01-08 Listing Removed — REALCOMP
- 2025-01-08 Listing Removed — MiRealSource-MiMLS
- 2024-12-12 Price Changed $125,000 MiRealSource-MiMLS
- 2024-12-12 Price Changed $125,000 REALCOMP
- 2024-08-30 Price Changed $145,000 MiRealSource-MiMLS
- 2024-08-30 Price Changed $145,000 REALCOMP
- 2024-08-30 Price Changed $145,000 SW Michigan MLS
- 2024-07-16 Price Changed $150,000 MiRealSource-MiMLS
- 2024-07-15 Price Changed $150,000 REALCOMP
- 2024-07-15 Price Changed $150,000 SW Michigan MLS
- 2024-04-02 Listed $155,000 MiRealSource-MiMLS
- 2024-04-02 Listed $155,000 REALCOMP
- 2022-08-05 Sold (Public Records) $120,000 Public Records
- 2022-08-01 Sold (MLS) $120,000 MiRealSource-MiMLS
- 2022-08-01 Sold (MLS) $120,000 REALCOMP
- 2022-07-15 Listed $120,000 MiRealSource-MiMLS
- 2022-07-15 Listing Removed — MiRealSource-MiMLS
- 2022-07-15 Listed $120,000 REALCOMP
- 2022-07-15 Listing Removed — REALCOMP
Property tax history
+7.0%/yrLatest (2025): $1,472 · -12.7% YoY. Source: county tax records.
Cash-flow waterfall
monthlySold comps — $/sqft
last 12 mo · ≤1 miLoading sold comps…