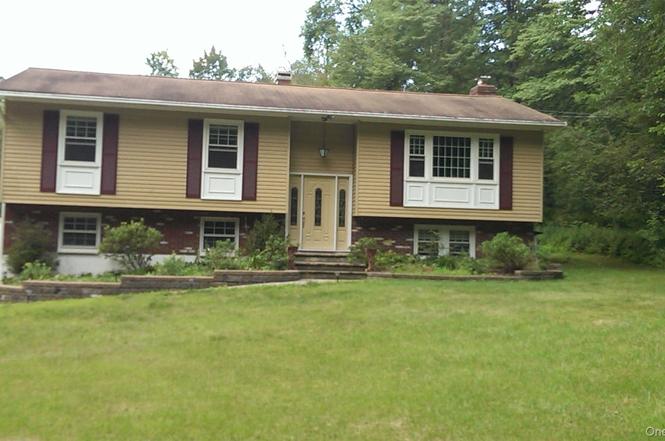
222 Highview Rd · Dover Plains, NY
Flood risk 1/10 · Minimal
- FEMA flood zone
- X (unshaded)
- Chance of flooding over 30 yrs
- 0.0%
- Est. flood insurance / yr
- $473 – $860
Fire risk 5/10 · Moderate
- Est. fire insurance / yr
- $691 – $1,283
Heat risk 3/10 · Minor
- Hot days now (above 96°F)
- 7 days/yr
- Hot days in 30 yrs
- 15 days/yr
Wind risk 4/10 · Minor
- Chance of severe wind over 30 yrs
- 12.0%
Air-quality risk 3/10 · Minor
- Unhealthy air days now
- 2 days/yr
- Unhealthy air days in 30 yrs
- 3 days/yr
Risk factors via First Street. Map © Google.
Why this score? — see what drove the C+ grade
The composite is a weighted blend of 9 inputs, each scored 0–100. Each bar is that input's sub-score; the figure is the points it added to the 100-point composite (weight × sub-score).
- Cash flow +19.1/30.0
- ARV discount +11.0/15.0
- Appreciation +10.0/10.0
- DSCR +6.0/10.0
- 1% rule +5.0/10.0
- Schools +4.0/10.0
- Livability +3.2/5.0
- Rent growth +2.5/5.0
- Condition / age +2.5/5.0
$495,000
🖨 Deal sheet (PDF) 📄 Offer letter ✓ Due diligence
Listing remarks
Escape the noise and congestion of everyday life and come home to space, privacy, and country-living, without giving up convenience. Located just 6 miles from the train and minutes to everyday amenities, this completely remodeled bi-level offers the perfect balance. Set on over 3 acres of beautiful, level and private property, the home has been thoughtfully updated and is truly move-in ready. Hardwood floors run throughout, and the stunning Quartz kitchen with stainless steel appliances showcases a clean, striking space that feels both stylish and practical. Two newly renovated bathrooms feature contemporary finishes and quality craftsmanship. A bright sunroom with walls of windows brings t
Key facts
- 3.11 acre lot
- 3 garage spots
- Built 1979
Neighborhood map
What this means for you Summary
Snapshot
- This is a 3-bed/2.5-bath single-family listed at $495k.
Deal economics
- At list price, monthly cash flow is $528 ($6k/yr) — positive.
- The deal already cash-flows at list — no discount required.
- To meet the 1% rule (rent ≥ 1% of price), the offer needs to be $495k (0.1% below list).
- Recommended offer: $488k (1.5% below list) — sets the bar for market timing.
Location & tenants
- Location reads 63/100 on livability (#818 in NY) — a middle-class / working-renter tenant base. Strengths: crime A, cost of living B; Watch: commute C-, housing D+, amenities F.
- Dover Union Free School District (rural): math 44% / reading 48% proficiency, ranked #433 of 590 in NY (top 73%) — families likely to look elsewhere, expect single-tenant / working-renter base with shorter leases.
- Zoned schools: Dover Elementary School (math 33% / reading 44%, grade F, #1,509 of 2,108 statewide, top 72%, 296 students, 71% FRL); Dover Middle School (math 32% / reading 47%, grade F, #418 of 729 statewide, top 59%, 301 students, 68% FRL); Dover High School (math 92% / reading 74%, grade A, #435 of 1,100 statewide, top 40%, 467 students, 59% FRL) — zoned schools average 66% FRL vs 38% district-wide (29 pts higher); higher-poverty schools than district average — tighter screening recommended.
- Market conditions: 38 active listings in the ZIP; 620 units permitted in Dutchess County in 2024 (242 in 5+ unit buildings).
Forward outlook
- In year one you build about $53k of equity ($3k loan paydown + $50k appreciation (10.0% local appreciation)).
- Dutchess County population projected at -11% by 2050 — secular population decline; favor cash flow + early exit over multi-decade hold.
- At projected returns (10.0% appreciation + 3.0% rent growth), your $139k cash investment doubles in ~3 years — after that, you're playing with house money.
- By year 2, paydown + projected appreciation supports a ~$85k cash-out refi (75% LTV) — recoverable capital for the next deal without selling this one.
Negotiation context
- It's been on market 22 days — a 2% lower offer ($488k) is reasonable based on typical stale-listing flexibility.
- 2 sale attempts since 13y ago with the ask held roughly flat each time — persistent listings suggest the price (not the market) is what's stuck; bring a comps-based counter.
- Current owner paid $230k; list at $495k implies a 115% gain — meaningful room to come down on a strong offer.
Risks & watch-outs
- Climate carrying-cost: moderate wildfire risk — expect insurance premiums to compound above CPI over the hold.
Questions for the listing agent
- Built in 1979 — when were the roof, HVAC, electrical panel, plumbing, and water heater last replaced?
- Is there a deadline driving the sale (1031 exchange, divorce, estate, relocation)? That informs how much negotiation room exists.
- What's the average days-on-market for RENTAL listings here right now (not sales)? A rising rental-DOM trend means longer vacancies and softer asking-rent achievability than the comps imply.
- What's the recent tenant-quality profile in this submarket — average credit score on applications, eviction rate, late-payment / NSF rate, and stable-employment percentage? A property-management company in the area should have these aggregated.
- How much new for-sale + rental construction is in the pipeline within 1–3 miles? Heavy new supply typically softens prices + rents 12–24 months out; constrained supply supports both.
Investment metrics
- 1% rule
- 1.00% ✗
- Cap rate
- 7.57%
- Cash-on-cash
- 4.57%
- DSCR
- 1.20
- GRM
- 8.3
CMA / ARV
- ARV (on-the-fly)
- $536,504
- Comps found
- 3
Show comp detail 3 sales within ~0.75 mi
| Address | Dist | Beds/Ba | Sqft | Sold | Price | $/sf | Match |
|---|---|---|---|---|---|---|---|
| 222 Highview Rd | 0.00mi | 3/2.0 | 1,592 (0%) | 1mo | $503,500 | $316 | 97 |
| 476 Chestnut Ridge Rd | 0.63mi | 3/2.0 | 1,540 (-3%) | 12mo | $519,000 | $337 | 53 |
| 461 Chestnut Ridge Rd | 0.63mi | 3/2.0 | 1,556 (-2%) | 15mo | $600,000 | $386 | 52 |
Match score weights: distance 35% · size 25% · config 20% · recency 20%. Top-matched comps best support the ARV.
Projected returns pro-forma
10.0% appreciation · 3.0% rent growth · sell at horizon
- IRR
- 27.6%
- Equity multiple
- 3.19×
- Total profit
- $303,282
- Equity at exit
- $445,935
- IRR
- 24.1%
- Equity multiple
- 7.25×
- Total profit
- $866,756
- Equity at exit
- $961,676
Cash invested: $138,600 (down + closing). Projections, not guarantees.
Landlord ↔ Tenant lean methodology
- Overall (STATE)
- 15 Strongly Tenant-Friendly
- State New York
- 15 Strongly Tenant-Friendly · D+10
- County
- — inherits STATE
- City
- — inherits STATE
ZIP-level market 12522
- Home prices YoY
- 17.7%
- Active inventory
- 38
- Price-to-rent
- 8.3×
Monthly cashflow live
- Estimated rent
- $4,945 medium interval (Pro) →
- Mortgage (P&I)
- −$2,596
- Tax from tax record
- −$576 /mo · $6,917/yr
- Insurance
- −$206
- HOA
- −$0
- Vacancy / Maint / Mgmt
- −$1,039
- Net cashflow
- $528
Break-even live
Sensitivity live
| Price | -10% $808 | -5% $668 | +0% $528 | +5% $388 | +10% $248 |
|---|---|---|---|---|---|
| Rent | -10% $138 | -5% $333 | +0% $528 | +5% $724 | +10% $919 |
| Rate | -1.0pp $778 | -0.5pp $654 | base $528 | +0.5pp $400 | +1.0pp $269 |
UW: 25.0% down · 7.5% · 30yr · 1.5% tax · 5.0% vac · 8.0% maint · 8.0% mgmt
Financing live
Cash to close
- Down payment
- $123,750
- Closing costs
- $14,850
- Reserves months
- —
- Total cash needed
- —
Loan-product check · same deal, 3 products live
Conventional
25% down · 7.5% · 30yr
- Down + closing
- —
- Monthly P&I
- —
- Monthly cashflow
- —
- DSCR
- —
- Eligible?
- —
Personal DTI + credit; lowest rate.
DSCR
20% down · 8.5% · 30yr
- Down + closing
- —
- Monthly P&I
- —
- Monthly cashflow
- —
- DSCR
- —
- Eligible?
- —
No personal income docs; deal must DSCR.
Hard money
10% down · 12.0% · 12mo
- Down + closing
- —
- Monthly P&I
- —
- Monthly cashflow
- —
- DSCR
- —
- Eligible?
- —
Short-term bridge; refi at stabilization.
Listing history 5 events
-
2026-03-27status Pending
-
2026-02-27$495,000 Active
-
2026-02-13historical $495,000
-
2013-09-07soldstatus $230,000
-
2013-03-05$239,000
ⓘ Source: listings_history table (triggers on properties + properties_extension) + one-shot
backfill from property_details.listing_events for pre-trigger history.
Tax reassessment forecast NY · Partial reset (capped growth)
- Current annual tax
- $6,917 · $576/mo
- Projected year-2 tax
- $7,641 · $637/mo
- Expected delta
- +$724/yr (+$60/mo · 10.5%)
ⓘ Screening estimate from a state-policy table — verify with the county assessor before closing.
Climate risk First Street
- Flood 1/10 Low FEMA zone X (unshaded) · 0% chance over 30 yrs
- Wildfire 5/10 Major
- Heat 3/10 Moderate 7 d/yr ≥96°F today · 15 d/yr by 30 yrs out
- Wind 4/10 Moderate 12% chance of damaging wind over 30 yrs
- Air quality 3/10 Moderate 2 unhealthy d/yr today · 3 by 30 yrs out
Nearby sold comps map
Loading sold comps map…
Walkable amenities ~0.75 mi
Loading nearby amenities…
Taxation est. · year 1
- Rental income
- $59,343
- − Mortgage interest
- −$27,728
- − Property taxes
- −$6,917
- − Insurance
- −$2,475
- − Repairs & maintenance
- −$4,747
- − Management
- −$4,747
- − Depreciation
- −$14,400
- Taxable loss
- −$1,672
- Est. tax savings @ 24.0%
- +$401
- After-tax cash flow
- $6,740/yr
For passive investors: Depreciation is non-cash, so a rental often shows a tax loss while cash-flowing — sheltering income. Rental losses are passive: they offset passive income freely, and up to $25,000/yr can offset ordinary (W-2) income if you actively participate and your MAGI is under $100k (phasing out to $0 by $150k); unused losses carry forward. On sale, claimed depreciation is recaptured at up to 25%, and gains may owe capital-gains tax (a 1031 exchange can defer both). Figures are a year-1 estimate at your 24.0% rate — not tax advice; consult a CPA.
Schools (NCES district)
- District
- Dover Union Free School District
- NCES district ID
- 3609210
- Math proficiency
- 44% ▼ -8.00%
- Reading proficiency
- 48% ▲ 3.00%
- Median HH income
- $58,267
- Composite
- 40.25/100
- National rank
- #3768
- State rank
- #433 of 590 in NY
Livability — Dover Plains
- Score
- 63/100
- State rank
- #818
- US rank
- #15806
Category grades
Schools grade is shown separately in the Schools card above.
Census & demographics
- Population (ZIP)
- 5,074
Population outlook (Dutchess County) Hauer SSP2
- Today (2025)
- 291,768 people
- By 2030
- 287,131 · -1.6%
- By 2040
- 274,881 · -5.8%
- By 2050
- 259,971 · -10.9%
- By 2075
- 235,366 · -19.3%
- By 2100
- 208,786 · -28.4%
Race, ethnicity, and origin ACS 2023
- Neighborhood character
- Predominantly White (76%)
- Race & ethnicity
- White 76% Hispanic / Latino 14% Two or more races 10% Asian 2% Black 1%
- Hispanic origin (detail)
- Puerto Rican 5% Cuban 2%
- Common ancestry
- Lithuanian 3% Scandinavian 2% Slovak 2%
- Foreign-born
- 12% · Canada, China
- Languages at home
- 85% English-only · Spanish 6% Other Indo-European 4% Chinese 2%
Political lean MEDSL · Dutchess
- 2024 margin
- Lean D (+5.4) · D 52.7% · R 47.3%
- 2008→2024 swing
- -3.2pp toward R · 2008: 8.6pp · 2024: 5.4pp
- All cycles
- 2024: D+5.4 2020: D+9.6 2016: R+1.1 2012: D+6.6 2008: D+8.6
Not yet ingested
- Civics
- —
Market trends
- HPI YoY
- ▲ 39.50%
- Current HPI
- 262.8121
- Rent YoY
- —
- Metro
- —
- State GDP YoY
- ▲ 2.60%
- F500 in state
- 92
Industry mix (Fortune 500 HQ in NY)
| Industry | F500 HQs | Revenue |
|---|---|---|
| Financial Services | 10 | $950B |
|
||
| Consumer Goods | 9 | $162B |
|
||
| Insurance | 4 | $225B |
|
||
| Telecommunications | 2 | $144B |
|
||
| Pharmaceuticals | 2 | $112B |
|
||
| Media / Entertainment | 2 | $69B |
|
||
Price history
+107.1% since first listed5 events — show timeline
- 2026-03-27 Pending — OneKey® MLS as Distributed by MLS Grid
- 2026-02-27 Listed $495,000 OneKey® MLS as Distributed by MLS Grid
- 2026-02-13 Coming Soon $495,000 OneKey® MLS as Distributed by MLS Grid
- 2013-09-07 Sold (Public Records) $230,000 Public Records
- 2013-03-05 Listed $239,000 OneKey® MLS as Distributed by MLS Grid
Property tax history
-0.4%/yrLatest (2025): $6,917 · +2.2% YoY. Source: county tax records.
Cash-flow waterfall
monthlySold comps — $/sqft
last 12 mo · ≤1 miLoading sold comps…