None · Frederick, OK
Flood risk 1/10 · Minimal
- FEMA flood zone
- —
- Chance of flooding over 30 yrs
- 0.0%
- Est. flood insurance / yr
- —
Fire risk 3/10 · Minor
- Est. fire insurance / yr
- $2,463 – $4,575
Heat risk 7/10 · Major
- Hot days now (above 109°F)
- 7 days/yr
- Hot days in 30 yrs
- 19 days/yr
Wind risk 3/10 · Minor
- Chance of severe wind over 30 yrs
- 6.0%
Air-quality risk 1/10 · Minimal
- Unhealthy air days now
- 0 days/yr
- Unhealthy air days in 30 yrs
- 0 days/yr
Risk factors via First Street. Map © Google.
Why this score? — see what drove the D- grade
The composite is a weighted blend of 9 inputs, each scored 0–100. Each bar is that input's sub-score; the figure is the points it added to the 100-point composite (weight × sub-score).
- Cash flow +13.7/30.0
- DSCR +4.1/10.0
- Appreciation +3.3/10.0
- Livability +3.1/5.0
- Schools +2.9/10.0
- ARV discount +2.6/15.0
- 1% rule +2.5/10.0
- Rent growth +2.5/5.0
- Condition / age +2.5/5.0
$160,000
🖨 Deal sheet (PDF) 📄 Offer letter ✓ Due diligence
Listing remarks
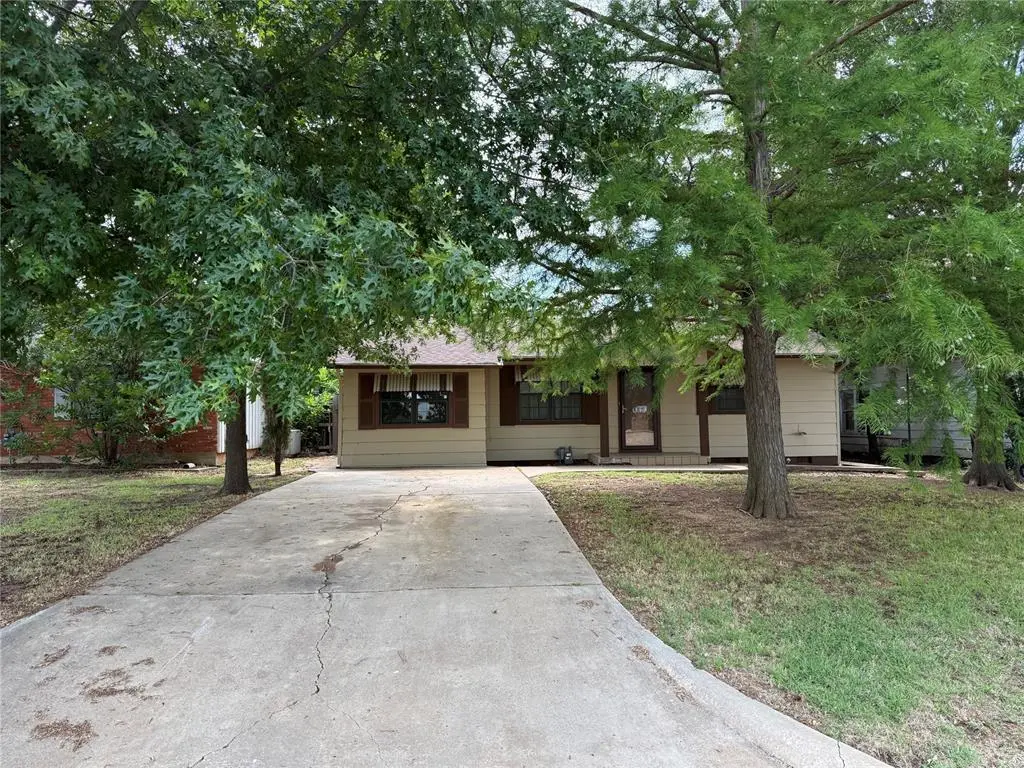
Discover a lifestyle of comfort and convenience at 1320 N 12th ST, Frederick OK 73542. Built in 1965, this single-family residence offers a unique opportunity to own a piece of Frederick's charm, meticulously maintained for its next chapter. The residence features three thoughtfully designed bedrooms, each providing a private retreat for relaxation and personal space. Beyond the living quarters, a generous three-car garage provides ample space for vehicles, storage, or even a dedicated workshop, catering to a variety of needs and hobbies. This property presents an exceptional opportunity to embrace a vibrant lifestyle in Frederick.
Key facts
- 7,000 sq ft lot
- 3 garage spots
- Built 1965
Property features AI
Finance
- Other: Directions: From Highway 183 turn onto Josephine Ave, then turn right onto 12th Street; it is the first driveway on the left.
- Financial info: Loan qualification: yes; Assumable: no
- HOA & community: No mandatory association dues
Exterior
- Parking: 3-car garage
- Utilities: No flood insurance requirement indicated
- Home design: Single-family residential; One story; Existing property
- Construction: Frame construction; Shingle roof; Post-tension foundation; Built status: existing
- Exterior features: Workshop; Interior lot
Interior
- Bedrooms: 3 bedrooms
- Bathrooms: 1 full bathroom
- Interior features: One-level living; Living area approximately 1,534 (per plans); No fireplace
Neighborhood map
What this means for you Summary
Snapshot
- This is a 3-bed/1.0-bath single-family listed at $160k.
Deal economics
- At list price, monthly cash flow is $13 ($150/yr) — positive.
- The deal already cash-flows at list — no discount required.
- To meet the 1% rule (rent ≥ 1% of price), the offer needs to be $120k (25.0% below list).
- Recommended offer: $120k (25.0% below list) — sets the bar for 1% rule.
Location & tenants
- Location reads 61/100 on livability (#304 in OK) — a middle-class / working-renter tenant base. Strengths: cost of living A+, housing A+; Watch: crime D, amenities F, commute F.
- Frederick (town): math 41% / reading 28% proficiency, ranked #46 of 270 in OK (top 17%) — families likely to look elsewhere, expect single-tenant / working-renter base with shorter leases; 68% free/reduced lunch — lower-income household profile, screen leases tightly.
- Zoned schools: Frederick Es (math 57% / reading 27%, grade F, #84 of 845 statewide, top 11%, 386 students, 0% FRL); Frederick Ms (math 32% / reading 32%, grade F, #39 of 345 statewide, top 12%, 174 students, 0% FRL); Frederick Hs (math 15% / reading 24%, grade F, #274 of 447 statewide, top 66%, 250 students, 0% FRL) — zoned schools average 0% FRL vs 68% district-wide (68 pts lower); this property's tenant base skews higher-income than the district average.
- Market conditions: 31 active listings in the ZIP.
Forward outlook
- Local home prices are declining (-3.0%/yr); year-one equity from $1k of loan paydown is wiped out by about $5k of value loss. Plan a longer hold.
- Tillman County population projected to shrink 8% by 2050 — rents likely to lag national; underwrite the cash flow, not the appreciation.
Negotiation context
- Only 13 days on market — expect competitive offers; lowballing is unlikely to land.
Risks & watch-outs
- Climate carrying-cost: extreme-heat days projected 7→19/yr by 2055 (HVAC capex compounding) — expect insurance premiums to compound above CPI over the hold.
Questions for the listing agent
- Built in 1965 — when were the roof, HVAC, electrical panel, plumbing, and water heater last replaced?
- Is there a deadline driving the sale (1031 exchange, divorce, estate, relocation)? That informs how much negotiation room exists.
- Schools are D-rated, which usually means shorter tenancies and higher turnover. Who's the typical renter profile here, and what's been the actual vacancy rate?
- Crime grade is D in this area — have there been break-ins, vandalism, or insurance claims at this property in the last 3 years? What carrier currently insures it and at what premium?
- The area grade is low — what's the realistic commute time and amenity access for the typical tenant pool here? Any planned neighborhood developments (good or bad) we should know about?
- What's the average days-on-market for RENTAL listings here right now (not sales)? A rising rental-DOM trend means longer vacancies and softer asking-rent achievability than the comps imply.
- What's the recent tenant-quality profile in this submarket — average credit score on applications, eviction rate, late-payment / NSF rate, and stable-employment percentage? A property-management company in the area should have these aggregated.
- How much new for-sale + rental construction is in the pipeline within 1–3 miles? Heavy new supply typically softens prices + rents 12–24 months out; constrained supply supports both.
Investment metrics
- 1% rule
- 0.75% ✗
- Cap rate
- 6.39%
- Cash-on-cash
- 0.34%
- DSCR
- 1.01
- GRM
- 11.1
CMA / ARV
- ARV (on-the-fly)
- $144,196
- Comps found
- 6
Show comp detail 6 sales within ~0.75 mi
| Address | Dist | Beds/Ba | Sqft | Sold | Price | $/sf | Match |
|---|---|---|---|---|---|---|---|
| 1612 Melissa St | 0.40mi | 3/1.0 | 1,500 (-2%) | 23mo | $125,825 | $84 | 59 |
| 1415 Cindy St | 0.38mi | 3/2.0 | 1,700 (+11%) | 2mo | $159,000 | $94 | 58 |
| 917 N 10th St | 0.35mi | 3/3.0 | 1,400 (-9%) | 14mo | $95,000 | $68 | 50 |
| 1523 Cindy St | 0.40mi | 2/2.0 (-1) | 1,700 (+11%) | 18mo | $133,000 | $78 | 39 |
| 521 N 16th St | 0.61mi | 3/2.0 | 1,700 (+11%) | 17mo | $192,000 | $113 | 35 |
| 707 N 18th St | 0.59mi | 2/2.0 (-1) | 1,324 (-14%) | 12mo | $150,000 | $113 | 30 |
Match score weights: distance 35% · size 25% · config 20% · recency 20%. Top-matched comps best support the ARV.
Projected returns pro-forma
-3.0% appreciation · 3.0% rent growth · sell at horizon
- IRR
- -15.8%
- Equity multiple
- 0.44×
- Total profit
- $-25,216
- Equity at exit
- $23,857
- IRR
- -7.5%
- Equity multiple
- 0.52×
- Total profit
- $-21,283
- Equity at exit
- $13,834
Cash invested: $44,800 (down + closing). Projections, not guarantees.
Landlord ↔ Tenant lean methodology
- Overall (STATE)
- 83 Strongly Landlord-Friendly
- State Oklahoma
- 83 Strongly Landlord-Friendly · R+20
- County
- — inherits STATE
- City
- — inherits STATE
ZIP-level market 73542
- Home prices YoY
- -2.0%
- Active inventory
- 31
- Price-to-rent
- 11.1×
Monthly cashflow live
- Estimated rent
- $1,199 medium interval (Pro) →
- Mortgage (P&I)
- −$839
- Tax from tax record
- −$29 /mo · $351/yr
- Insurance
- −$67
- HOA
- −$0
- Vacancy / Maint / Mgmt
- −$252
- Net cashflow
- $13
Break-even live
Sensitivity live
| Price | -10% $103 | -5% $58 | +0% $13 | +5% $-33 | +10% $-269 |
|---|---|---|---|---|---|
| Rent | -10% $-82 | -5% $-35 | +0% $13 | +5% $60 | +10% $107 |
| Rate | -1.0pp $93 | -0.5pp $53 | base $13 | +0.5pp $-29 | +1.0pp $-71 |
UW: 25.0% down · 7.5% · 30yr · 1.5% tax · 5.0% vac · 8.0% maint · 8.0% mgmt
Financing live
Cash to close
- Down payment
- $40,000
- Closing costs
- $4,800
- Reserves months
- —
- Total cash needed
- —
Loan-product check · same deal, 3 products live
Conventional
25% down · 7.5% · 30yr
- Down + closing
- —
- Monthly P&I
- —
- Monthly cashflow
- —
- DSCR
- —
- Eligible?
- —
Personal DTI + credit; lowest rate.
DSCR
20% down · 8.5% · 30yr
- Down + closing
- —
- Monthly P&I
- —
- Monthly cashflow
- —
- DSCR
- —
- Eligible?
- —
No personal income docs; deal must DSCR.
Hard money
10% down · 12.0% · 12mo
- Down + closing
- —
- Monthly P&I
- —
- Monthly cashflow
- —
- DSCR
- —
- Eligible?
- —
Short-term bridge; refi at stabilization.
Listing history 10 events
-
2026-06-21days on market $160,000 Active 13 DOM
-
2026-06-21days on market $160,000 Active 12 DOM
-
2026-06-18days on market $160,000 Active 10 DOM
-
2026-06-17days on market $160,000 Active 9 DOM
-
2026-06-16days on market $160,000 Active 8 DOM
-
2026-06-15days on market $160,000 Active 7 DOM
-
2026-06-13days on market $160,000 Active 5 DOM
-
2026-06-12days on market $160,000 Active 4 DOM
-
2026-06-09remarks 639-char remark
-
2026-06-09$160,000 Active 1 DOM
ⓘ Source: listings_history table (triggers on properties + properties_extension) + one-shot
backfill from property_details.listing_events for pre-trigger history.
Tax reassessment forecast OK · Resets to sale price
- Current annual tax
- $351 · $29/mo
- Projected year-2 tax
- $1,440 · $120/mo
- Expected delta
- +$1,089/yr (+$91/mo · 310.3%)
ⓘ Screening estimate from a state-policy table — verify with the county assessor before closing.
Climate risk First Street
- Flood 1/10 Low 0% chance over 30 yrs
- Wildfire 3/10 Moderate
- Heat 7/10 Severe 7 d/yr ≥109°F today · 19 d/yr by 30 yrs out
- Wind 3/10 Moderate 6% chance of damaging wind over 30 yrs
- Air quality 1/10 Low 0 unhealthy d/yr today · 0 by 30 yrs out
Nearby sold comps map
Loading sold comps map…
Walkable amenities ~0.75 mi
Loading nearby amenities…
Taxation est. · year 1
- Rental income
- $14,392
- − Mortgage interest
- −$8,962
- − Property taxes
- −$351
- − Insurance
- −$800
- − Repairs & maintenance
- −$1,151
- − Management
- −$1,151
- − Depreciation
- −$4,655
- Taxable loss
- −$2,678
- Est. tax savings @ 24.0%
- +$643
- After-tax cash flow
- $793/yr
For passive investors: Depreciation is non-cash, so a rental often shows a tax loss while cash-flowing — sheltering income. Rental losses are passive: they offset passive income freely, and up to $25,000/yr can offset ordinary (W-2) income if you actively participate and your MAGI is under $100k (phasing out to $0 by $150k); unused losses carry forward. On sale, claimed depreciation is recaptured at up to 25%, and gains may owe capital-gains tax (a 1031 exchange can defer both). Figures are a year-1 estimate at your 24.0% rate — not tax advice; consult a CPA.
Schools (NCES district)
- District
- Frederick
- NCES district ID
- 4012150
- Math proficiency
- 41% ▼ -2.00%
- Reading proficiency
- 28% ▼ -13.00%
- Median HH income
- $34,495
- Composite
- 28.52/100
- National rank
- #6735
- State rank
- #46 of 270 in OK
Livability — Frederick
- Score
- 61/100
- State rank
- #304
- US rank
- #17869
Category grades
Schools grade is shown separately in the Schools card above.
Census & demographics
- Census place
- Frederick, OK
- Population (ZIP)
- 4,167
Population outlook (Tillman County) Hauer SSP2
- Today (2025)
- 6,949 people
- By 2030
- 6,737 · -3.1%
- By 2040
- 6,402 · -7.9%
- By 2050
- 6,364 · -8.4%
- By 2075
- 7,335 · +5.6%
- By 2100
- 9,166 · +31.9%
Race, ethnicity, and origin ACS 2023
- Neighborhood character
- Diverse neighborhood (Simpson 0.61)
- Race & ethnicity
- White 54% Hispanic / Latino 31% Two or more races 13% Black 9% Native American 3%
- Hispanic origin (detail)
- Mexican 29%
- Common ancestry
- Italian 3% European 1% Slovak 1%
- Foreign-born
- 3% · Canada
- Languages at home
- 88% English-only · Spanish 12%
Political lean MEDSL · Tillman
- 2024 margin
- Solid R (+59.5) · D 19.7% · R 79.2% · Other 1.1%
- 2008→2024 swing
- -23.8pp toward R · 2008: -35.6pp · 2024: -59.5pp
- All cycles
- 2024: R+59.5 2020: R+54.6 2016: R+47.6 2012: R+33.4 2008: R+35.6
Not yet ingested
- Civics
- —
Market trends
- HPI YoY
- ▼ -3.32%
- Current HPI
- 159.0458
- Rent YoY
- —
- Metro
- —
- State GDP YoY
- ▲ 1.55%
- F500 in state
- 6
Industry mix (Fortune 500 HQ in OK)
| Industry | F500 HQs | Revenue |
|---|---|---|
| Energy | 3 | $48B |
|
||
Price history
1 event — show timeline
- 2026-06-05 Listed $160,000 MLSOK
Property tax history
+4.9%/yrLatest (2025): $351 · -2.0% YoY. Source: county tax records.
Cash-flow waterfall
monthlySold comps — $/sqft
last 12 mo · ≤1 miLoading sold comps…