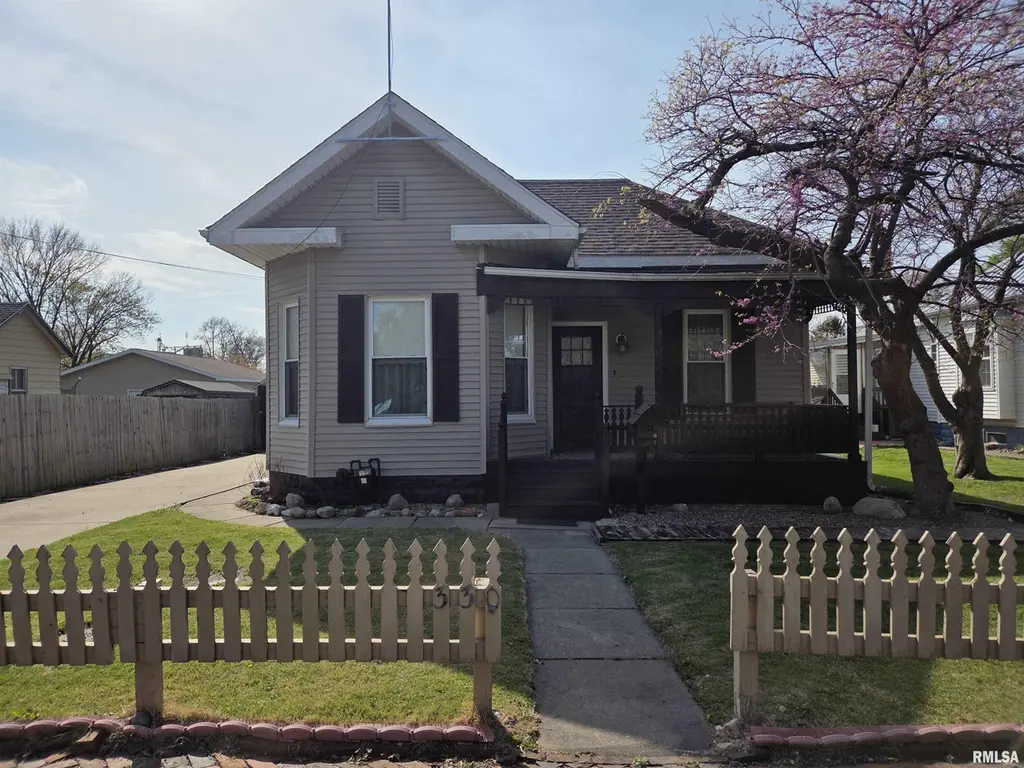
330 N West St · Carlinville, IL
Flood risk 4/10 · Minor
- FEMA flood zone
- X
- Chance of flooding over 30 yrs
- 0.2%
- Est. flood insurance / yr
- $473 – $860
Fire risk 1/10 · Minimal
- Est. fire insurance / yr
- $804 – $1,492
Heat risk 4/10 · Minor
- Hot days now (above 105°F)
- 7 days/yr
- Hot days in 30 yrs
- 21 days/yr
Wind risk 2/10 · Minimal
- Chance of severe wind over 30 yrs
- 2.0%
Air-quality risk 2/10 · Minimal
- Unhealthy air days now
- 1 days/yr
- Unhealthy air days in 30 yrs
- 1 days/yr
Risk factors via First Street. Map © Google.
Why this score? — see what drove the C- grade
The composite is a weighted blend of 9 inputs, each scored 0–100. Each bar is that input's sub-score; the figure is the points it added to the 100-point composite (weight × sub-score).
- Cash flow +26.3/30.0
- DSCR +8.9/10.0
- 1% rule +7.0/10.0
- Livability +3.4/5.0
- Schools +3.2/10.0
- Rent growth +2.5/5.0
- Condition / age +2.5/5.0
- ARV discount +0.0/15.0
- Appreciation +0.0/10.0
$89,000
🖨 Deal sheet (PDF) 📄 Offer letter ✓ Due diligence
Listing remarks MLS
New roof! This home features original hardwood, sizeable rooms and a great fenced in back yard. 1-Car detached garage with additional storage built on. Partial unfinished basement offers ample storage. Selling AS-IS. Sellers to make no repairs.
Key facts
- 7,884 sq ft lot
- Garage
- Built 1940
Neighborhood map
What this means for you Summary
Snapshot
- This is a 2-bed/1.0-bath single-family listed at $89k.
Deal economics
- At list price, monthly cash flow is $231 ($3k/yr) — positive.
- The deal already cash-flows at list — no discount required.
- Meets the 1% rule at list price ($1k rent vs $89k).
- Recommended offer: $84k (6.0% below list) — sets the bar for market timing.
- Cap rate 9.4% vs local median 4.5% in Carlinville — top-decile yield for the area; either an underpriced asset or a hidden risk that comps aren't pricing in. Stress-test before assuming the spread holds.
Location & tenants
- Location reads 68/100 on livability (#477 in IL) — a middle-class / working-renter tenant base. Strengths: cost of living A+, housing A+, health & safety B+; Watch: employment D, schools D-, crime F.
- Carlinville CUSD 1 (town): math 33% / reading 40% proficiency, ranked #168 of 620 in IL (top 27%) — families likely to look elsewhere, expect single-tenant / working-renter base with shorter leases.
- Market conditions: 38 active listings in the ZIP; 4 comparable units currently listed for rent nearby; rentals lingering (median 45d on market — plan ~5-8 weeks vacancy on turnover, expect pricing pressure); 50% of comp listings sitting > 30 days — soft ceiling on asking rent; 70 units permitted in Macoupin County in 2024 (0 in 5+ unit buildings).
Forward outlook
- Local home prices are declining (-3.0%/yr); year-one equity from $615 of loan paydown is wiped out by about $3k of value loss. Plan a longer hold.
- Macoupin County population projected at -27% by 2050 — secular population decline; favor cash flow + early exit over multi-decade hold.
- At projected returns (-3.0% appreciation + 3.0% rent growth), your $25k cash investment doubles in ~10 years — after that, you're playing with house money.
Negotiation context
- It's been on market 73 days — a 6% lower offer ($84k) is reasonable based on typical stale-listing flexibility.
Risks & watch-outs
- Watch-outs: built in 1940 — expect roof / HVAC / electrical / plumbing capex.
Questions for the listing agent
- It's been on market 73 days. Have you received any prior offers? Is the seller open to a 6% concession, seller financing, or rate buy-down credit?
- Built in 1940 — when were the roof, HVAC, electrical panel, plumbing, and water heater last replaced?
- Why hasn't it sold? Are there any deal-killer items the seller is aware of (foundation, flood, title, zoning, code violations)?
- Is there a deadline driving the sale (1031 exchange, divorce, estate, relocation)? That informs how much negotiation room exists.
- Schools are D-rated, which usually means shorter tenancies and higher turnover. Who's the typical renter profile here, and what's been the actual vacancy rate?
- Crime grade is F in this area — have there been break-ins, vandalism, or insurance claims at this property in the last 3 years? What carrier currently insures it and at what premium?
- What's the average days-on-market for RENTAL listings here right now (not sales)? A rising rental-DOM trend means longer vacancies and softer asking-rent achievability than the comps imply.
- What's the recent tenant-quality profile in this submarket — average credit score on applications, eviction rate, late-payment / NSF rate, and stable-employment percentage? A property-management company in the area should have these aggregated.
- How much new for-sale + rental construction is in the pipeline within 1–3 miles? Heavy new supply typically softens prices + rents 12–24 months out; constrained supply supports both.
Investment metrics
- 1% rule
- 1.20% ✓
- Cap rate
- 9.40%
- Cash-on-cash
- 11.11%
- DSCR
- 1.49
- GRM
- 6.9
CMA / ARV
- ARV (median comp)
- $60,494
- List price
- $89,000
- Delta
- 47.12%
- Verdict
- OVERPRICED
- Comps
- 20 within 1.0 mi
Show comp detail 12 sales within ~0.75 mi
| Address | Dist | Beds/Ba | Sqft | Sold | Price | $/sf | Match |
|---|---|---|---|---|---|---|---|
| 525 N Chiles St | 0.31mi | 2/1.5 | 1,069 (-3%) | 8mo | $72,000 | $67 | 71 |
| 624 Sumner St | 0.45mi | 2/2.0 | 1,080 (-2%) | 10mo | $107,000 | $99 | 63 |
| 410 N West St | 0.09mi | 2/1.0 | 965 (-13%) | 15mo | $61,000 | $63 | 62 |
| 353 Plum St | 0.06mi | 3/1.0 (+1) | 1,248 (+13%) | 10mo | $49,900 | $40 | 62 |
| 628 University St | 0.55mi | 2/1.0 | 1,140 (+3%) | 9mo | $104,000 | $91 | 62 |
| 512 S Broad St | 0.51mi | 2/1.5 | 1,163 (+5%) | 8mo | $104,000 | $89 | 58 |
| 611 Harrington St | 0.44mi | 3/2.0 (+1) | 1,218 (+10%) | 1mo | $115,000 | $94 | 52 |
| 431 Sumner St | 0.40mi | 3/1.0 (+1) | 940 (-15%) | 1mo | $82,500 | $88 | 50 |
| 903 N Charles St | 0.57mi | 3/1.5 (+1) | 1,090 (-1%) | 21mo | $45,000 | $41 | 47 |
| 732 Johnson St | 0.56mi | 3/2.0 (+1) | 1,155 (+4%) | 17mo | $59,900 | $52 | 43 |
| 418 E Elm St | 0.74mi | 3/2.5 (+1) | 1,100 (-0%) | 13mo | $89,700 | $82 | 42 |
| 402 Harrington St | 0.44mi | 3/2.0 (+1) | 1,200 (+9%) | 21mo | $74,000 | $62 | 39 |
Match score weights: distance 35% · size 25% · config 20% · recency 20%. Top-matched comps best support the ARV.
Projected returns pro-forma
-3.0% appreciation · 3.0% rent growth · sell at horizon
- IRR
- 0.3%
- Equity multiple
- 1.01×
- Total profit
- $289
- Equity at exit
- $13,270
- IRR
- 10.0%
- Equity multiple
- 1.77×
- Total profit
- $19,238
- Equity at exit
- $7,695
Cash invested: $24,920 (down + closing). Projections, not guarantees.
Landlord ↔ Tenant lean methodology
- Overall (STATE)
- 43 Moderately Tenant-Leaning
- State Illinois
- 43 Moderately Tenant-Leaning · D+7
- County
- — inherits STATE
- City
- — inherits STATE
ZIP-level market 62626
- Home prices YoY
- -14.8%
- Active inventory
- 38
- Price-to-rent
- 6.9×
Monthly cashflow live
- Estimated rent
- $1,071 medium interval (Pro) →
- Mortgage (P&I)
- −$467
- Tax est. 1.5%
- −$111 /mo · $1,335/yr
- Insurance
- −$37
- HOA
- −$0
- Vacancy / Maint / Mgmt
- −$225
- Net cashflow
- $231
Break-even live
Sensitivity live
| Price | -10% $292 | -5% $261 | +0% $231 | +5% $200 | +10% $169 |
|---|---|---|---|---|---|
| Rent | -10% $146 | -5% $188 | +0% $231 | +5% $273 | +10% $315 |
| Rate | -1.0pp $276 | -0.5pp $253 | base $231 | +0.5pp $208 | +1.0pp $184 |
UW: 25.0% down · 7.5% · 30yr · 1.5% tax · 5.0% vac · 8.0% maint · 8.0% mgmt
Financing live
Cash to close
- Down payment
- $22,250
- Closing costs
- $2,670
- Reserves months
- —
- Total cash needed
- —
Loan-product check · same deal, 3 products live
Conventional
25% down · 7.5% · 30yr
- Down + closing
- —
- Monthly P&I
- —
- Monthly cashflow
- —
- DSCR
- —
- Eligible?
- —
Personal DTI + credit; lowest rate.
DSCR
20% down · 8.5% · 30yr
- Down + closing
- —
- Monthly P&I
- —
- Monthly cashflow
- —
- DSCR
- —
- Eligible?
- —
No personal income docs; deal must DSCR.
Hard money
10% down · 12.0% · 12mo
- Down + closing
- —
- Monthly P&I
- —
- Monthly cashflow
- —
- DSCR
- —
- Eligible?
- —
Short-term bridge; refi at stabilization.
Rent comps 4 comps
| Address | Beds | Baths | Sqft | Rent | $/sqft | DOM | Units | Dist |
|---|---|---|---|---|---|---|---|---|
| 213 N East St Unit A Carlinville, IL | 2.0 | 1.5 | 1100 | $1,100 | $1.00 | 24d | 1 | 0.19mi |
| 213 N East St Unit B Carlinville, IL | 2.0 | 1.5 | 1100 | $1,100 | $1.00 | 44d | 1 | 0.19mi |
| 524 N Chiles St Carlinville, IL | 3.0 | 1.0 | 1000 | $1,000 | $1.00 | 44d | 1 | 0.34mi |
| 928 Sumner St Carlinville, IL | 3.0 | 2.0 | 1100 | $1,000 | $0.91 | 24d | 1 | 0.61mi |
Listing history 17 events
-
2026-06-21days on market $89,000 Active 73 DOM
-
2026-06-18days on market $89,000 Active 71 DOM
-
2026-06-17days on market $89,000 Active 70 DOM
-
2026-06-16days on market $89,000 Active 69 DOM
-
2026-06-15days on market $89,000 Active 68 DOM
-
2026-06-13days on market $89,000 Active 66 DOM
-
2026-06-12days on market $89,000 Active 65 DOM
-
2026-06-09days on market $89,000 Active 62 DOM
-
2026-06-08days on market $89,000 Active 61 DOM
-
2026-06-07days on market $89,000 Active 60 DOM
-
2026-06-07days on market $89,000 Active 59 DOM
-
2026-06-04days on market $89,000 Active 56 DOM
-
2026-06-02days on market $89,000 Active 55 DOM
-
2026-06-01days on market $89,000 Active 54 DOM
-
2026-05-31days on market $89,000 Active 53 DOM
-
2026-05-31days on market $89,000 Active 52 DOM
-
2026-04-08$89,000 Active 245-char remark
Show marketing remark (245 chars)
New roof! This home features original hardwood, sizeable rooms and a great fenced in back yard. 1-Car detached garage with additional storage built on. Partial unfinished basement offers ample storage. Selling AS-IS. Sellers to make no repairs.
ⓘ Source: listings_history table (triggers on properties + properties_extension) + one-shot
backfill from property_details.listing_events for pre-trigger history.
Climate risk First Street
- Flood 4/10 Moderate FEMA zone X · 20% chance over 30 yrs
- Wildfire 1/10 Low
- Heat 4/10 Moderate 7 d/yr ≥105°F today · 21 d/yr by 30 yrs out
- Wind 2/10 Low 2% chance of damaging wind over 30 yrs
- Air quality 2/10 Low 1 unhealthy d/yr today · 1 by 30 yrs out
Nearby sold comps map
Loading sold comps map…
Walkable amenities ~0.75 mi
Loading nearby amenities…
Taxation est. · year 1
- Rental income
- $12,847
- − Mortgage interest
- −$4,985
- − Property taxes
- −$1,335
- − Insurance
- −$445
- − Repairs & maintenance
- −$1,028
- − Management
- −$1,028
- − Depreciation
- −$2,589
- Taxable income
- $1,437
- Est. tax owed @ 24.0%
- −$345
- After-tax cash flow
- $2,424/yr
For passive investors: Depreciation is non-cash, so a rental often shows a tax loss while cash-flowing — sheltering income. Rental losses are passive: they offset passive income freely, and up to $25,000/yr can offset ordinary (W-2) income if you actively participate and your MAGI is under $100k (phasing out to $0 by $150k); unused losses carry forward. On sale, claimed depreciation is recaptured at up to 25%, and gains may owe capital-gains tax (a 1031 exchange can defer both). Figures are a year-1 estimate at your 24.0% rate — not tax advice; consult a CPA.
Schools (NCES district)
- District
- Carlinville CUSD 1
- NCES district ID
- 1708430
- Math proficiency
- 33% ▼ -3.00%
- Reading proficiency
- 40% ▼ -12.00%
- Median HH income
- $53,617
- Composite
- 31.91/100
- National rank
- #5854
- State rank
- #168 of 620 in IL
Livability — Carlinville
- Score
- 68/100
- State rank
- #477
- US rank
- #9883
Category grades
Schools grade is shown separately in the Schools card above.
Census & demographics
- Census place
- Carlinville, IL
- City population
- 7,911
- Population (ZIP)
- 7,911
Population outlook (Macoupin County) Hauer SSP2
- Today (2025)
- 42,867 people
- By 2030
- 40,796 · -4.8%
- By 2040
- 36,135 · -15.7%
- By 2050
- 31,469 · -26.6%
- By 2075
- 22,102 · -48.4%
- By 2100
- 15,380 · -64.1%
Race, ethnicity, and origin ACS 2023
- Neighborhood character
- Predominantly White (91%)
- Race & ethnicity
- White 91% Two or more races 5% Hispanic / Latino 3% Black 2%
- Common ancestry
- Serbian 1% Italian 1% Iranian 1%
- Foreign-born
- 2% · Canada
- Languages at home
- 97% English-only · Spanish 2%
Political lean MEDSL · Macoupin
- 2024 margin
- Solid R (+39.2) · D 29.4% · R 68.7% · Other 1.9%
- 2008→2024 swing
- -49.0pp toward R · 2008: 9.8pp · 2024: -39.2pp
- All cycles
- 2024: R+39.2 2020: R+36.5 2016: R+35.0 2012: R+7.0 2008: D+9.8
Not yet ingested
- Civics
- —
Market trends
- HPI YoY
- ▼ -31.39%
- Current HPI
- 180.5544
- Rent YoY
- —
- Metro
- —
- State GDP YoY
- ▲ 1.59%
- F500 in state
- 60
Industry mix (Fortune 500 HQ in IL)
| Industry | F500 HQs | Revenue |
|---|---|---|
| Insurance | 4 | $201B |
|
||
| Consumer Goods | 4 | $87B |
|
||
| Industrial Machinery | 3 | $64B |
|
||
| Healthcare | 2 | $55B |
|
||
| Retail / Pharmacy | 1 | $148B |
|
||
| Agriculture / Food | 1 | $86B |
|
||
Price history
1 event — show timeline
- 2026-04-08 Listed $89,000 RMLSA as Distributed by MLS Grid
Property tax history
+0.2%/yrLatest (2024): $18 · -4.4% YoY. Source: county tax records.
Cash-flow waterfall
monthlySold comps — $/sqft
last 12 mo · ≤1 miLoading sold comps…