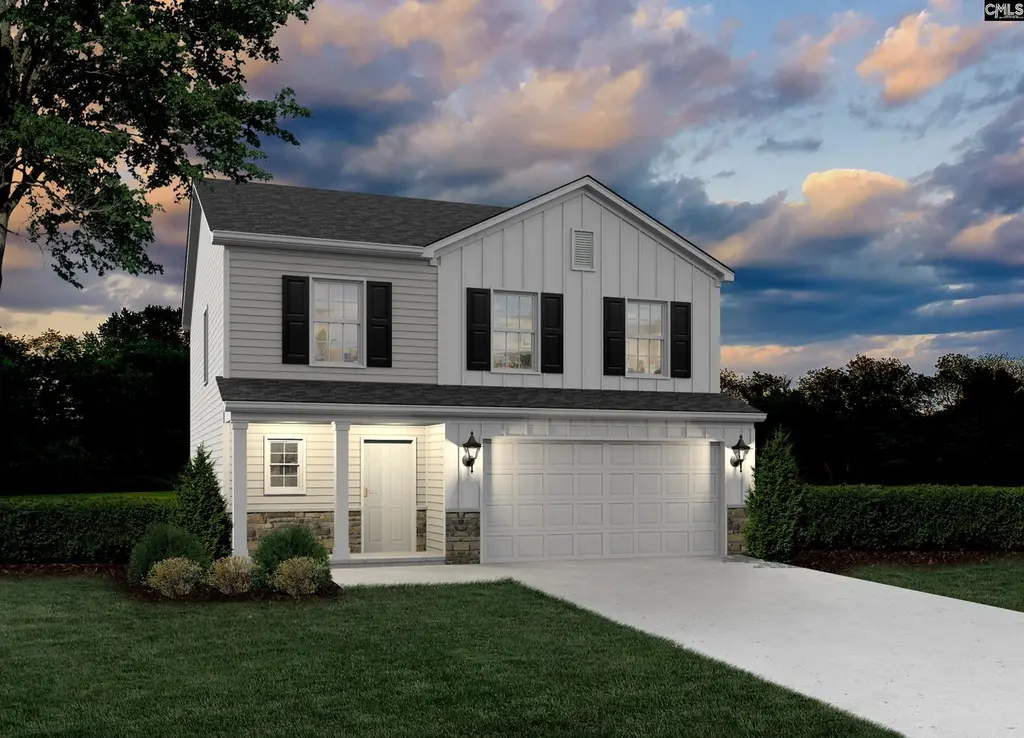
430 Viceroy Path · Gilbert, SC
Flood risk No data
- FEMA flood zone
- —
- Chance of flooding over 30 yrs
- —
- Est. flood insurance / yr
- —
Fire risk No data
- Est. fire insurance / yr
- —
Heat risk No data
- Hot days now (above threshold)
- —
- Hot days in 30 yrs
- —
Wind risk No data
- Chance of severe wind over 30 yrs
- —
Air-quality risk No data
- Unhealthy air days now
- —
- Unhealthy air days in 30 yrs
- —
Risk factors via First Street. Map © Google.
Why this score? — see what drove the D grade
The composite is a weighted blend of 9 inputs, each scored 0–100. Each bar is that input's sub-score; the figure is the points it added to the 100-point composite (weight × sub-score).
- Appreciation +10.0/10.0
- ARV discount +7.5/15.0
- Cash flow +7.1/30.0
- Schools +4.2/10.0
- Livability +3.6/5.0
- Rent growth +2.5/5.0
- Condition / age +2.5/5.0
- 1% rule +2.1/10.0
- DSCR +1.3/10.0
$281,940
🖨 Deal sheet (PDF) 📄 Offer letter ✓ Due diligence
Listing remarks
Estimated Completion, July 2026. Step into a welcoming foyer with a convenient half bath and generous closet space. The entry opens seamlessly into a spacious living area that flows into the kitchen and breakfast nook, creating an ideal setting for everyday living and entertaining alike. Upstairs, you’ll find four well-appointed bedrooms, a full secondary bath, and a centrally located laundry room designed for modern convenience. The private owner’s suite is a true retreat, featuring a luxurious en-suite bath with an expansive shower and a direct connection to a large walk-in closet. Beyond the home itself, enjoy resort-style community amenities including a sparkling pool and ca
Key facts
- Breakfast nook
- Full secondary bath
- Spacious living area
Tags
Property features AI
Finance
- Other: Lot number 88; Approximately 0.11 acres
- HOA & community: Property is part of an association
Exterior
- Parking: Attached garage with 2 garage spaces
- Utilities: Public sewer; Public water
- Home design: Single-family property (detached implied by garage attached)
- Construction: Slab foundation
- Exterior features: Vinyl exterior finish; Paved road access; Public water
Interior
- Kitchen: Granite counter tops; Luxury vinyl plank flooring
- Bedrooms: Master bedroom on the second level; Second bedroom on the second level; Third bedroom on the second level; Fourth bedroom on the second level
- Flooring: Luxury vinyl plank flooring throughout main living areas
- Bathrooms: Two full bathrooms; One half bathroom
- Heating & cooling: Central air conditioning; Gas pack heating
- Interior features: Great room with luxury vinyl plank flooring; Kitchen with granite countertops and luxury vinyl plank flooring; Washer/dryer located on the second level; Central cooling; Gas pack heating
- Laundry & utility: Laundry on the second level
Neighborhood map
What this means for you Summary
Snapshot
- This is a 4-bed/2.5-bath single-family listed at $282k.
Deal economics
- At list price, monthly cash flow is $-404 ($-5k/yr) — negative.
- To cash-flow at today's rent, offer at most $224k (20.7% below list).
- To meet the 1% rule (rent ≥ 1% of price), the offer needs to be $201k (28.7% below list).
- Recommended offer: $201k (28.7% below list) — sets the bar for 1% rule.
Location & tenants
- Location reads 71/100 on livability (#52 in SC) — a middle-class / working-renter tenant base. Strengths: cost of living A+, housing A+, crime B; Watch: amenities F, commute F, health & safety F.
- Lexington 01 (suburban): math 42% / reading 53% proficiency, ranked #11 of 80 in SC (top 14%) — families likely to look elsewhere, expect single-tenant / working-renter base with shorter leases.
- Zoned schools: Gilbert Elementary (math 33% / reading 26%, grade F, #399 of 597 statewide, top 69%, 768 students, 45% FRL); Gilbert Middle (math 26% / reading 36%, grade F, #128 of 229 statewide, top 58%, 822 students, 40% FRL); Gilbert High (math 37% / reading 83%, grade C+, #109 of 196 statewide, top 55%, 1,118 students, 38% FRL).
- Market conditions: 280 active listings in the ZIP; 2 comparable units currently listed for rent nearby; 1,712 units permitted in Lexington County in 2024 (0 in 5+ unit buildings).
Forward outlook
- In year one you build about $30k of equity ($2k loan paydown + $28k appreciation (10.0% local appreciation)).
- Lexington County population projected at +26% by 2050 — long-run rental-demand tailwind backs the buy-and-hold thesis.
- By year 2, paydown + projected appreciation supports a ~$48k cash-out refi (75% LTV) — recoverable capital for the next deal without selling this one.
Negotiation context
- It's been on market 72 days — a 6% lower offer ($265k) is reasonable based on typical stale-listing flexibility.
Questions for the listing agent
- What do current leases actually rent for vs. the listed asking? Can we see a recent rent roll and the last 12 months of T-12 income?
- It's been on market 72 days. Have you received any prior offers? Is the seller open to a 29% concession, seller financing, or rate buy-down credit?
- What does the HOA fee cover, when was the last increase, and are there any pending special assessments or reserve-fund shortfalls?
- Why hasn't it sold? Are there any deal-killer items the seller is aware of (foundation, flood, title, zoning, code violations)?
- Is there a deadline driving the sale (1031 exchange, divorce, estate, relocation)? That informs how much negotiation room exists.
- Schools are D-rated, which usually means shorter tenancies and higher turnover. Who's the typical renter profile here, and what's been the actual vacancy rate?
- The area grade is low — what's the realistic commute time and amenity access for the typical tenant pool here? Any planned neighborhood developments (good or bad) we should know about?
- What's the average days-on-market for RENTAL listings here right now (not sales)? A rising rental-DOM trend means longer vacancies and softer asking-rent achievability than the comps imply.
- What's the recent tenant-quality profile in this submarket — average credit score on applications, eviction rate, late-payment / NSF rate, and stable-employment percentage? A property-management company in the area should have these aggregated.
- How much new for-sale + rental construction is in the pipeline within 1–3 miles? Heavy new supply typically softens prices + rents 12–24 months out; constrained supply supports both.
Investment metrics
- 1% rule
- 0.71% ✗
- Cap rate
- 4.57%
- Cash-on-cash
- -6.14%
- DSCR
- 0.73
- GRM
- 11.7
CMA / ARV
No comps found within radius.
Projected returns pro-forma
10.0% appreciation · 3.0% rent growth · sell at horizon
- IRR
- 19.9%
- Equity multiple
- 2.62×
- Total profit
- $127,887
- Equity at exit
- $253,994
- IRR
- 18.3%
- Equity multiple
- 6.03×
- Total profit
- $396,949
- Equity at exit
- $547,747
Cash invested: $78,943 (down + closing). Projections, not guarantees.
Landlord ↔ Tenant lean methodology
- Overall (STATE)
- 90 Strongly Landlord-Friendly
- State South Carolina
- 90 Strongly Landlord-Friendly · R+6
- County
- — inherits STATE
- City
- — inherits STATE
ZIP-level market 29054
- Home prices YoY
- 4.7%
- Active inventory
- 280
- Price-to-rent
- 11.7×
Monthly cashflow live
- Estimated rent
- $2,011 medium interval (Pro) →
- Mortgage (P&I)
- −$1,479
- Tax est. 1.5%
- −$352 /mo · $4,229/yr
- Insurance
- −$117
- HOA
- −$44
- Vacancy / Maint / Mgmt
- −$422
- Net cashflow
- $-404
Break-even live
Sensitivity live
| Price | -10% $-209 | -5% $-306 | +0% $-404 | +5% $-501 | +10% $-599 |
|---|---|---|---|---|---|
| Rent | -10% $-563 | -5% $-483 | +0% $-404 | +5% $-324 | +10% $-245 |
| Rate | -1.0pp $-262 | -0.5pp $-332 | base $-404 | +0.5pp $-477 | +1.0pp $-551 |
UW: 25.0% down · 7.5% · 30yr · 1.5% tax · 5.0% vac · 8.0% maint · 8.0% mgmt
Financing live
Cash to close
- Down payment
- $70,485
- Closing costs
- $8,458
- Reserves months
- —
- Total cash needed
- —
Loan-product check · same deal, 3 products live
Conventional
25% down · 7.5% · 30yr
- Down + closing
- —
- Monthly P&I
- —
- Monthly cashflow
- —
- DSCR
- —
- Eligible?
- —
Personal DTI + credit; lowest rate.
DSCR
20% down · 8.5% · 30yr
- Down + closing
- —
- Monthly P&I
- —
- Monthly cashflow
- —
- DSCR
- —
- Eligible?
- —
No personal income docs; deal must DSCR.
Hard money
10% down · 12.0% · 12mo
- Down + closing
- —
- Monthly P&I
- —
- Monthly cashflow
- —
- DSCR
- —
- Eligible?
- —
Short-term bridge; refi at stabilization.
Rent comps 2 comps
| Address | Beds | Baths | Sqft | Rent | $/sqft | DOM | Units | Dist |
|---|---|---|---|---|---|---|---|---|
| 607 Wild Tulip Ct Gilbert, SC | 4.0 | 2.5 | 2358 | $2,145 | $0.91 | 5d | 1 | 0.45mi |
| 622 Wild Tulip Ct Gilbert, SC | 3.0 | 2.5 | 1800 | $1,875 | $1.04 | 13d | 1 | 0.45mi |
HOA detail
- Monthly dues
- $44 · $528/yr
- Likely covers
- pool
Listing history 16 events
-
2026-06-22days on market $281,940 Active 72 DOM
-
2026-06-18days on market $281,940 Active 69 DOM
-
2026-06-17days on market $281,940 Active 68 DOM
-
2026-06-16days on market $281,940 Active 67 DOM
-
2026-06-15days on market $281,940 Active 66 DOM
-
2026-06-14days on market $281,940 Active 64 DOM
-
2026-06-10days on market $281,940 Active 61 DOM
-
2026-06-09days on market $281,940 Active 60 DOM
-
2026-06-09price $281,940 Active 59 DOM
-
2026-06-08days on market $277,602 Active 59 DOM
-
2026-06-07days on market $277,602 Active 58 DOM
-
2026-06-03days on market $277,602 Active 54 DOM
-
2026-06-03days on market $277,602 Active 53 DOM
-
2026-06-02days on market $277,602 Active 52 DOM
-
2026-05-31days on market $277,602 Active 51 DOM
-
2026-04-10$277,602 Active
ⓘ Source: listings_history table (triggers on properties + properties_extension) + one-shot
backfill from property_details.listing_events for pre-trigger history.
Nearby sold comps map
Loading sold comps map…
Walkable amenities ~0.75 mi
Loading nearby amenities…
Taxation est. · year 1
- Rental income
- $24,130
- − Mortgage interest
- −$15,793
- − Property taxes
- −$4,229
- − Insurance
- −$1,410
- − Repairs & maintenance
- −$1,930
- − Management
- −$1,930
- − HOA
- −$528
- − Depreciation
- −$8,202
- Taxable loss
- −$9,892
- Est. tax savings @ 24.0%
- +$2,374
- After-tax cash flow
- $-2,472/yr
For passive investors: Depreciation is non-cash, so a rental often shows a tax loss while cash-flowing — sheltering income. Rental losses are passive: they offset passive income freely, and up to $25,000/yr can offset ordinary (W-2) income if you actively participate and your MAGI is under $100k (phasing out to $0 by $150k); unused losses carry forward. On sale, claimed depreciation is recaptured at up to 25%, and gains may owe capital-gains tax (a 1031 exchange can defer both). Figures are a year-1 estimate at your 24.0% rate — not tax advice; consult a CPA.
Schools (NCES district)
- District
- Lexington 01
- NCES district ID
- 4502700
- Math proficiency
- 42% ▼ -12.00%
- Reading proficiency
- 53% ▼ -2.00%
- Median HH income
- $61,298
- Composite
- 41.75/100
- National rank
- #3399
- State rank
- #11 of 80 in SC
Livability — Gilbert
- Score
- 71/100
- State rank
- #52
- US rank
- #7008
Category grades
Schools grade is shown separately in the Schools card above.
Census & demographics
- Population (ZIP)
- 10,137
Population outlook (Lexington County) Hauer SSP2
- Today (2025)
- 322,999 people
- By 2030
- 342,356 · +6.0%
- By 2040
- 377,715 · +16.9%
- By 2050
- 406,984 · +26.0%
- By 2075
- 465,447 · +44.1%
- By 2100
- 485,674 · +50.4%
Race, ethnicity, and origin ACS 2023
- Neighborhood character
- Predominantly White (86%)
- Race & ethnicity
- White 86% Hispanic / Latino 6% Two or more races 6% Black 2%
- Hispanic origin (detail)
- Mexican 4%
- Common ancestry
- Slovak 2% Italian 2% Serbian 2%
- Foreign-born
- 2% · Canada, Jamaica
- Languages at home
- 94% English-only · Spanish 5%
Political lean MEDSL · Lexington
- 2024 margin
- Solid R (+33.5) · D 32.5% · R 66.0% · Other 1.4%
- 2008→2024 swing
- +4.6pp toward D · 2008: -38.0pp · 2024: -33.5pp
- All cycles
- 2024: R+33.5 2020: R+30.1 2016: R+36.7 2012: R+37.8 2008: R+38.0
Not yet ingested
- Civics
- —
Market trends
- HPI YoY
- ▲ 20.87%
- Current HPI
- 461.9332
- Rent YoY
- —
- Metro
- —
- State GDP YoY
- ▲ 4.51%
- F500 in state
- 2
Industry mix (Fortune 500 HQ in SC)
| Industry | F500 HQs | Revenue |
|---|---|---|
| Packaging | 1 | $7B |
|
||
Price history
1 event — show timeline
- 2026-04-10 Listed $277,602 Consolidated MLS
Cash-flow waterfall
monthlySold comps — $/sqft
last 12 mo · ≤1 miLoading sold comps…