 Duplex
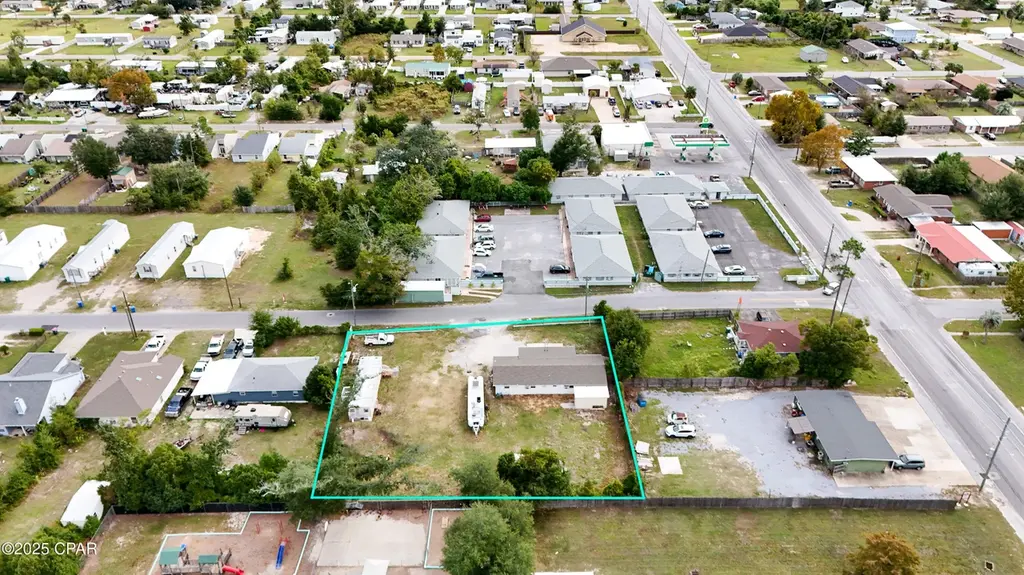
115 N Kimbrel Ave · Callaway, FL
Flood risk 1/10 · Minimal
- FEMA flood zone
- X (unshaded)
- Chance of flooding over 30 yrs
- 0.0%
- Est. flood insurance / yr
- $507 – $1,088
Fire risk 5/10 · Moderate
- Est. fire insurance / yr
- $947 – $1,759
Heat risk 10/10 · Severe
- Hot days now (above 104°F)
- 7 days/yr
- Hot days in 30 yrs
- 21 days/yr
Wind risk 9/10 · Severe
- Chance of severe wind over 30 yrs
- 99.0%
Air-quality risk 1/10 · Minimal
- Unhealthy air days now
- 0 days/yr
- Unhealthy air days in 30 yrs
- 0 days/yr
Risk factors via First Street. Map © Google.
Why this score? — see what drove the C- grade
The composite is a weighted blend of 9 inputs, each scored 0–100. Each bar is that input's sub-score; the figure is the points it added to the 100-point composite (weight × sub-score).
- Cash flow +25.3/30.0
- DSCR +8.3/10.0
- 1% rule +5.6/10.0
- Schools +4.3/10.0
- Livability +3.2/5.0
- Rent growth +2.8/5.0
- Condition / age +2.5/5.0
- ARV discount +0.0/15.0
- Appreciation +0.0/10.0
$250,000
🖨 Deal sheet 📄 Offer letter ✓ Due diligence
Multi-family units
County records classify this as Multi-Family (2-4 Unit). Listing-text estimate: 2 units. confirmed
Listing remarks MLS
Enough Room to Add more units! Duplex for sale that previously rented at total $800/week ($3200/month). Week to week leases. Owner paid all utilities and provided storage. The mobile home on the property is not live able and was repurposed for storage only. The land is 1/2 Acre zoned for more units per City of Callaway for mobile homes. Prior to Hurricane Michael multiple mobiles were on property.
Key facts
- Duplex for sale
- 0.5 acre lot
- Built 1964
Tags
Neighborhood map
What this means for you Summary
Snapshot
- This is a 2 × 2-bed/1.0-bath units multifamily listed at $250k.
Deal economics
- At list price, monthly cash flow is $566 ($7k/yr) — positive. Per door: $283/mo.
- The deal already cash-flows at list — no discount required.
- Meets the 1% rule at list price ($3k rent vs $250k).
- Recommended offer: $220k (12.0% below list) — sets the bar for market timing.
- Cap rate 9.0% vs local median 5.1% in Callaway — top-decile yield for the area; either an underpriced asset or a hidden risk that comps aren't pricing in. Stress-test before assuming the spread holds.
Location & tenants
- Location reads 64/100 on livability (#690 in FL) — a middle-class / working-renter tenant base. Strengths: cost of living A+, housing A+; Watch: employment D+, schools F, amenities F.
- Bay (suburban): math 51% / reading 51% proficiency, ranked #29 of 73 in FL (top 40%) — acceptable for families but not a draw, mixed tenant base, ~2y average lease.
- Market conditions: Rents rising (+1.1%/yr); 969 active listings in the ZIP; 24 comparable units currently listed for rent nearby; rentals at typical pace (median 21d on market — plan ~3-4 weeks tenant-placement turnaround); 2,473 units permitted in Bay County in 2024 (559 in 5+ unit buildings).
- This rent runs 43% of the median local income ($75k/yr) — at the standard rent-burdened threshold; future hikes will face affordability resistance.
Forward outlook
- Local home prices are declining (-3.0%/yr); year-one equity from $2k of loan paydown is wiped out by about $8k of value loss. Plan a longer hold.
- Bay County population projected at +24% by 2050 — long-run rental-demand tailwind backs the buy-and-hold thesis.
Negotiation context
- It's been on market 189 days — a 12% lower offer ($220k) is reasonable based on typical stale-listing flexibility.
- 2 sale attempts since 7y ago with the ask held roughly flat each time — persistent listings suggest the price (not the market) is what's stuck; bring a comps-based counter.
- Current owner paid $180k; 39% above their basis — modest negotiation headroom, anchor on the comps not their cost.
Risks & watch-outs
- Climate carrying-cost: severe wind risk, 99% chance of damaging wind over 30y; moderate wildfire risk; extreme-heat days projected 7→21/yr by 2055 (HVAC capex compounding) — expect insurance premiums to compound above CPI over the hold.
Questions for the listing agent
- It's been on market 189 days. Have you received any prior offers? Is the seller open to a 12% concession, seller financing, or rate buy-down credit?
- Can we see the unit-by-unit rent roll, current vacancy, and any below-market leases? What's the average tenancy length?
- What capital expenditures (roof, boiler, parking lot, exteriors) have been made in the last 5 years, and what's planned in the next 2?
- Built in 1964 — when were the roof, HVAC, electrical panel, plumbing, and water heater last replaced?
- Why hasn't it sold? Are there any deal-killer items the seller is aware of (foundation, flood, title, zoning, code violations)?
- Is there a deadline driving the sale (1031 exchange, divorce, estate, relocation)? That informs how much negotiation room exists.
- Schools are F-rated, which usually means shorter tenancies and higher turnover. Who's the typical renter profile here, and what's been the actual vacancy rate?
- What's the average days-on-market for RENTAL listings here right now (not sales)? A rising rental-DOM trend means longer vacancies and softer asking-rent achievability than the comps imply.
- What's the recent tenant-quality profile in this submarket — average credit score on applications, eviction rate, late-payment / NSF rate, and stable-employment percentage? A property-management company in the area should have these aggregated.
- How much new apartment / multifamily construction is in the pipeline within 1–3 miles? Heavy new supply (>2% of stock underway) typically softens rents 12–24 months out; light construction supports rent growth.
Investment metrics
- 1% rule
- 1.06% ✓
- Cap rate
- 9.01%
- Cash-on-cash
- 9.71%
- DSCR
- 1.43
- GRM
- 7.8
CMA / ARV
- ARV (median comp)
- $186,301
- List price
- $250,000
- Delta
- 34.19%
- Verdict
- OVERPRICED
- Comps
- 8 within 1.0 mi
Projected returns pro-forma
-3.0% appreciation · 1.12% rent growth · sell at horizon
- IRR
- -3.7%
- Equity multiple
- 0.86×
- Total profit
- $-9,466
- Equity at exit
- $37,276
- IRR
- 3.9%
- Equity multiple
- 1.26×
- Total profit
- $18,352
- Equity at exit
- $21,615
Cash invested: $70,000 (down + closing). Projections, not guarantees.
Landlord ↔ Tenant lean methodology
- Overall (STATE)
- 87 Strongly Landlord-Friendly
- State Florida
- 87 Strongly Landlord-Friendly · R+3
- County
- — inherits STATE
- City
- — inherits STATE
ZIP-level market 32404
- Home prices YoY
- -16.1%
- Rents YoY
- 1.1%
- Active inventory
- 969
- Price-to-rent
- 15.7×
Monthly cashflow live
- Estimated rent
- $2,662 high interval (Pro) →
- Mortgage (P&I)
- −$1,311
- Tax from tax record
- −$122 /mo · $1,458/yr
- Insurance
- −$104
- HOA
- −$0
- Vacancy / Maint / Mgmt
- −$559
- Net cashflow
- $566
Break-even live
2-unit breakdown (identical units grouped — click to expand)
| Units | Beds | Baths | Est. rent |
|---|---|---|---|
| 2× units | 2 | 1 | $2,662 |
| #1 | 2 | 1 | $1,331 |
| #2 | 2 | 1 | $1,331 |
| Total (2 units) | $2,662 | ||
UW: 25.0% down · 7.5% · 30yr · 1.5% tax · 5.0% vac · 8.0% maint · 8.0% mgmt
Financing live
Cash to close
- Down payment
- $62,500
- Closing costs
- $7,500
- Reserves months
- —
- Total cash needed
- —
Loan-product check · same deal, 3 products live
Conventional
25% down · 7.5% · 30yr
- Down + closing
- —
- Monthly P&I
- —
- Monthly cashflow
- —
- DSCR
- —
- Eligible?
- —
Personal DTI + credit; lowest rate.
DSCR
20% down · 8.5% · 30yr
- Down + closing
- —
- Monthly P&I
- —
- Monthly cashflow
- —
- DSCR
- —
- Eligible?
- —
No personal income docs; deal must DSCR.
Hard money
10% down · 12.0% · 12mo
- Down + closing
- —
- Monthly P&I
- —
- Monthly cashflow
- —
- DSCR
- —
- Eligible?
- —
Short-term bridge; refi at stabilization.
Rent comps 24 comps
| Address | Beds | Baths | Sqft | Rent | $/sqft | DOM | Units | Dist |
|---|---|---|---|---|---|---|---|---|
| 114 S Kimbrel Ave Panama City, FL | 3.0 | 2.0 | 1400 | $1,850 | $1.32 | 21d | 1 | 0.15mi |
| 6328 Olokee St Panama City, FL | 3.0 | 2.0 | 1131 | $1,850 | $1.64 | 13d | 1 | 0.31mi |
| 163 Lauren Ln Panama City, FL | 4.0 | 2.0 | 1731 | $2,300 | $1.33 | 21d | 1 | 0.46mi |
| 229 Callaway Chase Ln Panama City, FL | 3.0 | 2.5 | 1200 | $1,650 | $1.38 | 13d | 1 | 0.47mi |
| 175 N Berthe Ave Panama City, FL | 4.0 | 2.0 | 1498 | $2,195 | $1.47 | 13d | 1 | 0.53mi |
| 5813 Hickory St Panama City, FL | 3.0 | 2.0 | 1200 | $1,950 | $1.62 | 21d | 1 | 0.58mi |
| 116 Christie Ln Panama City, FL | 3.0 | 2.0 | 1092 | $1,550 | $1.42 | 21d | 1 | 0.61mi |
| 5817 Jasmine Ct Panama City, FL | 4.0 | 2.5 | 1633 | $2,000 | $1.22 | 13d | 1 | 0.64mi |
| 129 Seneca Ave Panama City, FL | 3.0 | 2.0 | 1449 | $1,495 | $1.03 | 13d | 1 | 0.76mi |
| 420 Raven Ln Panama City, FL | 3.0 | 2.0 | 1251 | $1,750 | $1.40 | 21d | 1 | 0.76mi |
| 509 Phillips Ct Panama City, FL | 3.0 | 2.0 | 1411 | $1,700 | $1.20 | 13d | 1 | 0.85mi |
| 208 North Highway 22 A Unit 33 Panama City, FL | 3.0 | 2.0 | 1080 | $1,350 | $1.25 | 21d | 1 | 0.96mi |
| 5101 Willow St Panama City, FL | 3.0 | 2.0 | 1099 | $1,500 | $1.36 | 13d | 1 | 0.98mi |
| 526 Camellia Ave Panama City, FL | 3.0 | 2.0 | 1375 | $1,950 | $1.42 | 21d | 1 | 1.00mi |
| 907 Lee Ct Panama City, FL | 3.0 | 3.0 | 2126 | $2,100 | $0.99 | 21d | 1 | 1.11mi |
| 263 Nelle Ave Panama City, FL | 3.0 | 2.0 | 1294 | $1,690 | $1.31 | 21d | 1 | 1.25mi |
| 7727 Betty Louise Dr Panama City, FL | 3.0 | 2.0 | 1430 | $1,950 | $1.36 | 21d | 1 | 1.30mi |
| 7709 Betty Louise Dr Panama City, FL | 3.0 | 2.0 | 1310 | $1,800 | $1.37 | 21d | 1 | 1.35mi |
| 211 Sukoshi Dr Panama City, FL | 3.0 | 2.0 | 1512 | $1,900 | $1.26 | 21d | 1 | 1.37mi |
| 1128 S Gay Ave Lot 86 Panama City, FL | 3.0 | 2.0 | 1216 | $94,995 | $78.12 | 21d | 1 | 1.45mi |
| 1128 S Gay Ave Lot 146 Panama City, FL | 3.0 | 2.0 | 1536 | $20,000 | $13.02 | 21d | 1 | 1.45mi |
| 1128 S Gay Ave Lot V Panama City, FL | 3.0 | 2.0 | 1152 | $30,000 | $26.04 | 21d | 1 | 1.45mi |
| 1128 S Gay Ave Lot 56 Panama City, FL | 3.0 | 1.5 | 1216 | $35,000 | $28.78 | 21d | 1 | 1.45mi |
| 133 Red Bay Rd Panama City, FL | 4.0 | 2.0 | 2208 | $2,500 | $1.13 | 21d | 1 | 1.47mi |
Listing history 6 events
-
2025-11-19$250,000 Active 400-char remark
Show marketing remark (400 chars)
Enough Room to Add more units! Duplex for sale that previously rented at total $800/week ($3200/month). Week to week leases. Owner paid all utilities and provided storage. The mobile home on the property is not live able and was repurposed for storage only. The land is 1/2 Acre zoned for more units per City of Callaway for mobile homes. Prior to Hurricane Michael multiple mobiles were on property.
-
2021-12-09historical
-
2019-12-14$250,000
-
2007-05-10soldstatus $180,100
-
1998-07-01soldstatus $69,000
-
1995-11-01soldstatus $59,000
ⓘ Source: listings_history table (triggers on properties + properties_extension) + one-shot
backfill from property_details.listing_events for pre-trigger history.
Tax reassessment forecast FL · Resets to sale price
- Current annual tax
- $1,458 · $122/mo
- Projected year-2 tax
- $2,075 · $173/mo
- Expected delta
- +$617/yr (+$51/mo · 42.3%)
ⓘ Screening estimate from a state-policy table — verify with the county assessor before closing.
Climate risk First Street
- Flood 1/10 Low FEMA zone X (unshaded) · 0% chance over 30 yrs
- Wildfire 5/10 Major
- Heat 10/10 Extreme 7 d/yr ≥104°F today · 21 d/yr by 30 yrs out
- Wind 9/10 Extreme 99% chance of damaging wind over 30 yrs
- Air quality 1/10 Low 0 unhealthy d/yr today · 0 by 30 yrs out
Nearby sold comps map
Loading sold comps map…
Walkable amenities ~0.75 mi
Loading nearby amenities…
Taxation est. · year 1
- Rental income
- $31,944
- − Mortgage interest
- −$14,004
- − Property taxes
- −$1,458
- − Insurance
- −$1,250
- − Repairs & maintenance
- −$2,556
- − Management
- −$2,556
- − Depreciation
- −$7,273
- Taxable income
- $2,848
- Est. tax owed @ 24.0%
- −$684
- After-tax cash flow
- $6,112/yr
For passive investors: Depreciation is non-cash, so a rental often shows a tax loss while cash-flowing — sheltering income. Rental losses are passive: they offset passive income freely, and up to $25,000/yr can offset ordinary (W-2) income if you actively participate and your MAGI is under $100k (phasing out to $0 by $150k); unused losses carry forward. On sale, claimed depreciation is recaptured at up to 25%, and gains may owe capital-gains tax (a 1031 exchange can defer both). Figures are a year-1 estimate at your 24.0% rate — not tax advice; consult a CPA.
Schools (NCES district)
- District
- Bay
- NCES district ID
- 1200090
- Math proficiency
- 51% ▼ -8.00%
- Reading proficiency
- 51% ▼ -7.00%
- Median HH income
- $47,740
- Composite
- 43.41/100
- National rank
- #3014
- State rank
- #29 of 73 in FL
Livability — Callaway
- Score
- 64/100
- State rank
- #690
- US rank
- #14384
Category grades
Schools grade is shown separately in the Schools card above.
Census & demographics
- Census place
- Callaway, FL
- County
- Bay County · 163,593 people
- Metro
- Panama City, FL
- Population (ZIP)
- 42,514
- Household income
- $74,708
- Rent vs Own
- Severe rent burden
- 1218.0
Population outlook (Bay County) Hauer SSP2
- Today (2025)
- 206,264 people
- By 2030
- 217,740 · +5.6%
- By 2040
- 238,738 · +15.7%
- By 2050
- 255,545 · +23.9%
- By 2075
- 288,295 · +39.8%
- By 2100
- 288,638 · +39.9%
Race, ethnicity, and origin ACS 2023
- Neighborhood character
- Predominantly White (69%)
- Race & ethnicity
- White 69% Black 12% Two or more races 10% Hispanic / Latino 9% Asian 3%
- Hispanic origin (detail)
- Mexican 2% Puerto Rican 3%
- Common ancestry
- Lithuanian 3% Slovak 2% Italian 2%
- Foreign-born
- 7% · Canada, Vietnam, Mexico
- Languages at home
- 90% English-only · Spanish 6% Vietnamese 1% Other Asian/Pacific 1%
Political lean MEDSL · Bay
- 2024 margin
- Solid R (+47.4) · D 25.8% · R 73.1% · Other 1.1%
- 2008→2024 swing
- -6.6pp toward R · 2008: -40.7pp · 2024: -47.4pp
- All cycles
- 2024: R+47.4 2020: R+43.5 2016: R+46.3 2012: R+43.6 2008: R+40.7
Not yet ingested
- Civics
- —
Market trends
- HPI YoY
- ▼ -50.59%
- Current HPI
- 263.7178
- Rent YoY
- ▲ 1.12%
- Metro
- Panama City, FL
- State GDP YoY
- ▲ 3.28%
- F500 in state
- 36
Industry mix (Fortune 500 HQ in FL)
| Industry | F500 HQs | Revenue |
|---|---|---|
| Industrial Technology | 2 | $29B |
|
||
| Insurance | 2 | $17B |
|
||
| Retail | 1 | $60B |
|
||
| Technology Distribution | 1 | $58B |
|
||
| Homebuilding | 1 | $35B |
|
||
| Technology Manufacturing | 1 | $35B |
|
||
Price history
+323.7% since first listed6 events — show timeline
- 2025-11-19 Listed $250,000 CPARMLS
- 2021-12-09 Listing Removed — CPARMLS
- 2019-12-14 Listed $250,000 CPARMLS
- 2007-05-10 Sold (Public Records) $180,100 Public Records
- 1998-07-01 Sold (Public Records) $69,000 Public Records
- 1995-11-01 Sold (Public Records) $59,000 Public Records
Property tax history
-0.7%/yrLatest (2025): $1,458 · +10.2% YoY. Source: county tax records.
Cash-flow waterfall
monthlySold comps — $/sqft
last 12 mo · ≤1 miLoading sold comps…