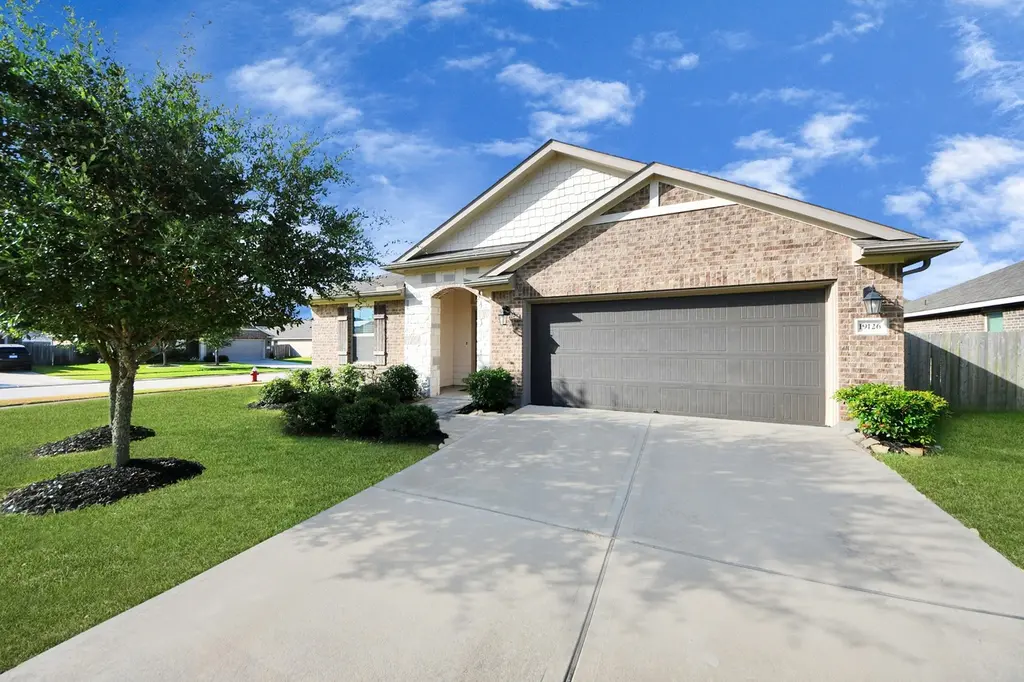
19126 Hidden Arbor Dr · Manvel, TX
Flood risk 3/10 · Minor
- FEMA flood zone
- X (unshaded)
- Chance of flooding over 30 yrs
- 0.18%
- Est. flood insurance / yr
- $507 – $1,088
Fire risk 7/10 · Major
- Est. fire insurance / yr
- $1,222 – $2,270
Heat risk 9/10 · Severe
- Hot days now (above 109°F)
- 7 days/yr
- Hot days in 30 yrs
- 24 days/yr
Wind risk 9/10 · Severe
- Chance of severe wind over 30 yrs
- 99.0%
Air-quality risk 2/10 · Minimal
- Unhealthy air days now
- 1 days/yr
- Unhealthy air days in 30 yrs
- 2 days/yr
Risk factors via First Street. Map © Google.
Why this score? — see what drove the D- grade
The composite is a weighted blend of 9 inputs, each scored 0–100. Each bar is that input's sub-score; the figure is the points it added to the 100-point composite (weight × sub-score).
- ARV discount +14.8/15.0
- Cash flow +7.1/30.0
- Schools +3.9/10.0
- Livability +3.4/5.0
- Rent growth +3.2/5.0
- 1% rule +2.7/10.0
- Condition / age +2.5/5.0
- DSCR +1.3/10.0
- Appreciation +0.0/10.0
$310,000
🖨 Deal sheet 📄 Offer letter ✓ Due diligence
Listing remarks MLS
Beautiful open concept floor plan in a spacious corner lot. Located in the heart of Manvel, TX. Neighborhood offers a massive view to a lake with plenty of trails throughout. The home front door opens to a wide, high ceiling foyer which leads into an open kitchen concept with an island facing the living room. Fresh paint through out the home. The gorgeous home is detailed with wide baseboards, white kitchen cabinets and a detailed back splash. The spacious backyard with a cover patio offers plenty of space for great evenings with family and friends. This home is located minutes from restaurants, shopping strip and quick access to Hwy 288.
Key facts
- High ceiling foyer
- Open kitchen concept
- Corner lot
Tags
Neighborhood map
What this means for you Summary
Snapshot
- This is a 4-bed/2.0-bath single-family listed at $310k.
Deal economics
- At list price, monthly cash flow is $-435 ($-5k/yr) — negative.
- To cash-flow at today's rent, offer at most $233k (24.8% below list).
- To meet the 1% rule (rent ≥ 1% of price), the offer needs to be $240k (22.6% below list).
- Recommended offer: $233k (24.8% below list) — sets the bar for cash-flow.
- Cap rate 4.6% vs local median 2.2% in Manvel — top-decile yield for the area; either an underpriced asset or a hidden risk that comps aren't pricing in. Stress-test before assuming the spread holds.
Location & tenants
- Location reads 67/100 on livability (#544 in TX) — a middle-class / working-renter tenant base. Strengths: crime A+, employment A+, housing A+; Watch: schools C-, amenities F, commute F.
- Alvin ISD (suburban): math 39% / reading 48% proficiency, ranked #255 of 826 in TX (top 31%) — families likely to look elsewhere, expect single-tenant / working-renter base with shorter leases.
- Market conditions: Rents rising (+2.8%/yr); 1243 active listings in the ZIP; high-income renter base; 3,960 units permitted in Brazoria County in 2024 (593 in 5+ unit buildings).
Forward outlook
- Local home prices are declining (-3.0%/yr); year-one equity from $2k of loan paydown is wiped out by about $9k of value loss. Plan a longer hold.
- Brazoria County population projected at +44% by 2050 — long-run rental-demand tailwind backs the buy-and-hold thesis.
Negotiation context
- It's been on market 151 days — a 12% lower offer ($273k) is reasonable based on typical stale-listing flexibility.
- 2 sale attempts; this cycle's ask has dropped $19k (6%) from the opening price — seller is motivated, your offer sets the floor, not the list.
Risks & watch-outs
- Climate carrying-cost: severe wind risk, 99% chance of damaging wind over 30y; major wildfire risk; extreme-heat days projected 7→24/yr by 2055 (HVAC capex compounding) — expect insurance premiums to compound above CPI over the hold.
Questions for the listing agent
- What do current leases actually rent for vs. the listed asking? Can we see a recent rent roll and the last 12 months of T-12 income?
- It's been on market 151 days. Have you received any prior offers? Is the seller open to a 25% concession, seller financing, or rate buy-down credit?
- What does the HOA fee cover, when was the last increase, and are there any pending special assessments or reserve-fund shortfalls?
- Why hasn't it sold? Are there any deal-killer items the seller is aware of (foundation, flood, title, zoning, code violations)?
- Is there a deadline driving the sale (1031 exchange, divorce, estate, relocation)? That informs how much negotiation room exists.
- The area grade is low — what's the realistic commute time and amenity access for the typical tenant pool here? Any planned neighborhood developments (good or bad) we should know about?
- What's the average days-on-market for RENTAL listings here right now (not sales)? A rising rental-DOM trend means longer vacancies and softer asking-rent achievability than the comps imply.
- What's the recent tenant-quality profile in this submarket — average credit score on applications, eviction rate, late-payment / NSF rate, and stable-employment percentage? A property-management company in the area should have these aggregated.
- How much new for-sale + rental construction is in the pipeline within 1–3 miles? Heavy new supply typically softens prices + rents 12–24 months out; constrained supply supports both.
Investment metrics
- 1% rule
- 0.77% ✗
- Cap rate
- 4.61%
- Cash-on-cash
- -6.01%
- DSCR
- 0.73
- GRM
- 10.8
CMA / ARV
- ARV (median comp)
- $369,859
- List price
- $310,000
- Delta
- -16.18%
- Verdict
- UNDERPRICED
- Comps
- 20 within 1.0 mi
Show comp detail 12 sales within ~0.75 mi
| Address | Dist | Beds/Ba | Sqft | Sold | Price | $/sf | Match |
|---|---|---|---|---|---|---|---|
| 7330 Water Glen Ln | 0.09mi | 3/2.0 (-1) | 2,042 (+2%) | 1mo | $339,900 | $166 | 88 |
| 19102 Shoreside Ter | 0.10mi | 3/2.0 (-1) | 2,205 (+10%) | 1mo | $450,000 | $204 | 74 |
| 6710 Canyon Trl | 0.32mi | 3/2.0 (-1) | 1,949 (-3%) | 11mo | $347,925 | $179 | 66 |
| 6514 Palo Duro Dr | 0.26mi | 4/2.0 | 2,170 (+8%) | 11mo | $349,990 | $161 | 65 |
| 18815 Brookside Ridge Ln | 0.32mi | 4/2.0 | 1,759 (-12%) | 1mo | $314,500 | $179 | 63 |
| 18818 Lake Ridge Dr | 0.19mi | 3/2.0 (-1) | 2,205 (+10%) | 9mo | $379,000 | $172 | 62 |
| 6518 Granbury Rd | 0.38mi | 3/2.0 (-1) | 2,125 (+6%) | 9mo | $375,000 | $176 | 60 |
| 18619 Citrange Bend Way | 0.52mi | 4/2.0 | 2,176 (+8%) | 8mo | $389,990 | $179 | 56 |
| 6807 Davy Crockett Dr | 0.62mi | 3/2.0 (-1) | 2,125 (+6%) | 2mo | $375,000 | $176 | 55 |
| 6830 Davy Crockett Dr | 0.67mi | 3/2.0 (-1) | 1,949 (-3%) | 11mo | $340,000 | $174 | 49 |
| 6722 Hawkins St | 0.72mi | 4/2.0 | 2,125 (+6%) | 11mo | $399,500 | $188 | 48 |
| 6714 Hawkins St | 0.69mi | 3/2.5 (-1) | 2,276 (+13%) | 1mo | $399,000 | $175 | 38 |
Match score weights: distance 35% · size 25% · config 20% · recency 20%. Top-matched comps best support the ARV.
Projected returns pro-forma
-3.0% appreciation · 2.77% rent growth · sell at horizon
- IRR
- -26.8%
- Equity multiple
- 0.10×
- Total profit
- $-78,346
- Equity at exit
- $46,222
- IRR
- -25.0%
- Equity multiple
- -0.22×
- Total profit
- $-105,548
- Equity at exit
- $26,803
Cash invested: $86,800 (down + closing). Projections, not guarantees.
Landlord ↔ Tenant lean methodology
- Overall (STATE)
- 87 Strongly Landlord-Friendly
- State Texas
- 87 Strongly Landlord-Friendly · R+5
- County
- — inherits STATE
- City
- — inherits STATE
ZIP-level market 77578
- Rents YoY
- 2.8%
- Active inventory
- 1243
- Price-to-rent
- 10.8×
Monthly cashflow live
- Estimated rent
- $2,400 medium interval (Pro) →
- Mortgage (P&I)
- −$1,626
- Tax from tax record
- −$496 /mo · $5,947/yr
- Insurance
- −$129
- HOA
- −$81
- Vacancy / Maint / Mgmt
- −$504
- Net cashflow
- $-435
Break-even live
UW: 25.0% down · 7.5% · 30yr · 1.5% tax · 5.0% vac · 8.0% maint · 8.0% mgmt
Financing live
Cash to close
- Down payment
- $77,500
- Closing costs
- $9,300
- Reserves months
- —
- Total cash needed
- —
Loan-product check · same deal, 3 products live
Conventional
25% down · 7.5% · 30yr
- Down + closing
- —
- Monthly P&I
- —
- Monthly cashflow
- —
- DSCR
- —
- Eligible?
- —
Personal DTI + credit; lowest rate.
DSCR
20% down · 8.5% · 30yr
- Down + closing
- —
- Monthly P&I
- —
- Monthly cashflow
- —
- DSCR
- —
- Eligible?
- —
No personal income docs; deal must DSCR.
Hard money
10% down · 12.0% · 12mo
- Down + closing
- —
- Monthly P&I
- —
- Monthly cashflow
- —
- DSCR
- —
- Eligible?
- —
Short-term bridge; refi at stabilization.
HOA detail
- Monthly dues
- $81 · $972/yr
Listing history 5 events
-
2026-04-30price $310,000 646-char remark
Show marketing remark (646 chars)
Beautiful open concept floor plan in a spacious corner lot. Located in the heart of Manvel, TX. Neighborhood offers a massive view to a lake with plenty of trails throughout. The home front door opens to a wide, high ceiling foyer which leads into an open kitchen concept with an island facing the living room. Fresh paint through out the home. The gorgeous home is detailed with wide baseboards, white kitchen cabinets and a detailed back splash. The spacious backyard with a cover patio offers plenty of space for great evenings with family and friends. This home is located minutes from restaurants, shopping strip and quick access to Hwy 288.
-
2025-12-29$329,000 Active 646-char remark
Show marketing remark (646 chars)
Beautiful open concept floor plan in a spacious corner lot. Located in the heart of Manvel, TX. Neighborhood offers a massive view to a lake with plenty of trails throughout. The home front door opens to a wide, high ceiling foyer which leads into an open kitchen concept with an island facing the living room. Fresh paint through out the home. The gorgeous home is detailed with wide baseboards, white kitchen cabinets and a detailed back splash. The spacious backyard with a cover patio offers plenty of space for great evenings with family and friends. This home is located minutes from restaurants, shopping strip and quick access to Hwy 288.
-
2025-12-05historical
-
2025-09-17price $359,000
-
2025-08-02$379,000 Active
ⓘ Source: listings_history table (triggers on properties + properties_extension) + one-shot
backfill from property_details.listing_events for pre-trigger history.
Tax reassessment forecast TX · Resets to sale price
- Current annual tax
- $5,947 · $496/mo
- Projected year-2 tax
- $5,947 · $496/mo
- Expected delta
- $0/yr ($0/mo · 0.0%)
ⓘ Screening estimate from a state-policy table — verify with the county assessor before closing.
Climate risk First Street
- Flood 3/10 Moderate FEMA zone X (unshaded) · 18% chance over 30 yrs
- Wildfire 7/10 Severe
- Heat 9/10 Extreme 7 d/yr ≥109°F today · 24 d/yr by 30 yrs out
- Wind 9/10 Extreme 99% chance of damaging wind over 30 yrs
- Air quality 2/10 Low 1 unhealthy d/yr today · 2 by 30 yrs out
Nearby sold comps map
Loading sold comps map…
Walkable amenities ~0.75 mi
Loading nearby amenities…
Taxation est. · year 1
- Rental income
- $28,805
- − Mortgage interest
- −$17,365
- − Property taxes
- −$5,947
- − Insurance
- −$1,550
- − Repairs & maintenance
- −$2,304
- − Management
- −$2,304
- − HOA
- −$972
- − Depreciation
- −$9,018
- Taxable loss
- −$10,656
- Est. tax savings @ 24.0%
- +$2,557
- After-tax cash flow
- $-2,664/yr
For passive investors: Depreciation is non-cash, so a rental often shows a tax loss while cash-flowing — sheltering income. Rental losses are passive: they offset passive income freely, and up to $25,000/yr can offset ordinary (W-2) income if you actively participate and your MAGI is under $100k (phasing out to $0 by $150k); unused losses carry forward. On sale, claimed depreciation is recaptured at up to 25%, and gains may owe capital-gains tax (a 1031 exchange can defer both). Figures are a year-1 estimate at your 24.0% rate — not tax advice; consult a CPA.
Schools (NCES district)
- District
- Alvin ISD
- NCES district ID
- 4808090
- Math proficiency
- 39% ▼ -11.00%
- Reading proficiency
- 48% ▬ 0.00%
- Median HH income
- $66,740
- Composite
- 38.96/100
- National rank
- #4080
- State rank
- #255 of 826 in TX
Livability — Manvel
- Score
- 67/100
- State rank
- #544
- US rank
- #10576
Category grades
Schools grade is shown separately in the Schools card above.
Census & demographics
- Census place
- Manvel, TX
- County
- Brazoria County · 374,982 people
- City population
- 30,210
- Metro
- Houston-The Woodlands-Sugar Land, TX
- Population (ZIP)
- 30,210
- Household income
- $134,016
- Rent vs Own
- Severe rent burden
- 93.0
Population outlook (Brazoria County) Hauer SSP2
- Today (2025)
- 420,414 people
- By 2030
- 457,585 · +8.8%
- By 2040
- 532,232 · +26.6%
- By 2050
- 605,399 · +44.0%
- By 2075
- 779,358 · +85.4%
- By 2100
- 883,759 · +110.2%
Race, ethnicity, and origin ACS 2023
- Neighborhood character
- Highly diverse neighborhood (Simpson 0.73)
- Race & ethnicity
- White 36% Black 30% Hispanic / Latino 22% Two or more races 15% Asian 9%
- Hispanic origin (detail)
- Mexican 18%
- Common ancestry
- Norwegian 2% Subsaharan African 2% Scotch-Irish 1%
- Foreign-born
- 15% · Canada, China, Vietnam
- Languages at home
- 78% English-only · Spanish 13% Tagalog/Filipino 2% Vietnamese 2%
Political lean MEDSL · Brazoria
- 2024 margin
- R (+19.7) · D 39.5% · R 59.2% · Other 1.3%
- 2008→2024 swing
- +9.9pp toward D · 2008: -29.6pp · 2024: -19.7pp
- All cycles
- 2024: R+19.7 2020: R+18.2 2016: R+24.6 2012: R+34.2 2008: R+29.6
Not yet ingested
- Civics
- —
Market trends
- HPI YoY
- ▼ -154.15%
- Current HPI
- 218.4264
- Rent YoY
- ▲ 2.77%
- Metro
- Houston-The Woodlands-Sugar Land, TX
- State GDP YoY
- ▲ 3.95%
- F500 in state
- 110
Industry mix (Fortune 500 HQ in TX)
| Industry | F500 HQs | Revenue |
|---|---|---|
| Energy | 16 | $1,198B |
|
||
| Technology | 5 | $198B |
|
||
| Engineering / Construction | 4 | $72B |
|
||
| Energy Services | 3 | $60B |
|
||
| Utilities | 3 | $41B |
|
||
| Healthcare | 2 | $330B |
|
||
Price history
-18.2% since first listed5 events — show timeline
- 2026-04-30 Price Changed $310,000 HARMLS
- 2025-12-29 Listed $329,000 HARMLS
- 2025-12-05 Listing Removed — HARMLS
- 2025-09-17 Price Changed $359,000 HARMLS
- 2025-08-02 Listed $379,000 HARMLS
Property tax history
+42.3%/yrLatest (2025): $5,947 · -1.4% YoY. Source: county tax records.
Cash-flow waterfall
monthlySold comps — $/sqft
last 12 mo · ≤1 miLoading sold comps…