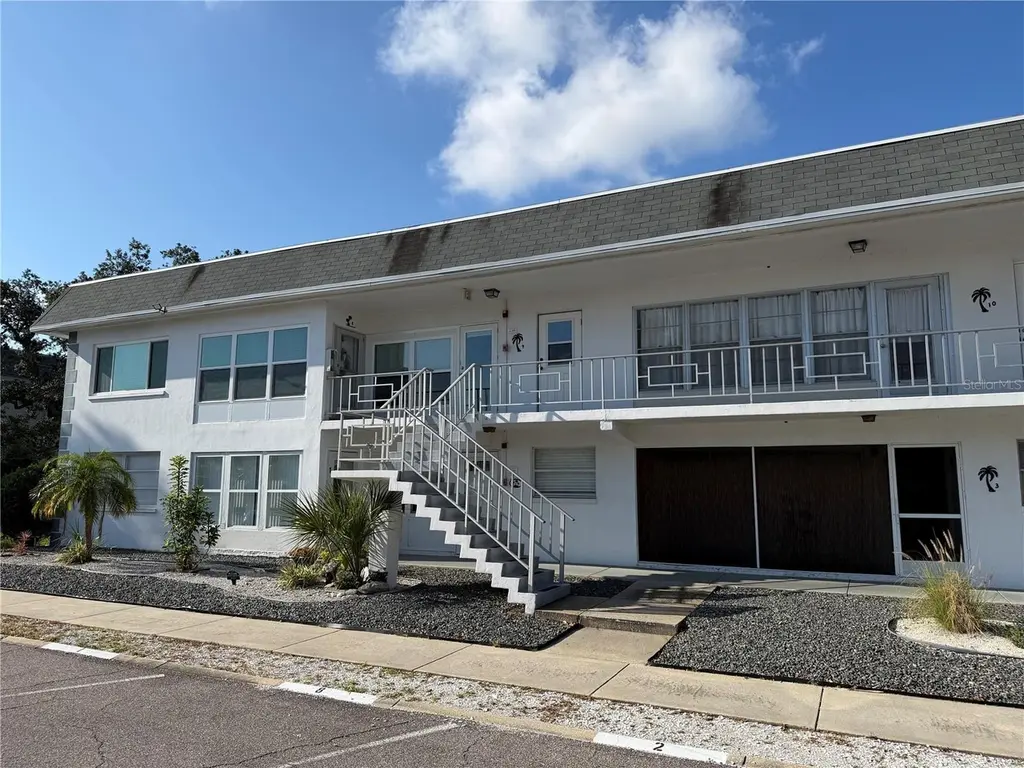
1221 Drew St Unit D9 · Clearwater, FL
Flood risk 1/10 · Minimal
- FEMA flood zone
- X (unshaded)
- Chance of flooding over 30 yrs
- 0.0%
- Est. flood insurance / yr
- $507 – $1,088
Fire risk 1/10 · Minimal
- Est. fire insurance / yr
- $947 – $1,759
Heat risk 10/10 · Severe
- Hot days now (above 107°F)
- 7 days/yr
- Hot days in 30 yrs
- 27 days/yr
Wind risk 10/10 · Severe
- Chance of severe wind over 30 yrs
- 99.0%
Air-quality risk 3/10 · Minor
- Unhealthy air days now
- 2 days/yr
- Unhealthy air days in 30 yrs
- 3 days/yr
Risk factors via First Street. Map © Google.
Why this score? — see what drove the C- grade
The composite is a weighted blend of 9 inputs, each scored 0–100. Each bar is that input's sub-score; the figure is the points it added to the 100-point composite (weight × sub-score).
- Cash flow +18.6/30.0
- 1% rule +10.0/10.0
- ARV discount +7.5/15.0
- DSCR +5.9/10.0
- Schools +4.3/10.0
- Livability +4.1/5.0
- Condition / age +2.5/5.0
- Rent growth +2.0/5.0
- Appreciation +0.0/10.0
$89,000
🖨 Deal sheet 📄 Offer letter ✓ Due diligence
Listing remarks
Enjoy easy Florida living in this charming 2nd-floor condo located within a quiet 55+ Clearwater community. Situated outside of a flood zone, this residence offers peace of mind and a convenient location close to beaches, healthcare, shopping, and transportation. Inside, you'll find a bright interior featuring updated flooring, neutral finishes, and a newer air conditioning system. The spacious primary bedroom offers excellent closet space, including a large walk-in closet and updated impact-rated windows. Whether you're looking for a year-round residence or a seasonal escape, this move-in-ready condo presents an excellent opportunity to enjoy comfort, convenience, and value in a desirable
Key facts
- Updated flooring
- Large walk-in closet
- $439 HOA
Tags
Property features AI
Finance
- Other: Unfurnished unit
- Financial info: Total monthly fees: $439; Total annual fees: $5,268; Lease restrictions apply
- HOA & community: Monthly association fee of $439 covering structure and grounds maintenance, sewer, trash and water; HOA requires approval; Association provides laundry amenity; Association name: Jessica Byrnes; Buyer approval required; Senior community; No pets allowed
Exterior
- Parking: Guest parking available; Reserved parking
- Utilities: Electricity connected; Public water connected; Public sewer connected; Sewer connected; Water connected
- Home design: Condominium; Residential property; Second-floor unit; Faces north; Two-story building
- Construction: Stucco exterior; Shingle roof; Block foundation; Built as part of Building D
- Exterior features: Balcony; Asphalt road access; Road maintenance agreement
Interior
- Kitchen: Range; Refrigerator; Electric water heater
- Bedrooms: 1 bedroom
- Flooring: Tile
- Bathrooms: 1 full bathroom
- Heating & cooling: Central heating; Ductless heating; Central air conditioning; Wall/window air conditioning unit(s)
- Interior features: Ceiling fans
- Laundry & utility: Common area laundry
Neighborhood map
What this means for you Summary
Snapshot
- This is a 1-bed/1.0-bath condo listed at $89k.
Deal economics
- At list price, monthly cash flow is $87 ($1k/yr) — positive.
- The deal already cash-flows at list — no discount required.
- Meets the 1% rule at list price ($1k rent vs $89k).
- Cap rate 7.5% vs local median 2.9% in Clearwater — top-decile yield for the area; either an underpriced asset or a hidden risk that comps aren't pricing in. Stress-test before assuming the spread holds.
Location & tenants
- Location reads 82/100 on livability (#60 in FL, #988 nationally) — a professional / high-income tenant draw. Strengths: commute A+, housing A+, health & safety A+; Watch: schools C-, employment C-.
- Pinellas (suburban): math 51% / reading 51% proficiency, ranked #31 of 73 in FL (top 42%) — acceptable for families but not a draw, mixed tenant base, ~2y average lease.
- Market conditions: Rents soft (-2.2%/yr); 261 active listings in the ZIP; 40 comparable units currently listed for rent nearby; rentals at typical pace (median 18d on market — plan ~3-4 weeks tenant-placement turnaround); 2,676 units permitted in Pinellas County in 2024 (1,422 in 5+ unit buildings).
Forward outlook
- Local home prices are declining (-3.0%/yr); year-one equity from $615 of loan paydown is wiped out by about $3k of value loss. Plan a longer hold.
- Pinellas County population projected at +14% by 2050 — modest demand growth; plan on rents tracking national, not racing it.
Negotiation context
- Only 7 days on market — expect competitive offers; lowballing is unlikely to land.
- 3 sale attempts since 19y ago with the ask held roughly flat each time — persistent listings suggest the price (not the market) is what's stuck; bring a comps-based counter.
Risks & watch-outs
- Watch-outs: HOA is 30% of rent.
- Climate carrying-cost: severe wind risk, 99% chance of damaging wind over 30y; extreme-heat days projected 7→27/yr by 2055 (HVAC capex compounding) — expect insurance premiums to compound above CPI over the hold.
Questions for the listing agent
- Built in 1967 — when were the roof, HVAC, electrical panel, plumbing, and water heater last replaced?
- What does the HOA fee cover, when was the last increase, and are there any pending special assessments or reserve-fund shortfalls?
- Any open or pending special assessments — roof, HVAC, plumbing, elevator, façade? What's the per-unit balance and payoff schedule, and is the seller paying it off at close or rolling it to the buyer?
- Is there a deadline driving the sale (1031 exchange, divorce, estate, relocation)? That informs how much negotiation room exists.
- What's the average days-on-market for RENTAL listings here right now (not sales)? A rising rental-DOM trend means longer vacancies and softer asking-rent achievability than the comps imply.
- What's the recent tenant-quality profile in this submarket — average credit score on applications, eviction rate, late-payment / NSF rate, and stable-employment percentage? A property-management company in the area should have these aggregated.
- How much new apartment / multifamily construction is in the pipeline within 1–3 miles? Heavy new supply (>2% of stock underway) typically softens rents 12–24 months out; light construction supports rent growth.
Investment metrics
- 1% rule
- 1.62% ✓
- Cap rate
- 7.46%
- Cash-on-cash
- 4.17%
- DSCR
- 1.19
- GRM
- 5.1
CMA / ARV
No comps found within radius.
Projected returns pro-forma
-3.0% appreciation · 0.0% rent growth · sell at horizon
- IRR
- -15.1%
- Equity multiple
- 0.48×
- Total profit
- $-12,847
- Equity at exit
- $13,270
- IRR
- -18.6%
- Equity multiple
- 0.23×
- Total profit
- $-19,254
- Equity at exit
- $7,695
Cash invested: $24,920 (down + closing). Projections, not guarantees.
Landlord ↔ Tenant lean methodology
- Overall (STATE)
- 87 Strongly Landlord-Friendly
- State Florida
- 87 Strongly Landlord-Friendly · R+3
- County
- — inherits STATE
- City
- — inherits STATE
ZIP-level market 33755
- Rents YoY
- -2.2%
- Active inventory
- 261
- Price-to-rent
- 5.1×
Monthly cashflow live
- Estimated rent
- $1,444 high interval (Pro) →
- Mortgage (P&I)
- −$467
- Tax est. 1.5%
- −$111 /mo · $1,335/yr
- Insurance
- −$37
- HOA
- −$439
- Vacancy / Maint / Mgmt
- −$303
- Net cashflow
- $87
Break-even live
UW: 25.0% down · 7.5% · 30yr · 1.5% tax · 5.0% vac · 8.0% maint · 8.0% mgmt
Financing live
Cash to close
- Down payment
- $22,250
- Closing costs
- $2,670
- Reserves months
- —
- Total cash needed
- —
Loan-product check · same deal, 3 products live
Conventional
25% down · 7.5% · 30yr
- Down + closing
- —
- Monthly P&I
- —
- Monthly cashflow
- —
- DSCR
- —
- Eligible?
- —
Personal DTI + credit; lowest rate.
DSCR
20% down · 8.5% · 30yr
- Down + closing
- —
- Monthly P&I
- —
- Monthly cashflow
- —
- DSCR
- —
- Eligible?
- —
No personal income docs; deal must DSCR.
Hard money
10% down · 12.0% · 12mo
- Down + closing
- —
- Monthly P&I
- —
- Monthly cashflow
- —
- DSCR
- —
- Eligible?
- —
Short-term bridge; refi at stabilization.
Rent comps 40 comps
| Address | Beds | Baths | Sqft | Rent | $/sqft | DOM | Units | Dist |
|---|---|---|---|---|---|---|---|---|
| 1221 Drew St Unit A21 Clearwater, FL | 2.0 | 1.0 | 705 | $1,300 | $1.84 | 3d | 1 | 0.02mi |
| 1221 Drew St Clearwater, FL | 1.0 | 1.0 | 777 | $1,600 | $2.06 | 22d | 1 | 0.03mi |
| 124 N Jefferson Ave Unit 5 Clearwater, FL | 1.0 | 1.0 | 750 | $1,345 | $1.79 | 24d | 1 | 0.08mi |
| 124 N Jefferson Ave Unit 2 Clearwater, FL | 1.0 | 1.0 | 750 | $1,395 | $1.86 | 24d | 1 | 0.08mi |
| 1233 Grove St Clearwater, FL | 1.0 | 1.0 | 540 | $1,350 | $2.50 | 24d | 1 | 0.10mi |
| 1260 Cleveland St Clearwater, FL | 1.0 | 1.0 | 617 | $1,432 | $2.32 | 3d | 2 | 0.16mi |
| 1278 Jade Pl Unit n/a Clearwater, FL | 1.0 | 1.0 | 500 | $1,350 | $2.70 | 24d | 1 | 0.26mi |
| 1265 Jade Pl Clearwater, FL | 1.0 | 1.0 | 450 | $1,500 | $3.33 | 22d | 1 | 0.26mi |
| 119 N Evergreen Ave Unit 203 Clearwater, FL | 1.0 | 1.0 | 500 | $1,150 | $2.30 | 24d | 1 | 0.34mi |
| 1103 Drew St Clearwater, FL | 1.0 | 1.0 | 580 | $1,250 | $2.16 | 8d | 1 | 0.34mi |
| 135 N Martin Luther King Jr Ave Clearwater, FL | 1.0 | 1.0 | 650 | $1,195 | $1.84 | 18d | 1 | 0.34mi |
| 1100 Cleveland St Clearwater, FL | 1.0–2.0 | 1.0–2.5 | 1168 | $1,785 | $1.53 | 3d | 15 | 0.34mi |
| 949 Cleveland St Clearwater, FL | 1.0–2.0 | 1.0–2.0 | 820 | $1,595 | $1.95 | 2d | 50 | 0.48mi |
| 949 Cleveland St Unit C309 Clearwater, FL | 1.0 | 1.0 | 748 | $2,345 | $3.14 | 14d | 1 | 0.48mi |
| 404 Pennsylvania Ave Clearwater, FL | 1.0 | 1.0 | 748 | $1,275 | $1.70 | 15d | 1 | 0.49mi |
| 906 Jones St Apt A Clearwater, FL | 1.0 | 1.0 | 700 | $1,200 | $1.71 | 8d | 1 | 0.52mi |
| 905 Jones St Clearwater, FL | 2.0 | 1.0 | 660 | $1,700 | $2.58 | 11d | 1 | 0.52mi |
| 27 N San Remo Ave Unit A Clearwater, FL | 2.0 | 1.0 | 625 | $1,297 | $2.08 | 3d | 1 | 0.55mi |
| 1458 Grove St Clearwater, FL | 1.0 | 1.0 | 625 | $1,295 | $2.07 | 22d | 1 | 0.56mi |
| 1463 Drew St Unit B Clearwater, FL | 1.0 | 1.0 | 500 | $1,095 | $2.19 | 24d | 1 | 0.57mi |
| 1458 Cleveland St Clearwater, FL | 1.0 | 1.0 | 750 | $1,300 | $1.73 | 3d | 1 | 0.58mi |
| 1458 Cleveland St Clearwater, FL | 1.0 | 1.0 | 750 | $1,300 | $1.73 | 4d | 1 | 0.58mi |
| 600 S Betty Ln Apt 7 Clearwater, FL | 1.0 | 1.0 | 680 | $1,225 | $1.80 | 24d | 1 | 0.63mi |
| 711 S Lincoln Ave Clearwater, FL | 1.0–2.0 | 1.0 | 860 | $1,274 | $1.48 | 2d | 8 | 0.64mi |
| 1477 Pierce St Clearwater, FL | 2.0 | 1.0 | 650 | $1,575 | $2.42 | 24d | 1 | 0.66mi |
| 612 Sally Ln S Unit 14 Clearwater, FL | 1.0 | 1.0 | 750 | $1,500 | $2.00 | 24d | 1 | 0.68mi |
| 1389 Hibiscus St Unit Guest House Clearwater, FL | — | 1.0 | 400 | $1,295 | $3.24 | 14d | 1 | 0.69mi |
| 801 Chestnut St Clearwater, FL | 1.0 | 1.0 | 433 | $1,460 | $3.37 | 3d | 17 | 0.76mi |
| 912 Pine St Clearwater, FL | 2.0 | 1.0 | 480 | $1,199 | $2.50 | 4d | 1 | 0.79mi |
| 807 Turner St Unit 5 Clearwater, FL | — | 1.0 | 560 | $1,200 | $2.14 | 18d | 1 | 0.82mi |
| 912 Engman St Clearwater, FL | 2.0 | 1.0 | 625 | $1,600 | $2.56 | 24d | 1 | 0.87mi |
| 1109 Grant St Clearwater, FL | 2.0 | 1.0 | 550 | $1,295 | $2.35 | 4d | 1 | 0.89mi |
| 1109 1/2 Grant St Clearwater, FL | 2.0 | 1.0 | 550 | $1,295 | $2.35 | 20d | 1 | 0.89mi |
| 1224 S Missouri Ave #903 Clearwater, FL | 1.0 | 1.0 | 730 | $2,250 | $3.08 | 24d | 1 | 1.01mi |
| 1216 S Missouri Ave Clearwater, FL | 1.0–2.0 | 1.0–2.0 | 835 | $1,500 | $1.80 | 24d | 5 | 1.01mi |
| 1216 S Missouri Ave Clearwater, FL | 1.0–2.0 | 1.0–2.0 | 835 | $1,450 | $1.74 | 2d | 6 | 1.01mi |
| 811 Lotus Path Unit 2 Clearwater, FL | 2.0 | 1.0 | 700 | $1,699 | $2.43 | 24d | 1 | 1.09mi |
| 306 Turner St #1 Clearwater, FL | 1.0 | 1.0 | 600 | $1,275 | $2.12 | 18d | 1 | 1.09mi |
| 1731 Overbrook Ave Clearwater, FL | 2.0 | 1.0 | 702 | $1,245 | $1.77 | 24d | 1 | 1.14mi |
| 1705 Apache Trl Clearwater, FL | 1.0–2.0 | 1.0 | 432 | $1,075 | $2.49 | 2d | 1 | 1.16mi |
HOA detail condo
- Monthly dues
- $439 · $5,268/yr
- Likely covers
- water
- Assessments
- None detected in remarks — confirm with the listing agent.
Listing history 6 events
-
2026-06-18days on market $89,000 Active 7 DOM
-
2026-06-17days on market $89,000 Active 6 DOM
-
2026-06-16days on market $89,000 Active 5 DOM
-
2026-06-15days on market $89,000 Active 4 DOM
-
2026-06-13remarks 699-char remark
-
2026-06-13$89,000 Active 2 DOM
ⓘ Source: listings_history table (triggers on properties + properties_extension) + one-shot
backfill from property_details.listing_events for pre-trigger history.
Climate risk First Street
- Flood 1/10 Low FEMA zone X (unshaded) · 0% chance over 30 yrs
- Wildfire 1/10 Low
- Heat 10/10 Extreme 7 d/yr ≥107°F today · 27 d/yr by 30 yrs out
- Wind 10/10 Extreme 99% chance of damaging wind over 30 yrs
- Air quality 3/10 Moderate 2 unhealthy d/yr today · 3 by 30 yrs out
Nearby sold comps map
Loading sold comps map…
Walkable amenities ~0.75 mi
Loading nearby amenities…
Taxation est. · year 1
- Rental income
- $17,326
- − Mortgage interest
- −$4,985
- − Property taxes
- −$1,335
- − Insurance
- −$445
- − Repairs & maintenance
- −$1,386
- − Management
- −$1,386
- − HOA
- −$5,268
- − Depreciation
- −$2,589
- Taxable loss
- −$68
- Est. tax savings @ 24.0%
- +$16
- After-tax cash flow
- $1,055/yr
For passive investors: Depreciation is non-cash, so a rental often shows a tax loss while cash-flowing — sheltering income. Rental losses are passive: they offset passive income freely, and up to $25,000/yr can offset ordinary (W-2) income if you actively participate and your MAGI is under $100k (phasing out to $0 by $150k); unused losses carry forward. On sale, claimed depreciation is recaptured at up to 25%, and gains may owe capital-gains tax (a 1031 exchange can defer both). Figures are a year-1 estimate at your 24.0% rate — not tax advice; consult a CPA.
Schools (NCES district)
- District
- Pinellas
- NCES district ID
- 1201560
- Math proficiency
- 51% ▼ -5.00%
- Reading proficiency
- 51% ▼ -3.00%
- Median HH income
- $46,270
- Composite
- 43.27/100
- National rank
- #3046
- State rank
- #31 of 73 in FL
Livability — Clearwater
- Score
- 82/100
- State rank
- #60
- US rank
- #988
Category grades
Schools grade is shown separately in the Schools card above.
Census & demographics
- Census place
- Clearwater, FL
- County
- Pinellas County · 939,478 people
- City population
- 170,933
- Metro
- Tampa-St. Petersburg-Clearwater, FL
- Population (ZIP)
- 27,476
- Household income
- $62,886
- Rent vs Own
- Severe rent burden
- 1511.0
Population outlook (Pinellas County) Hauer SSP2
- Today (2025)
- 1,027,532 people
- By 2030
- 1,063,586 · +3.5%
- By 2040
- 1,125,020 · +9.5%
- By 2050
- 1,168,637 · +13.7%
- By 2075
- 1,265,188 · +23.1%
- By 2100
- 1,260,357 · +22.7%
Race, ethnicity, and origin ACS 2023
- Neighborhood character
- Diverse neighborhood (Simpson 0.63)
- Race & ethnicity
- White 54% Black 22% Hispanic / Latino 17% Two or more races 10% Asian 3%
- Hispanic origin (detail)
- Mexican 6% Puerto Rican 5% Cuban 1%
- Common ancestry
- Romanian 2% Italian 2% Arab 1%
- Foreign-born
- 15% · Canada
- Languages at home
- 78% English-only · Spanish 13% Other Indo-European 3% Russian/Polish/Slavic 2%
Political lean MEDSL · Pinellas
- 2024 margin
- Lean R (+5.2) · D 46.9% · R 52.1%
- 2008→2024 swing
- -13.5pp toward R · 2008: 8.3pp · 2024: -5.2pp
- All cycles
- 2024: R+5.2 2020: D+0.2 2016: R+1.1 2012: D+5.6 2008: D+8.3
Not yet ingested
- Civics
- —
Market trends
- HPI YoY
- ▼ -472.62%
- Current HPI
- 351.4973
- Rent YoY
- ▼ -2.20%
- Metro
- Tampa-St. Petersburg-Clearwater, FL
- State GDP YoY
- ▲ 3.28%
- F500 in state
- 36
Industry mix (Fortune 500 HQ in FL)
| Industry | F500 HQs | Revenue |
|---|---|---|
| Industrial Technology | 2 | $29B |
|
||
| Insurance | 2 | $17B |
|
||
| Retail | 1 | $60B |
|
||
| Technology Distribution | 1 | $58B |
|
||
| Homebuilding | 1 | $35B |
|
||
| Technology Manufacturing | 1 | $35B |
|
||
Price history
+48.3% since first listed9 events — show timeline
- 2026-06-11 Listed $89,000 Stellar MLS as Distributed by MLS Grid
- 2016-08-09 Price Changed $30,000 Stellar MLS as Distributed by MLS Grid
- 2016-08-09 Listing Removed — Stellar MLS as Distributed by MLS Grid
- 2016-07-31 Price Changed $27,500 Stellar MLS as Distributed by MLS Grid
- 2016-05-28 Price Changed $30,000 Stellar MLS as Distributed by MLS Grid
- 2016-05-03 Price Changed $33,000 Stellar MLS as Distributed by MLS Grid
- 2016-04-20 Price Changed $38,000 Stellar MLS as Distributed by MLS Grid
- 2016-04-13 Listed $58,000 Stellar MLS as Distributed by MLS Grid
- 2007-01-03 Listed $60,000 Stellar MLS as Distributed by MLS Grid
Property tax history
-10.5%/yrLatest (2025): $82 · +23.9% YoY. Source: county tax records.
Cash-flow waterfall
monthlySold comps — $/sqft
last 12 mo · ≤1 miLoading sold comps…