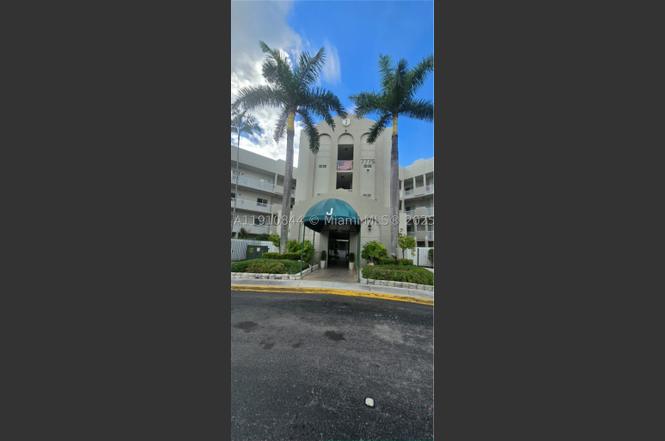
7775 Southampton Ter #305 · Tamarac, FL
Flood risk No data
- FEMA flood zone
- —
- Chance of flooding over 30 yrs
- —
- Est. flood insurance / yr
- —
Fire risk No data
- Est. fire insurance / yr
- —
Heat risk No data
- Hot days now (above threshold)
- —
- Hot days in 30 yrs
- —
Wind risk No data
- Chance of severe wind over 30 yrs
- —
Air-quality risk No data
- Unhealthy air days now
- —
- Unhealthy air days in 30 yrs
- —
Risk factors via First Street. Map © Google.
Why this score? — see what drove the D grade
The composite is a weighted blend of 9 inputs, each scored 0–100. Each bar is that input's sub-score; the figure is the points it added to the 100-point composite (weight × sub-score).
- Cash flow +11.3/30.0
- 1% rule +7.7/10.0
- ARV discount +7.5/15.0
- Schools +4.1/10.0
- Livability +3.8/5.0
- DSCR +3.3/10.0
- Condition / age +2.5/5.0
- Rent growth +2.0/5.0
- Appreciation +0.0/10.0
$189,900
🖨 Deal sheet (PDF) 📄 Offer letter ✓ Due diligence
Listing remarks
Welcome to Southampton Condominiums at King’s Point — a highly desirable 55+ community offering true resort-style living! This spacious 3rd-floor residence features 2 bedrooms, 2 bathrooms, and 1,444 sq. ft. of comfortable living space and a swimming pool view. Enjoy the convenience of an in-unit washer and dryer, impact windows, and a well-designed layout perfect for both relaxation and entertaining. Residents of King’s Point enjoy a wealth of resort-style amenities, including a clubhouse, fitness center, swimming pool, sauna, spa/hot tub, tennis courts, pickleball, and shuffleboard, along with a complimentary community shuttle service. The property includes a monthly as
Key facts
- $687 HOA
- 2 parking spots
- Community pool
Property features AI
Finance
- Other: Association pool is heated; Property is part of a senior community
- Financial info: Pets are not allowed
- HOA & community: Monthly association fees; Association amenities include clubhouse, fitness center, pool, trash service, transportation service, and elevators; Association covers amenities, common areas, cable TV, structure insurance, roof maintenance, sewer, security, trash, and water
Exterior
- Parking: Two or more parking spaces
- Security: Key card entry; On-site security guard; Smoke detectors
- Utilities: Cable available
- Home design: Condominium/attached property; Four-story building; Entry on the 3rd level
- Construction: Block construction
- Exterior features: Balcony; Screened balcony; Barbecue area; Association pool (heated); Security/high-impact doors
Interior
- Kitchen: Dishwasher; Electric range; Microwave; Refrigerator; Disposal
- Bedrooms: Bedroom located on the main level
- Flooring: Tile
- Bathrooms: 2 full bathrooms
- Heating & cooling: Central heating (electric); Central air conditioning (electric); Ceiling fans
- Interior features: Impact glass windows; Closet cabinetry; Custom mirrors; Third-floor entry; Elevator access; Bedroom on main level
- Laundry & utility: Washer; Dryer; Electric water heater
Neighborhood map
What this means for you Summary
Snapshot
- This is a 2-bed/2.0-bath condo listed at $190k.
Deal economics
- At list price, monthly cash flow is $-69 ($-828/yr) — negative.
- To cash-flow at today's rent, offer at most $178k (6.4% below list).
- Meets the 1% rule at list price ($2k rent vs $190k).
- Recommended offer: $167k (12.0% below list) — sets the bar for market timing.
- Cap rate 5.9% vs local median 3.9% in Tamarac — top-decile yield for the area; either an underpriced asset or a hidden risk that comps aren't pricing in. Stress-test before assuming the spread holds.
Location & tenants
- Location reads 76/100 on livability (#239 in FL, #3,785 nationally) — a middle-class / working-renter tenant base. Strengths: housing A+, health & safety A+, cost of living A-; Watch: employment C-, amenities F, commute F.
- Broward (suburban): math 42% / reading 53% proficiency, ranked #46 of 73 in FL (top 63%) — families likely to look elsewhere, expect single-tenant / working-renter base with shorter leases.
- Zoned schools: Challenger Elementary School (math 37% / reading 53%, grade D-, #1,271 of 2,144 statewide, top 60%, 909 students, 62% FRL); Nova Middle School (math 44% / reading 53%, grade C-, #274 of 571 statewide, top 50%, 1,284 students, 68% FRL); J. P. Taravella High School (math 19% / reading 45%, grade F, #415 of 667 statewide, top 63%, 2,586 students, 54% FRL).
- Market conditions: Rents soft (-1.9%/yr); 594 active listings in the ZIP; 40 comparable units currently listed for rent nearby; rentals at typical pace (median 24d on market — plan ~3-4 weeks tenant-placement turnaround); 2,111 units permitted in Broward County in 2024 (1,265 in 5+ unit buildings).
- At $2,418/mo this rent would consume 47% of the median local household income ($62k/yr) (locally 1394% of renters already pay >50% of income on rent) — very limited rent-growth headroom before tenants either downsize or default.
Forward outlook
- Local home prices are declining (-3.0%/yr); year-one equity from $1k of loan paydown is wiped out by about $6k of value loss. Plan a longer hold.
- Broward County population projected at +34% by 2050 — long-run rental-demand tailwind backs the buy-and-hold thesis.
Negotiation context
- It's been on market 225 days — a 12% lower offer ($167k) is reasonable based on typical stale-listing flexibility.
Risks & watch-outs
- Watch-outs: HOA is 28% of rent.
Questions for the listing agent
- What do current leases actually rent for vs. the listed asking? Can we see a recent rent roll and the last 12 months of T-12 income?
- It's been on market 225 days. Have you received any prior offers? Is the seller open to a 12% concession, seller financing, or rate buy-down credit?
- What does the HOA fee cover, when was the last increase, and are there any pending special assessments or reserve-fund shortfalls?
- Any open or pending special assessments — roof, HVAC, plumbing, elevator, façade? What's the per-unit balance and payoff schedule, and is the seller paying it off at close or rolling it to the buyer?
- Why hasn't it sold? Are there any deal-killer items the seller is aware of (foundation, flood, title, zoning, code violations)?
- Is there a deadline driving the sale (1031 exchange, divorce, estate, relocation)? That informs how much negotiation room exists.
- Schools are B-rated — typically a magnet for longer-tenancy family renters. What's the average tenant stay here, and is there a school-zone premium baked into asking?
- The area grade is low — what's the realistic commute time and amenity access for the typical tenant pool here? Any planned neighborhood developments (good or bad) we should know about?
- What's the average days-on-market for RENTAL listings here right now (not sales)? A rising rental-DOM trend means longer vacancies and softer asking-rent achievability than the comps imply.
- What's the recent tenant-quality profile in this submarket — average credit score on applications, eviction rate, late-payment / NSF rate, and stable-employment percentage? A property-management company in the area should have these aggregated.
- How much new apartment / multifamily construction is in the pipeline within 1–3 miles? Heavy new supply (>2% of stock underway) typically softens rents 12–24 months out; light construction supports rent growth.
Investment metrics
- 1% rule
- 1.27% ✓
- Cap rate
- 5.86%
- Cash-on-cash
- -1.56%
- DSCR
- 0.93
- GRM
- 6.5
CMA / ARV
No comps found within radius.
Projected returns pro-forma
-3.0% appreciation · 0.0% rent growth · sell at horizon
- IRR
- -23.9%
- Equity multiple
- 0.21×
- Total profit
- $-41,805
- Equity at exit
- $28,315
- IRR
- -42.2%
- Equity multiple
- -0.27×
- Total profit
- $-67,629
- Equity at exit
- $16,419
Cash invested: $53,172 (down + closing). Projections, not guarantees.
Landlord ↔ Tenant lean methodology
- Overall (STATE)
- 87 Strongly Landlord-Friendly
- State Florida
- 87 Strongly Landlord-Friendly · R+3
- County
- — inherits STATE
- City
- — inherits STATE
ZIP-level market 33321
- Home prices YoY
- -30.4%
- Rents YoY
- -1.9%
- Active inventory
- 594
- Price-to-rent
- 6.5×
Monthly cashflow live
- Estimated rent
- $2,418 high interval (Pro) →
- Mortgage (P&I)
- −$996
- Tax from tax record
- −$217 /mo · $2,603/yr
- Insurance
- −$79
- HOA
- −$687
- Vacancy / Maint / Mgmt
- −$508
- Net cashflow
- $-69
Break-even live
Sensitivity live
| Price | -10% $39 | -5% $-15 | +0% $-69 | +5% $-123 | +10% $-176 |
|---|---|---|---|---|---|
| Rent | -10% $-260 | -5% $-164 | +0% $-69 | +5% $27 | +10% $122 |
| Rate | -1.0pp $27 | -0.5pp $-21 | base $-69 | +0.5pp $-118 | +1.0pp $-168 |
UW: 25.0% down · 7.5% · 30yr · 1.5% tax · 5.0% vac · 8.0% maint · 8.0% mgmt
Financing live
Cash to close
- Down payment
- $47,475
- Closing costs
- $5,697
- Reserves months
- —
- Total cash needed
- —
Loan-product check · same deal, 3 products live
Conventional
25% down · 7.5% · 30yr
- Down + closing
- —
- Monthly P&I
- —
- Monthly cashflow
- —
- DSCR
- —
- Eligible?
- —
Personal DTI + credit; lowest rate.
DSCR
20% down · 8.5% · 30yr
- Down + closing
- —
- Monthly P&I
- —
- Monthly cashflow
- —
- DSCR
- —
- Eligible?
- —
No personal income docs; deal must DSCR.
Hard money
10% down · 12.0% · 12mo
- Down + closing
- —
- Monthly P&I
- —
- Monthly cashflow
- —
- DSCR
- —
- Eligible?
- —
Short-term bridge; refi at stabilization.
Rent comps 40 comps
| Address | Beds | Baths | Sqft | Rent | $/sqft | DOM | Units | Dist |
|---|---|---|---|---|---|---|---|---|
| 7842 Exeter Blvd E Tamarac, FL | 3.0 | 2.0 | 2016 | $2,750 | $1.36 | 22d | 1 | 0.28mi |
| 7970 N Nob Hill Rd Tamarac, FL | 3.0 | 2.0 | 1137 | $2,475 | $2.18 | 26d | 2 | 0.32mi |
| 7970 N Nob Hill Rd Tamarac, FL | 1.0–3.0 | 1.0–2.0 | 1137 | $2,195 | $1.93 | 23d | 2 | 0.32mi |
| 7755 Yardley Dr #112 Fort Lauderdale, FL | 2.0 | 2.0 | 1229 | $2,400 | $1.95 | 26d | 1 | 0.34mi |
| 7765 Yardley Dr #107 Fort Lauderdale, FL | 2.0 | 2.0 | 1469 | $2,200 | $1.50 | 15d | 1 | 0.37mi |
| 10403 NW 80th Ct Unit 10403 Tamarac, FL | 1.0 | 1.0 | 1688 | $1,995 | $1.18 | 26d | 1 | 0.41mi |
| 7737 Trent Dr #204 Tamarac, FL | 2.0 | 2.0 | 1080 | $2,000 | $1.85 | 23d | 1 | 0.45mi |
| 9511 Weldon Cir Unit 412 Tamarac, FL | 2.0 | 2.0 | 1080 | $1,875 | $1.74 | 10d | 1 | 0.49mi |
| 7878 Trent Dr #308 Tamarac, FL | 2.0 | 2.0 | 1215 | $2,300 | $1.89 | 26d | 1 | 0.49mi |
| 7878 Trent Dr #308 Tamarac, FL | 2.0 | 2.0 | 1215 | $2,000 | $1.65 | 15d | 1 | 0.49mi |
| 7214 S Devon Dr #211 Tamarac, FL | 2.0 | 2.0 | 1292 | $2,400 | $1.86 | 26d | 1 | 0.49mi |
| 9511 Weldon Cir Tamarac, FL | 2.0 | 2.0 | 1116 | $1,850 | $1.66 | 26d | 2 | 0.49mi |
| 8090 NW 96th Ter Tamarac, FL | 1.0–3.0 | 1.0–2.0 | 1154 | $2,370 | $2.05 | 0d | 18 | 0.50mi |
| 10426 E Clairmont Cir #212 Tamarac, FL | 2.0 | 2.0 | 1294 | $2,100 | $1.62 | 26d | 1 | 0.50mi |
| 7271 S Devon Dr #101 Tamarac, FL | 2.0 | 2.0 | 1187 | $2,200 | $1.85 | 24d | 1 | 0.52mi |
| 8205 NW 106th Ave Tamarac, FL | 3.0 | 2.0 | 1587 | $3,500 | $2.21 | 7d | 1 | 0.56mi |
| 8108 Prestige Commons Dr Tamarac, FL | 3.0 | 2.5 | 1478 | $3,200 | $2.17 | 26d | 1 | 0.57mi |
| 10350 E Clairmont Cir #312 Tamarac, FL | 2.0 | 2.0 | 1294 | $2,300 | $1.78 | 26d | 1 | 0.57mi |
| 9485 N Belfort Cir #308 Tamarac, FL | 2.0 | 2.0 | 1228 | $2,100 | $1.71 | 16d | 1 | 0.59mi |
| 10959 W Clairmont Cir #211 Tamarac, FL | 2.0 | 2.0 | 1163 | $2,100 | $1.81 | 26d | 1 | 0.61mi |
| 7610 Westwood Dr Tamarac, FL | 2.0–3.0 | 2.0 | 1017 | $1,980 | $1.95 | 19d | 1 | 0.63mi |
| 8320 Santa Monica Ave Unit 8320 Tamarac, FL | 3.0 | 2.5 | 1428 | $2,900 | $2.03 | 7d | 1 | 0.64mi |
| 9507 NW 80th Ct Tamarac, FL | 3.0 | 2.0 | 1629 | $2,900 | $1.78 | 26d | 1 | 0.68mi |
| 7304 Westwood Dr Unit 7304 Tamarac, FL | 3.0 | 2.0 | 1524 | $3,900 | $2.56 | 26d | 1 | 0.69mi |
| 9402 NW 81st Ct Tamarac, FL | 3.0 | 2.0 | 1212 | $3,600 | $2.97 | 26d | 1 | 0.72mi |
| 8800 NW 78th Ct Tamarac, FL | 1.0–2.0 | 1.0–2.0 | 910 | $2,320 | $2.55 | 1d | 15 | 0.77mi |
| 10881 Sea Hibiscus Ln Tamarac, FL | 3.0 | 2.5 | 1627 | $3,150 | $1.94 | 1d | 1 | 0.78mi |
| 7561 NW 88th Ter Tamarac, FL | 3.0 | 2.5 | 1358 | $2,995 | $2.21 | 26d | 2 | 0.89mi |
| 8770 Azalea Ct #203 Tamarac, FL | 2.0 | 2.0 | 1306 | $2,600 | $1.99 | 4d | 1 | 0.92mi |
| 555 Lakeview Dr Coral Springs, FL | 2.0–3.0 | 2.0 | 1255 | $2,279 | $1.82 | 0d | 12 | 1.07mi |
| 11611 W Atlantic Blvd #1326 Coral Springs, FL | 3.0 | 2.0 | 1407 | $3,200 | $2.27 | 10d | 1 | 1.25mi |
| 7355 Woodmont Ter #107 Tamarac, FL | 3.0 | 2.0 | 1224 | $2,300 | $1.88 | 6d | 1 | 1.27mi |
| 7355 Woodmont Ter #101 Tamarac, FL | 3.0 | 2.0 | 1150 | $2,300 | $2.00 | 26d | 1 | 1.27mi |
| 11765 W Atlantic Blvd #1625 Coral Springs, FL | 2.0 | 2.0 | 1197 | $2,550 | $2.13 | 0d | 1 | 1.31mi |
| 11715 W Atlantic Blvd #1826 Coral Springs, FL | 3.0 | 2.0 | 1255 | $2,700 | $2.15 | 26d | 1 | 1.33mi |
| 11685 W Atlantic Blvd #1931 Coral Springs, FL | 3.0 | 2.0 | 1255 | $2,700 | $2.15 | 26d | 1 | 1.36mi |
| 11721 W Atlantic Blvd #736 Coral Springs, FL | 3.0 | 2.0 | 1255 | $2,650 | $2.11 | 16d | 1 | 1.38mi |
| 11721 W Atlantic Blvd Unit 36 Coral Springs, FL | 3.0 | 2.0 | 1255 | $2,650 | $2.11 | 10d | 1 | 1.38mi |
| 11721 W Atlantic Blvd #723 Coral Springs, FL | 2.0 | 2.0 | 1152 | $1,850 | $1.61 | 26d | 1 | 1.38mi |
| 8660 S Southgate Shores Cir Tamarac, FL | 2.0 | 2.5 | 1230 | $2,625 | $2.13 | 26d | 1 | 1.40mi |
HOA detail condo
- Monthly dues
- $687 · $8,244/yr
- Likely covers
- poolgym
- Assessments
- None detected in remarks — confirm with the listing agent.
Listing history 16 events
-
2026-06-21days on market $189,900 Active 225 DOM
-
2026-06-18days on market $189,900 Active 222 DOM
-
2026-06-17days on market $189,900 Active 221 DOM
-
2026-06-16days on market $189,900 Active 220 DOM
-
2026-06-15days on market $189,900 Active 219 DOM
-
2026-06-13days on market $189,900 Active 217 DOM
-
2026-06-09days on market $189,900 Active 213 DOM
-
2026-06-07days on market $189,900 Active 211 DOM
-
2026-06-04days on market $189,900 Active 208 DOM
-
2026-06-03days on market $189,900 Active 207 DOM
-
2026-06-02days on market $189,900 Active 206 DOM
-
2026-06-01days on market $189,900 Active 205 DOM
-
2026-05-31days on market $189,900 Active 204 DOM
-
2026-04-21price $189,900
-
2026-01-13price $194,900
-
2025-11-08$199,900 Active
ⓘ Source: listings_history table (triggers on properties + properties_extension) + one-shot
backfill from property_details.listing_events for pre-trigger history.
Tax reassessment forecast FL · Resets to sale price
- Current annual tax
- $2,603 · $217/mo
- Projected year-2 tax
- $2,603 · $217/mo
- Expected delta
- $0/yr ($0/mo · 0.0%)
ⓘ Screening estimate from a state-policy table — verify with the county assessor before closing.
Nearby sold comps map
Loading sold comps map…
Walkable amenities ~0.75 mi
Loading nearby amenities…
Taxation est. · year 1
- Rental income
- $29,011
- − Mortgage interest
- −$10,637
- − Property taxes
- −$2,603
- − Insurance
- −$950
- − Repairs & maintenance
- −$2,321
- − Management
- −$2,321
- − HOA
- −$8,244
- − Depreciation
- −$5,524
- Taxable loss
- −$3,589
- Est. tax savings @ 24.0%
- +$861
- After-tax cash flow
- $33/yr
For passive investors: Depreciation is non-cash, so a rental often shows a tax loss while cash-flowing — sheltering income. Rental losses are passive: they offset passive income freely, and up to $25,000/yr can offset ordinary (W-2) income if you actively participate and your MAGI is under $100k (phasing out to $0 by $150k); unused losses carry forward. On sale, claimed depreciation is recaptured at up to 25%, and gains may owe capital-gains tax (a 1031 exchange can defer both). Figures are a year-1 estimate at your 24.0% rate — not tax advice; consult a CPA.
Schools (NCES district)
- District
- Broward
- NCES district ID
- 1200180
- Math proficiency
- 42% ▼ -18.00%
- Reading proficiency
- 53% ▼ -5.00%
- Median HH income
- $52,139
- Composite
- 40.88/100
- National rank
- #3621
- State rank
- #46 of 73 in FL
Livability — Tamarac
- Score
- 76/100
- State rank
- #239
- US rank
- #3785
Category grades
Schools grade is shown separately in the Schools card above.
Census & demographics
- Census place
- Tamarac, FL
- County
- Broward County · 1,963,430 people
- City population
- 105,666
- Metro
- Miami-Fort Lauderdale-Pompano Beach, FL
- Population (ZIP)
- 51,216
- Household income
- $62,066
- Rent vs Own
- Severe rent burden
- 1394.0
Population outlook (Broward County) Hauer SSP2
- Today (2025)
- 2,207,033 people
- By 2030
- 2,360,704 · +7.0%
- By 2040
- 2,661,208 · +20.6%
- By 2050
- 2,946,698 · +33.5%
- By 2075
- 3,602,273 · +63.2%
- By 2100
- 3,970,984 · +79.9%
Race, ethnicity, and origin ACS 2023
- Neighborhood character
- Highly diverse neighborhood (Simpson 0.70)
- Race & ethnicity
- Hispanic / Latino 34% White 33% Black 27% Two or more races 20% Asian 3%
- Hispanic origin (detail)
- Mexican 2% Puerto Rican 5% Cuban 5% Dominican 3%
- Common ancestry
- Romanian 3% Hispanic 3% Scotch-Irish 2%
- Foreign-born
- 38% · Canada, Jamaica, Dominican Republic
- Languages at home
- 63% English-only · Spanish 29% French/Haitian/Cajun 4% Other Indo-European 1%
Political lean MEDSL · Broward
- 2024 margin
- D (+17.0) · D 58.0% · R 41.0%
- 2008→2024 swing
- -17.8pp toward R · 2008: 34.7pp · 2024: 17.0pp
- All cycles
- 2024: D+17.0 2020: D+29.8 2016: D+35.0 2012: D+34.9 2008: D+34.7
Not yet ingested
- Civics
- —
Market trends
- HPI YoY
- ▼ -158.63%
- Current HPI
- 362.2989
- Rent YoY
- ▼ -1.86%
- Metro
- Miami-Fort Lauderdale-Pompano Beach, FL
- State GDP YoY
- ▲ 3.28%
- F500 in state
- 36
Industry mix (Fortune 500 HQ in FL)
| Industry | F500 HQs | Revenue |
|---|---|---|
| Industrial Technology | 2 | $29B |
|
||
| Insurance | 2 | $17B |
|
||
| Retail | 1 | $60B |
|
||
| Technology Distribution | 1 | $58B |
|
||
| Homebuilding | 1 | $35B |
|
||
| Technology Manufacturing | 1 | $35B |
|
||
Price history
-5.0% since first listed3 events — show timeline
- 2026-04-21 Price Changed $189,900 MARMLS
- 2026-01-13 Price Changed $194,900 MARMLS
- 2025-11-08 Listed $199,900 MARMLS
Property tax history
+8.2%/yrLatest (2025): $2,603 · +4.5% YoY. Source: county tax records.
Cash-flow waterfall
monthlySold comps — $/sqft
last 12 mo · ≤1 miLoading sold comps…