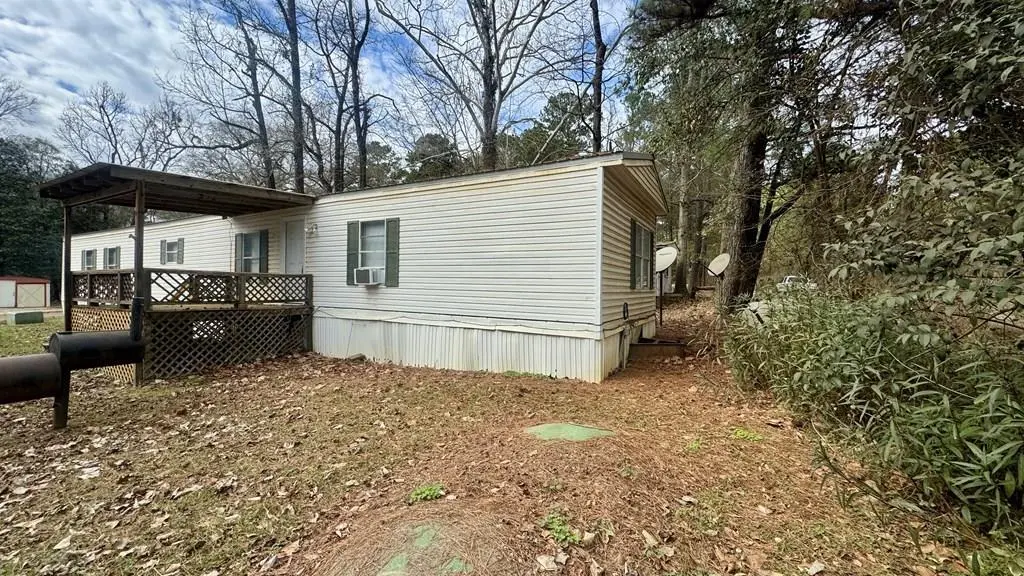
124 Gulf Breeze Dr · Milam, TX
Flood risk No data
- FEMA flood zone
- —
- Chance of flooding over 30 yrs
- —
- Est. flood insurance / yr
- —
Fire risk No data
- Est. fire insurance / yr
- —
Heat risk No data
- Hot days now (above threshold)
- —
- Hot days in 30 yrs
- —
Wind risk No data
- Chance of severe wind over 30 yrs
- —
Air-quality risk No data
- Unhealthy air days now
- —
- Unhealthy air days in 30 yrs
- —
Risk factors via First Street. Map © Google.
Why this score? — see what drove the B- grade
The composite is a weighted blend of 9 inputs, each scored 0–100. Each bar is that input's sub-score; the figure is the points it added to the 100-point composite (weight × sub-score).
- Cash flow +30.0/30.0
- 1% rule +10.0/10.0
- DSCR +10.0/10.0
- ARV discount +7.5/15.0
- Schools +3.2/10.0
- Livability +3.0/5.0
- Rent growth +2.5/5.0
- Condition / age +2.5/5.0
- Appreciation +0.0/10.0
$59,000
🖨 Deal sheet (PDF) 📄 Offer letter ✓ Due diligence
Listing remarks
Discover affordable lake-area living in Pendleton Harbor, a community set on a scenic golf course and just minutes from world-class fishing and hunting on Toledo Bend Lake. This well-cared-for 1995 Southern Lifestyle Homes, Southern Prestige model offers a solid 3-bedroom/2-bath mobile home on a manageable 0.075-acre lot. Inside, you'll find central heating plus new, upgraded window units for efficient cooling, giving year-round comfort. The home has been maintained with care, making it an ideal choice for a vacation camp, weekend getaway, or peaceful retirement retreat. Pendleton Harbor combines golf, lake access, and the natural beauty East Texas is known for — all in one community.
Key facts
- Central heating
- Lake area living
- Scenic golf course
Tags
Property features AI
Finance
- HOA & community: Homeowners association with an annual fee of $100 (about $8.33/month)
Exterior
- Parking: No garage
- Security: Smoke detector(s)
- Utilities: Public water
- Home design: Residential mobile home
- Exterior features: Metal roof; 0.15-acre lot; Located in the Pendelton Harbor subdivision
Interior
- Flooring: Vinyl
- Bathrooms: 2 full bathrooms
- Heating & cooling: Electric heating; Window unit cooling
- Interior features: Vinyl flooring; Smoke detectors
Neighborhood map
What this means for you Summary
Snapshot
- This is a 3-bed/2.0-bath manufactured listed at $59k.
Deal economics
- At list price, monthly cash flow is $319 ($4k/yr) — positive.
- The deal already cash-flows at list — no discount required.
- Meets the 1% rule at list price ($918 rent vs $59k).
- Recommended offer: $57k (3.0% below list) — sets the bar for market timing.
- Cap rate 12.8% vs local median 1.9% in Milam — top-decile yield for the area; either an underpriced asset or a hidden risk that comps aren't pricing in. Stress-test before assuming the spread holds.
Location & tenants
- Location reads 59/100 on livability (#1,169 in TX) — a working-class tenant base; expect higher turnover. Strengths: cost of living A+, crime A, housing A-; Watch: amenities F, commute F, employment F.
- Hemphill ISD (rural): math 37% / reading 41% proficiency, ranked #466 of 826 in TX (top 56%) — families likely to look elsewhere, expect single-tenant / working-renter base with shorter leases.
- Zoned schools: Hemphill El (math 27% / reading 42%, grade F, #1,995 of 4,322 statewide, top 50%, 334 students, 66% FRL); Hemphill Middle (math 40% / reading 43%, grade F, #595 of 1,662 statewide, top 37%, 252 students, 63% FRL); Hemphill H S (math 34% / reading 37%, grade F, #939 of 1,632 statewide, top 58%, 254 students, 62% FRL) — zoned schools average 64% FRL vs 39% district-wide (24 pts higher); higher-poverty schools than district average — tighter screening recommended.
- Market conditions: 237 active listings in the ZIP.
Forward outlook
- Local home prices are declining (-3.0%/yr); year-one equity from $408 of loan paydown is wiped out by about $2k of value loss. Plan a longer hold.
- Sabine County population projected at -23% by 2050 — secular population decline; favor cash flow + early exit over multi-decade hold.
- At projected returns (-3.0% appreciation + 3.0% rent growth), your $17k cash investment doubles in ~6 years — after that, you're playing with house money.
Negotiation context
- It's been on market 55 days — a 3% lower offer ($57k) is reasonable based on typical stale-listing flexibility.
Questions for the listing agent
- It's been on market 55 days. Have you received any prior offers? Is the seller open to a 3% concession, seller financing, or rate buy-down credit?
- What does the HOA fee cover, when was the last increase, and are there any pending special assessments or reserve-fund shortfalls?
- Is there a deadline driving the sale (1031 exchange, divorce, estate, relocation)? That informs how much negotiation room exists.
- Schools are F-rated, which usually means shorter tenancies and higher turnover. Who's the typical renter profile here, and what's been the actual vacancy rate?
- What's the average days-on-market for RENTAL listings here right now (not sales)? A rising rental-DOM trend means longer vacancies and softer asking-rent achievability than the comps imply.
- What's the recent tenant-quality profile in this submarket — average credit score on applications, eviction rate, late-payment / NSF rate, and stable-employment percentage? A property-management company in the area should have these aggregated.
- How much new for-sale + rental construction is in the pipeline within 1–3 miles? Heavy new supply typically softens prices + rents 12–24 months out; constrained supply supports both.
Investment metrics
- 1% rule
- 1.56% ✓
- Cap rate
- 12.78%
- Cash-on-cash
- 23.17%
- DSCR
- 2.03
- GRM
- 5.4
CMA / ARV
No comps found within radius.
Projected returns pro-forma
-3.0% appreciation · 3.0% rent growth · sell at horizon
- IRR
- 16.2%
- Equity multiple
- 1.65×
- Total profit
- $10,768
- Equity at exit
- $8,797
- IRR
- 24.8%
- Equity multiple
- 3.15×
- Total profit
- $35,589
- Equity at exit
- $5,101
Cash invested: $16,520 (down + closing). Projections, not guarantees.
Landlord ↔ Tenant lean methodology
- Overall (STATE)
- 87 Strongly Landlord-Friendly
- State Texas
- 87 Strongly Landlord-Friendly · R+5
- County
- — inherits STATE
- City
- — inherits STATE
ZIP-level market 75948
- Home prices YoY
- -17.7%
- Active inventory
- 237
- Price-to-rent
- 5.4×
Monthly cashflow live
- Estimated rent
- $918 medium interval (Pro) →
- Mortgage (P&I)
- −$309
- Tax from tax record
- −$64 /mo · $771/yr
- Insurance
- −$25
- HOA
- −$8
- Vacancy / Maint / Mgmt
- −$193
- Net cashflow
- $319
Break-even live
Sensitivity live
| Price | -10% $352 | -5% $336 | +0% $319 | +5% $302 | +10% $286 |
|---|---|---|---|---|---|
| Rent | -10% $246 | -5% $283 | +0% $319 | +5% $355 | +10% $391 |
| Rate | -1.0pp $349 | -0.5pp $334 | base $319 | +0.5pp $304 | +1.0pp $288 |
UW: 25.0% down · 7.5% · 30yr · 1.5% tax · 5.0% vac · 8.0% maint · 8.0% mgmt
Financing live
Cash to close
- Down payment
- $14,750
- Closing costs
- $1,770
- Reserves months
- —
- Total cash needed
- —
Loan-product check · same deal, 3 products live
Conventional
25% down · 7.5% · 30yr
- Down + closing
- —
- Monthly P&I
- —
- Monthly cashflow
- —
- DSCR
- —
- Eligible?
- —
Personal DTI + credit; lowest rate.
DSCR
20% down · 8.5% · 30yr
- Down + closing
- —
- Monthly P&I
- —
- Monthly cashflow
- —
- DSCR
- —
- Eligible?
- —
No personal income docs; deal must DSCR.
Hard money
10% down · 12.0% · 12mo
- Down + closing
- —
- Monthly P&I
- —
- Monthly cashflow
- —
- DSCR
- —
- Eligible?
- —
Short-term bridge; refi at stabilization.
HOA detail
- Monthly dues
- $8 · $96/yr
Listing history 17 events
-
2026-06-21days on market $59,000 Active 55 DOM
-
2026-06-21days on market $59,000 Active 54 DOM
-
2026-06-18days on market $59,000 Active 52 DOM
-
2026-06-17days on market $59,000 Active 51 DOM
-
2026-06-16days on market $59,000 Active 50 DOM
-
2026-06-15days on market $59,000 Active 49 DOM
-
2026-06-13days on market $59,000 Active 47 DOM
-
2026-06-12days on market $59,000 Active 46 DOM
-
2026-06-10days on market $59,000 Active 43 DOM
-
2026-06-08days on market $59,000 Active 42 DOM
-
2026-06-08days on market $59,000 Active 41 DOM
-
2026-06-07days on market $59,000 Active 40 DOM
-
2026-06-03days on market $59,000 Active 37 DOM
-
2026-06-02days on market $59,000 Active 36 DOM
-
2026-06-01days on market $59,000 Active 35 DOM
-
2026-05-31days on market $59,000 Active 34 DOM
-
2025-09-18$59,000 Active 809-char remark
ⓘ Source: listings_history table (triggers on properties + properties_extension) + one-shot
backfill from property_details.listing_events for pre-trigger history.
Tax reassessment forecast TX · Resets to sale price
- Current annual tax
- $771 · $64/mo
- Projected year-2 tax
- $1,080 · $90/mo
- Expected delta
- +$309/yr (+$26/mo · 40.1%)
ⓘ Screening estimate from a state-policy table — verify with the county assessor before closing.
Nearby sold comps map
Loading sold comps map…
Walkable amenities ~0.75 mi
Loading nearby amenities…
Taxation est. · year 1
- Rental income
- $11,016
- − Mortgage interest
- −$3,305
- − Property taxes
- −$771
- − Insurance
- −$295
- − Repairs & maintenance
- −$881
- − Management
- −$881
- − HOA
- −$96
- − Depreciation
- −$1,716
- Taxable income
- $3,070
- Est. tax owed @ 24.0%
- −$737
- After-tax cash flow
- $3,091/yr
For passive investors: Depreciation is non-cash, so a rental often shows a tax loss while cash-flowing — sheltering income. Rental losses are passive: they offset passive income freely, and up to $25,000/yr can offset ordinary (W-2) income if you actively participate and your MAGI is under $100k (phasing out to $0 by $150k); unused losses carry forward. On sale, claimed depreciation is recaptured at up to 25%, and gains may owe capital-gains tax (a 1031 exchange can defer both). Figures are a year-1 estimate at your 24.0% rate — not tax advice; consult a CPA.
Schools (NCES district)
- District
- Hemphill ISD
- NCES district ID
- 4822890
- Math proficiency
- 37% ▼ -1.00%
- Reading proficiency
- 41% ▲ 4.00%
- Median HH income
- $33,330
- Composite
- 32.06/100
- National rank
- #5821
- State rank
- #466 of 826 in TX
Livability — Milam
- Score
- 59/100
- State rank
- #1169
- US rank
- #20453
Category grades
Schools grade is shown separately in the Schools card above.
Census & demographics
- Census place
- Milam, TX
- Population (ZIP)
- 5,218
Population outlook (Sabine County) Hauer SSP2
- Today (2025)
- 9,354 people
- By 2030
- 8,806 · -5.9%
- By 2040
- 7,871 · -15.9%
- By 2050
- 7,224 · -22.8%
- By 2075
- 6,351 · -32.1%
- By 2100
- 5,465 · -41.6%
Race, ethnicity, and origin ACS 2023
- Neighborhood character
- Predominantly White (78%)
- Race & ethnicity
- White 78% Hispanic / Latino 7% Black 6% Two or more races 6% Asian 3% Native American 2%
- Hispanic origin (detail)
- Mexican 5%
- Common ancestry
- Lithuanian 5% Italian 2% Serbian 1%
- Foreign-born
- 2% · Canada
- Languages at home
- 96% English-only · Vietnamese 2% Spanish 1%
Political lean MEDSL · Sabine
- 2024 margin
- Solid R (+78.5) · D 10.6% · R 89.1%
- 2008→2024 swing
- -23.7pp toward R · 2008: -54.8pp · 2024: -78.5pp
- All cycles
- 2024: R+78.5 2020: R+75.0 2016: R+72.8 2012: R+63.9 2008: R+54.8
Not yet ingested
- Civics
- —
Market trends
- HPI YoY
- ▼ -34.26%
- Current HPI
- 159.0093
- Rent YoY
- —
- Metro
- —
- State GDP YoY
- ▲ 3.95%
- F500 in state
- 110
Industry mix (Fortune 500 HQ in TX)
| Industry | F500 HQs | Revenue |
|---|---|---|
| Energy | 16 | $1,198B |
|
||
| Technology | 5 | $198B |
|
||
| Engineering / Construction | 4 | $72B |
|
||
| Energy Services | 3 | $60B |
|
||
| Utilities | 3 | $41B |
|
||
| Healthcare | 2 | $330B |
|
||
Price history
1 event — show timeline
- 2025-09-18 Listed $59,000 Deep East Texas MLS
Property tax history
+4.3%/yrLatest (2025): $771 · +4.8% YoY. Source: county tax records.
Cash-flow waterfall
monthlySold comps — $/sqft
last 12 mo · ≤1 miLoading sold comps…