 Multi-family
3711 S Galvez St · New Orleans, LA
Flood risk 8/10 · Major
- FEMA flood zone
- AE
- Chance of flooding over 30 yrs
- 0.78%
- Est. flood insurance / yr
- $1,737 – $8,500
Fire risk 1/10 · Minimal
- Est. fire insurance / yr
- $1,269 – $2,357
Heat risk 10/10 · Severe
- Hot days now (above 108°F)
- 7 days/yr
- Hot days in 30 yrs
- 21 days/yr
Wind risk 10/10 · Severe
- Chance of severe wind over 30 yrs
- 99.0%
Air-quality risk 3/10 · Minor
- Unhealthy air days now
- 3 days/yr
- Unhealthy air days in 30 yrs
- 4 days/yr
Risk factors via First Street. Map © Google.
Why this score? — see what drove the D grade
The composite is a weighted blend of 9 inputs, each scored 0–100. Each bar is that input's sub-score; the figure is the points it added to the 100-point composite (weight × sub-score).
- Cash flow +15.0/30.0
- ARV discount +7.5/15.0
- 1% rule +5.0/10.0
- DSCR +5.0/10.0
- Livability +4.0/5.0
- Rent growth +2.7/5.0
- Condition / age +2.5/5.0
- Schools +1.6/10.0
- Appreciation +0.0/10.0
$79,900
🖨 Deal sheet (PDF) 📄 Offer letter ✓ Due diligence
Multi-family units
County records classify this as Multi-Family (2-4 Unit). Listing-text estimate: 1 unit. estimate disagrees with records
Listing remarks MLS
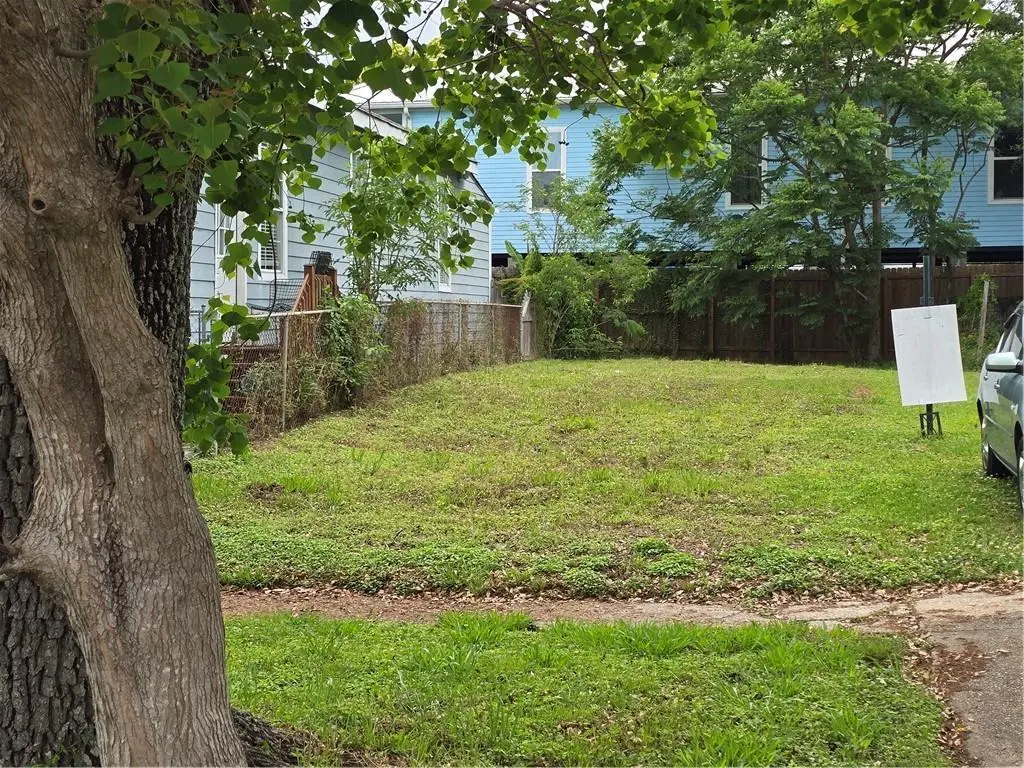
Build your dream home or investment property on this perfectly cleared vacant lot in the heart of the city! This 30x105 foot parcel comes ready with an existing driveway and is primed for a classic New Orleans shotgun-style home or a modern multi-family unit. The property is situated in a HU-RD2 (Historic Urban Two-Family Residential District) zone, offering fantastic versatility for builders and homeowners alike. Best of all, you’ll be just steps away from St. Charles Avenue and the iconic Mardi Gras parade routes. Don't miss this rare opportunity to own a piece of New Orleans!
Key facts
- Existing driveway
- Cleared vacant lot
- Listed 76 days
Tags
Neighborhood map
What this means for you Summary
Snapshot
- This is a 6-bed/4.0-bath multifamily listed at $80k.
Deal economics
- At list price, monthly cash flow is $3k ($31k/yr) — positive.
- The deal already cash-flows at list — no discount required.
- Meets the 1% rule at list price ($4k rent vs $80k).
- Recommended offer: $75k (6.0% below list) — sets the bar for market timing.
- Cap rate 51.4% vs local median 4.4% in New Orleans — top-decile yield for the area; either an underpriced asset or a hidden risk that comps aren't pricing in. Stress-test before assuming the spread holds.
Location & tenants
- Location reads 81/100 on livability (#3 in LA, #1,383 nationally) — a professional / high-income tenant draw. Strengths: amenities A+, commute A+, health & safety A+; Watch: crime C-, employment D.
- Orleans Parish (urban): math 11% / reading 27% proficiency, ranked #69 of 98 in LA (top 70%) — low school quality limits family demand, transient renter base, plan for 1-2y turnover; 68% free/reduced lunch — lower-income household profile, screen leases tightly.
- Zoned schools: Benjamin Franklin Elem. Math And Science (math 12% / reading 23%, grade F, #479 of 646 statewide, top 75%, 747 students, 98% FRL, charter) — zoned schools average 98% FRL vs 68% district-wide (30 pts higher); higher-poverty schools than district average — tighter screening recommended.
- Market conditions: Rents flat; 219 active listings in the ZIP; 16 comparable units currently listed for rent nearby; rentals lingering (median 45d on market — plan ~5-8 weeks vacancy on turnover, expect pricing pressure); 62% of comp listings sitting > 30 days — soft ceiling on asking rent; 710 units permitted in Orleans Parish in 2024 (244 in 5+ unit buildings).
- At $4,439/mo this rent would consume 87% of the median local household income ($61k/yr) (locally 1270% of renters already pay >50% of income on rent) — very limited rent-growth headroom before tenants either downsize or default.
Forward outlook
- Local home prices are declining (-3.0%/yr); year-one equity from $552 of loan paydown is wiped out by about $2k of value loss. Plan a longer hold.
- Orleans County population projected at +61% by 2050 — long-run rental-demand tailwind backs the buy-and-hold thesis.
- At projected returns (-3.0% appreciation + 0.7% rent growth), your $22k cash investment doubles in ~1 year — after that, you're playing with house money.
Negotiation context
- It's been on market 76 days — a 6% lower offer ($75k) is reasonable based on typical stale-listing flexibility.
- 3 sale attempts since 4y ago; this cycle's ask has dropped $5k (6%) from the opening price — seller is motivated, your offer sets the floor, not the list.
Risks & watch-outs
- Watch-outs: flood insurance adds $427/mo; built in 1920 — expect roof / HVAC / electrical / plumbing capex.
- Climate carrying-cost: in FEMA flood zone AE (mandatory federal flood insurance); severe wind risk, 99% chance of damaging wind over 30y; extreme-heat days projected 7→21/yr by 2055 (HVAC capex compounding) — expect insurance premiums to compound above CPI over the hold.
Questions for the listing agent
- It's been on market 76 days. Have you received any prior offers? Is the seller open to a 6% concession, seller financing, or rate buy-down credit?
- Built in 1920 — when were the roof, HVAC, electrical panel, plumbing, and water heater last replaced?
- What's the actual annual flood-insurance premium (NFIP or private), and is the property in a SFHA with mandatory coverage?
- Why hasn't it sold? Are there any deal-killer items the seller is aware of (foundation, flood, title, zoning, code violations)?
- Is there a deadline driving the sale (1031 exchange, divorce, estate, relocation)? That informs how much negotiation room exists.
- The area grade is low — what's the realistic commute time and amenity access for the typical tenant pool here? Any planned neighborhood developments (good or bad) we should know about?
- What's the average days-on-market for RENTAL listings here right now (not sales)? A rising rental-DOM trend means longer vacancies and softer asking-rent achievability than the comps imply.
- What's the recent tenant-quality profile in this submarket — average credit score on applications, eviction rate, late-payment / NSF rate, and stable-employment percentage? A property-management company in the area should have these aggregated.
- How much new apartment / multifamily construction is in the pipeline within 1–3 miles? Heavy new supply (>2% of stock underway) typically softens rents 12–24 months out; light construction supports rent growth.
Investment metrics
- 1% rule
- 5.56% ✓
- Cap rate
- 51.38%
- Cash-on-cash
- 161.02%
- DSCR
- 8.16
- GRM
- 1.5
CMA / ARV
- ARV (median comp)
- $35,166
- List price
- $79,900
- Delta
- 127.21%
- Verdict
- OVERPRICED
- Comps
- 10 within 1.0 mi
Show comp detail 12 sales within ~0.75 mi
| Address | Dist | Beds/Ba | Sqft | Sold | Price | $/sf | Match |
|---|---|---|---|---|---|---|---|
| 3316 18 Delachaise St | 0.13mi | 6/6.0 | 2,462 (+1%) | 14mo | $389,000 | $158 | 72 |
| 3964-66 Louisiana Ave Pkwy | 0.33mi | 6/2.0 | 2,372 (-3%) | 1mo | $162,500 | $69 | 71 |
| 1704 06 S Dupre St | 0.44mi | 6/4.0 | 2,332 (-4%) | 1mo | $359,000 | $154 | 71 |
| 3329 General Taylor St | 0.10mi | 5/3.5 (-1) | 2,314 (-5%) | 18mo | $320,000 | $138 | 65 |
| 3721 23 Willow St | 0.41mi | 6/2.0 | 2,281 (-7%) | 3mo | $117,000 | $51 | 60 |
| 2537-39 Amelia St | 0.63mi | 6/4.0 | 2,592 (+6%) | 6mo | $475,000 | $183 | 56 |
| 1117 29 S Dupre St | 0.74mi | 6/4.0 | 2,592 (+6%) | 4mo | $355,000 | $137 | 52 |
| 1505 07 S White St | 0.50mi | 5/2.0 (-1) | 2,268 (-7%) | 3mo | $144,900 | $64 | 49 |
| 2909 1st St | 0.61mi | 5/3.0 (-1) | 2,654 (+9%) | 3mo | $75,000 | $28 | 46 |
| 4324 26 Freret St | 0.73mi | 5/3.0 (-1) | 2,522 (+3%) | 8mo | $240,000 | $95 | 45 |
| 3429 31 Magnolia St | 0.55mi | 6/2.0 | 2,225 (-9%) | 12mo | $140,000 | $63 | 42 |
| 3803 05 State Street Dr | 0.69mi | 5/3.0 (-1) | 2,707 (+11%) | 2mo | $295,000 | $109 | 39 |
Match score weights: distance 35% · size 25% · config 20% · recency 20%. Top-matched comps best support the ARV.
Projected returns pro-forma
-3.0% appreciation · 0.73% rent growth · sell at horizon
- IRR
- —
- Equity multiple
- 7.32×
- Total profit
- $141,465
- Equity at exit
- $11,913
- IRR
- —
- Equity multiple
- 14.26×
- Total profit
- $296,741
- Equity at exit
- $6,908
Cash invested: $22,372 (down + closing). Projections, not guarantees.
Landlord ↔ Tenant lean methodology
- Overall (STATE)
- 90 Strongly Landlord-Friendly
- State Louisiana
- 90 Strongly Landlord-Friendly · R+12
- County
- — inherits STATE
- City
- — inherits STATE
ZIP-level market 70125
- Home prices YoY
- -16.3%
- Rents YoY
- 0.7%
- Active inventory
- 219
- Price-to-rent
- 1.5×
Monthly cashflow live
- Estimated rent
- $4,439 high interval (Pro) →
- Mortgage (P&I)
- −$419
- Tax from tax record
- −$53 /mo · $631/yr
- Insurance
- −$33
- Flood insurance flood zone
- −$427 /mo · $5,118/yr
- HOA
- −$0
- Vacancy / Maint / Mgmt
- −$932
- Net cashflow
- $2,575
Break-even live
Sensitivity live
| Price | -10% $2,621 | -5% $2,598 | +0% $2,575 | +5% $2,553 | +10% $2,530 |
|---|---|---|---|---|---|
| Rent | -10% $2,225 | -5% $2,400 | +0% $2,575 | +5% $2,751 | +10% $2,926 |
| Rate | -1.0pp $2,616 | -0.5pp $2,596 | base $2,575 | +0.5pp $2,555 | +1.0pp $2,534 |
UW: 25.0% down · 7.5% · 30yr · 1.5% tax · 5.0% vac · 8.0% maint · 8.0% mgmt
Financing live
Cash to close
- Down payment
- $19,975
- Closing costs
- $2,397
- Reserves months
- —
- Total cash needed
- —
Loan-product check · same deal, 3 products live
Conventional
25% down · 7.5% · 30yr
- Down + closing
- —
- Monthly P&I
- —
- Monthly cashflow
- —
- DSCR
- —
- Eligible?
- —
Personal DTI + credit; lowest rate.
DSCR
20% down · 8.5% · 30yr
- Down + closing
- —
- Monthly P&I
- —
- Monthly cashflow
- —
- DSCR
- —
- Eligible?
- —
No personal income docs; deal must DSCR.
Hard money
10% down · 12.0% · 12mo
- Down + closing
- —
- Monthly P&I
- —
- Monthly cashflow
- —
- DSCR
- —
- Eligible?
- —
Short-term bridge; refi at stabilization.
Rent comps 16 comps
| Address | Beds | Baths | Sqft | Rent | $/sqft | DOM | Units | Dist |
|---|---|---|---|---|---|---|---|---|
| 3112 Upperline St New Orleans, LA | 5.0 | 3.5 | 2800 | $3,650 | $1.30 | 25d | 1 | 0.48mi |
| 2117 S Lopez St New Orleans, LA | 5.0 | 2.0 | 1920 | $2,000 | $1.04 | 25d | 1 | 0.56mi |
| 2818 Palmer Ave New Orleans, LA | 5.0 | 2.0 | 1832 | $4,900 | $2.67 | 45d | 1 | 0.88mi |
| 2703 Palmer Ave New Orleans, LA | 5.0 | 2.0 | 2349 | $5,500 | $2.34 | 45d | 1 | 0.89mi |
| 6326 S Johnson St Unit 1 New Orleans, LA | 5.0 | 2.0 | 2013 | $3,950 | $1.96 | 45d | 1 | 0.89mi |
| 2715 Palmer Ave New Orleans, LA | 5.0 | 2.0 | 2184 | $4,900 | $2.24 | 45d | 1 | 0.89mi |
| 6321 S Prieur St New Orleans, LA | 6.0 | 2.0 | 1900 | $4,200 | $2.21 | 45d | 1 | 0.92mi |
| 2808 Calhoun St New Orleans, LA | 6.0 | 4.0 | 3037 | $7,500 | $2.47 | 22d | 1 | 0.93mi |
| 2325 State St New Orleans, LA | 5.0 | 3.0 | 1800 | $4,000 | $2.22 | 25d | 1 | 0.99mi |
| 1927 Napoleon Ave New Orleans, LA | 5.0 | 2.0 | 3350 | $3,600 | $1.07 | 45d | 1 | 1.03mi |
| 7011 Jeannette St Unit A New Orleans, LA | 5.0 | 3.0 | 2200 | $5,000 | $2.27 | 45d | 1 | 1.18mi |
| 1609 Broadway St New Orleans, LA | 5.0 | 2.0 | 1776 | $5,000 | $2.82 | 45d | 1 | 1.20mi |
| 7015 Willow St New Orleans, LA | 5.0 | 3.0 | 2000 | $4,200 | $2.10 | 45d | 1 | 1.22mi |
| 1519 Pine St New Orleans, LA | 5.0 | 3.0 | 3000 | $4,000 | $1.33 | 25d | 1 | 1.28mi |
| 4 Cromwell Pl New Orleans, LA | 5.0 | 2.0 | 2600 | $7,000 | $2.69 | 45d | 1 | 1.28mi |
| 939 Broadway St New Orleans, LA | 5.0 | 3.0 | 1900 | $4,000 | $2.11 | 4d | 1 | 1.48mi |
Listing history 20 events
-
2026-06-21days on market $79,900 Active 76 DOM
-
2026-06-18days on market $79,900 Active 73 DOM
-
2026-06-17days on market $79,900 Active 72 DOM
-
2026-06-16days on market $79,900 Active 71 DOM
-
2026-06-15days on market $79,900 Active 70 DOM
-
2026-06-13days on market $79,900 Active 68 DOM
-
2026-06-10days on market $79,900 Active 65 DOM
-
2026-06-09days on market $79,900 Active 64 DOM
-
2026-06-08days on market $79,900 Active 63 DOM
-
2026-06-07days on market $79,900 Active 62 DOM
-
2026-06-05days on market $79,900 Active 59 DOM
-
2026-06-03days on market $79,900 Active 58 DOM
-
2026-06-02days on market $79,900 Active 57 DOM
-
2026-06-02price $79,900 Active 56 DOM
-
2026-06-01days on market $85,000 Active 56 DOM
-
2026-05-31days on market $85,000 Active 55 DOM
-
2026-04-02$85,000 Active 591-char remark
Show marketing remark (585 chars)
BUILD YOUR DREAM HOME OR INVESTMENT PROPERTY ON THIS PERFECTLY CLEARED VACANT LOT IN THE HEART OF THE CITY! THIS 30X105 FOOT PARCEL COMES READY WITH AN EXISTING DRIVEWAY AND IS PRIMED FOR A CLASSIC NEW ORLEANS SHOTGUN-STYLE HOME OR A MODERN MULTI-FAMILY UNIT. THE PROPERTY IS SITUATED IN A HU-RD2 (HISTORIC URBAN TWO-FAMILY RESIDENTIAL DISTRICT) ZONE, OFFERING FANTASTIC VERSATILITY FOR BUILDERS AND HOMEOWNERS ALIKE. BEST OF ALL, YOU'LL BE JUST STEPS AWAY FROM ST. CHARLES AVENUE AND THE ICONIC MARDI GRAS PARADE ROUTES. DON'T MISS THIS RARE OPPORTUNITY TO OWN A PIECE OF NEW ORLEANS!
-
2026-04-02$85,000 Active 585-char remark
Show marketing remark (585 chars)
BUILD YOUR DREAM HOME OR INVESTMENT PROPERTY ON THIS PERFECTLY CLEARED VACANT LOT IN THE HEART OF THE CITY! THIS 30X105 FOOT PARCEL COMES READY WITH AN EXISTING DRIVEWAY AND IS PRIMED FOR A CLASSIC NEW ORLEANS SHOTGUN-STYLE HOME OR A MODERN MULTI-FAMILY UNIT. THE PROPERTY IS SITUATED IN A HU-RD2 (HISTORIC URBAN TWO-FAMILY RESIDENTIAL DISTRICT) ZONE, OFFERING FANTASTIC VERSATILITY FOR BUILDERS AND HOMEOWNERS ALIKE. BEST OF ALL, YOU'LL BE JUST STEPS AWAY FROM ST. CHARLES AVENUE AND THE ICONIC MARDI GRAS PARADE ROUTES. DON'T MISS THIS RARE OPPORTUNITY TO OWN A PIECE OF NEW ORLEANS!
-
2022-08-16price $160,000
-
2022-07-16$160,000
ⓘ Source: listings_history table (triggers on properties + properties_extension) + one-shot
backfill from property_details.listing_events for pre-trigger history.
Tax reassessment forecast LA · Resets to sale price
- Current annual tax
- $631 · $53/mo
- Projected year-2 tax
- $631 · $53/mo
- Expected delta
- $0/yr ($0/mo · 0.0%)
ⓘ Screening estimate from a state-policy table — verify with the county assessor before closing.
Climate risk First Street
- Flood 8/10 Severe FEMA zone AE · 78% chance over 30 yrs
- Wildfire 1/10 Low
- Heat 10/10 Extreme 7 d/yr ≥108°F today · 21 d/yr by 30 yrs out
- Wind 10/10 Extreme 99% chance of damaging wind over 30 yrs
- Air quality 3/10 Moderate 3 unhealthy d/yr today · 4 by 30 yrs out
Nearby sold comps map
Loading sold comps map…
Walkable amenities ~0.75 mi
Loading nearby amenities…
Taxation est. · year 1
- Rental income
- $53,268
- − Mortgage interest
- −$4,476
- − Property taxes
- −$631
- − Insurance
- −$5,518
- − Repairs & maintenance
- −$4,261
- − Management
- −$4,261
- − Depreciation
- −$2,324
- Taxable income
- $31,796
- Est. tax owed @ 24.0%
- −$7,631
- After-tax cash flow
- $23,273/yr
For passive investors: Depreciation is non-cash, so a rental often shows a tax loss while cash-flowing — sheltering income. Rental losses are passive: they offset passive income freely, and up to $25,000/yr can offset ordinary (W-2) income if you actively participate and your MAGI is under $100k (phasing out to $0 by $150k); unused losses carry forward. On sale, claimed depreciation is recaptured at up to 25%, and gains may owe capital-gains tax (a 1031 exchange can defer both). Figures are a year-1 estimate at your 24.0% rate — not tax advice; consult a CPA.
Schools (NCES district)
- District
- Orleans Parish
- NCES district ID
- 2201170
- Math proficiency
- 11% ▼ -52.00%
- Reading proficiency
- 27% ▼ -46.00%
- Median HH income
- $37,011
- Composite
- 15.78/100
- National rank
- #9271
- State rank
- #69 of 98 in LA
Livability — New Orleans
- Score
- 81/100
- State rank
- #3
- US rank
- #1383
Category grades
Schools grade is shown separately in the Schools card above.
Census & demographics
- Census place
- New Orleans, LA
- County
- Orleans Parish · 338,817 people
- City population
- 338,817
- Metro
- New Orleans-Metairie, LA
- Population (ZIP)
- 17,821
- Household income
- $61,174
- Rent vs Own
- Severe rent burden
- 1270.0
Population outlook (Orleans County) Hauer SSP2
- Today (2025)
- 513,025 people
- By 2030
- 575,781 · +12.2%
- By 2040
- 700,174 · +36.5%
- By 2050
- 826,541 · +61.1%
- By 2075
- 1,123,374 · +119.0%
- By 2100
- 1,355,609 · +164.2%
Race, ethnicity, and origin ACS 2023
- Neighborhood character
- Diverse neighborhood (Simpson 0.63)
- Race & ethnicity
- Black 51% White 32% Hispanic / Latino 9% Two or more races 9% Asian 2% Native American 1%
- Hispanic origin (detail)
- Mexican 2%
- Common ancestry
- Lithuanian 8% Romanian 1% Slovak 1%
- Foreign-born
- 7% · Canada, China
- Languages at home
- 90% English-only · Spanish 6% French/Haitian/Cajun 1% Chinese 1%
Political lean MEDSL · Orleans
- 2024 margin
- Solid D (+67.0) · D 82.2% · R 15.2% · Other 2.7%
- 2008→2024 swing
- +6.7pp toward D · 2008: 60.3pp · 2024: 67.0pp
- All cycles
- 2024: D+67.0 2020: D+68.2 2016: D+66.2 2012: D+62.5 2008: D+60.3
Not yet ingested
- Civics
- —
Market trends
- HPI YoY
- ▼ -49.68%
- Current HPI
- 255.5998
- Rent YoY
- ▲ 0.73%
- Metro
- New Orleans-Metairie, LA
- State GDP YoY
- ▲ 3.29%
- F500 in state
- 10
Industry mix (Fortune 500 HQ in LA)
| Industry | F500 HQs | Revenue |
|---|---|---|
| Telecommunications | 2 | $23B |
|
||
| Utilities | 1 | $12B |
|
||
| Wholesale / Distribution | 1 | $5B |
|
||
| Advertising | 1 | $2B |
|
||
Price history
-46.9% since first listed4 events — show timeline
- 2026-04-02 Listed $85,000 AcadianaMLS
- 2026-04-02 Listed $85,000 GSREIN
- 2022-08-16 Price Changed $160,000 GSREIN
- 2022-07-16 Listed $160,000 AcadianaMLS
Property tax history
-9.4%/yrLatest (2026): $631 · +1.1% YoY. Source: county tax records.
Cash-flow waterfall
monthlySold comps — $/sqft
last 12 mo · ≤1 miLoading sold comps…