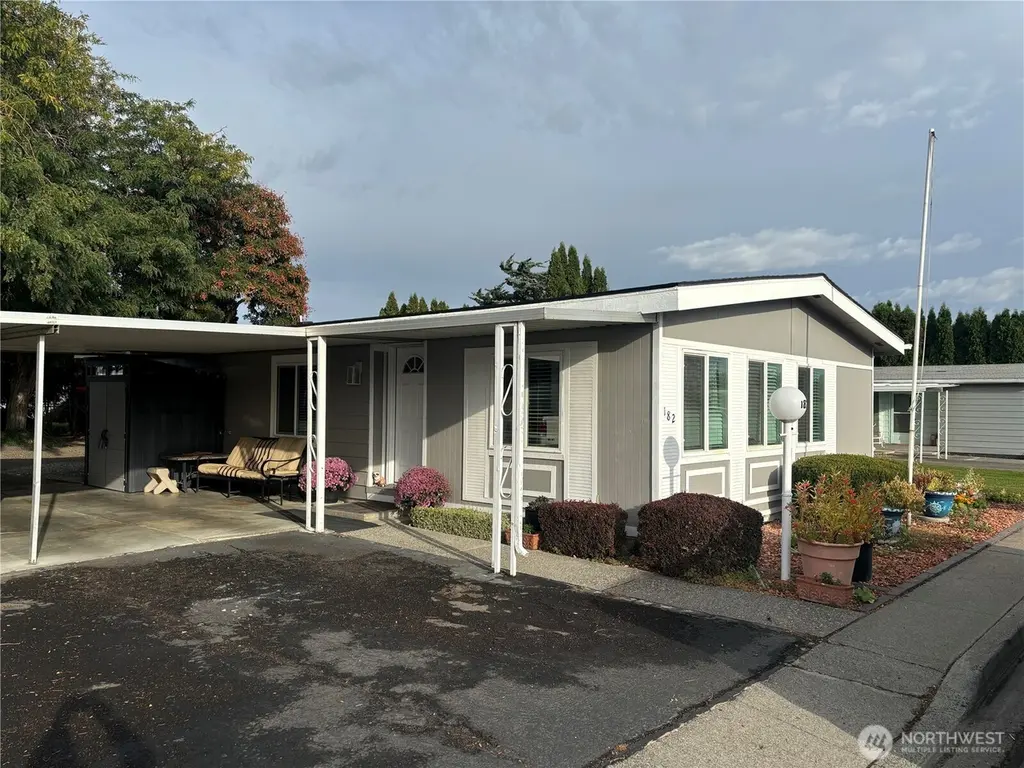
7901 W Clearwater Ave #182 · Kennewick, WA
Flood risk 1/10 · Minimal
- FEMA flood zone
- —
- Chance of flooding over 30 yrs
- 0.0%
- Est. flood insurance / yr
- —
Fire risk 4/10 · Minor
- Est. fire insurance / yr
- $604 – $1,122
Heat risk 5/10 · Moderate
- Hot days now (above 98°F)
- 7 days/yr
- Hot days in 30 yrs
- 14 days/yr
Wind risk 1/10 · Minimal
- Chance of severe wind over 30 yrs
- —
Air-quality risk 8/10 · Major
- Unhealthy air days now
- 14 days/yr
- Unhealthy air days in 30 yrs
- 15 days/yr
Risk factors via First Street. Map © Google.
Why this score? — see what drove the B grade
The composite is a weighted blend of 9 inputs, each scored 0–100. Each bar is that input's sub-score; the figure is the points it added to the 100-point composite (weight × sub-score).
- Cash flow +30.0/30.0
- DSCR +10.0/10.0
- 1% rule +9.4/10.0
- ARV discount +7.5/15.0
- Schools +4.6/10.0
- Livability +3.9/5.0
- Rent growth +3.3/5.0
- Condition / age +2.5/5.0
- Appreciation +0.0/10.0
$119,900
🖨 Deal sheet 📄 Offer letter ✓ Due diligence
Listing remarks MLS
Look no more, this home is a well-maintained manufactured home located in a +55 senior park community within city limits. This home offers 2bedrooms 2 baths with the convenience of a carport and the peace of mind that comes with a well-cared-for property. Perfect for those looking to enjoy a relaxed lifestyle. Call your favorite realtor for a showing!
Key facts
- Built 1976
- Listed 257 days
Neighborhood map
What this means for you Summary
Snapshot
- This is a 2-bed/2.0-bath manufactured listed at $120k.
Deal economics
- At list price, monthly cash flow is $532 ($6k/yr) — positive.
- The deal already cash-flows at list — no discount required.
- Meets the 1% rule at list price ($2k rent vs $120k).
- Recommended offer: $106k (12.0% below list) — sets the bar for market timing.
- Cap rate 11.6% vs local median 3.3% in Kennewick — top-decile yield for the area; either an underpriced asset or a hidden risk that comps aren't pricing in. Stress-test before assuming the spread holds.
Location & tenants
- Location reads 78/100 on livability (#131 in WA, #2,599 nationally) — a middle-class / working-renter tenant base. Strengths: commute A+, housing A+, health & safety A; Watch: schools D+, amenities D+, crime F.
- Kennewick School District (urban): math 43% / reading 58% proficiency, ranked #141 of 291 in WA (top 48%) — acceptable for families but not a draw, mixed tenant base, ~2y average lease.
- Market conditions: Rents rising (+3.4%/yr); 286 active listings in the ZIP; 12 comparable units currently listed for rent nearby; rentals lingering (median 44d on market — plan ~5-8 weeks vacancy on turnover, expect pricing pressure); 50% of comp listings sitting > 30 days — soft ceiling on asking rent; 1,532 units permitted in Benton County in 2024 (389 in 5+ unit buildings).
- This rent runs 33% of the median local income ($63k/yr) — at the standard rent-burdened threshold; future hikes will face affordability resistance.
Forward outlook
- Local home prices are declining (-3.0%/yr); year-one equity from $829 of loan paydown is wiped out by about $4k of value loss. Plan a longer hold.
- Benton County population projected at +32% by 2050 — long-run rental-demand tailwind backs the buy-and-hold thesis.
- At projected returns (-3.0% appreciation + 3.4% rent growth), your $34k cash investment doubles in ~7 years — after that, you're playing with house money.
Negotiation context
- It's been on market 257 days — a 12% lower offer ($106k) is reasonable based on typical stale-listing flexibility.
- 4 sale attempts since 2y ago with the ask held roughly flat each time — persistent listings suggest the price (not the market) is what's stuck; bring a comps-based counter.
Risks & watch-outs
- Climate carrying-cost: extreme-heat days projected 7→14/yr by 2055 (HVAC capex compounding) — expect insurance premiums to compound above CPI over the hold.
Questions for the listing agent
- It's been on market 257 days. Have you received any prior offers? Is the seller open to a 12% concession, seller financing, or rate buy-down credit?
- Built in 1976 — when were the roof, HVAC, electrical panel, plumbing, and water heater last replaced?
- Why hasn't it sold? Are there any deal-killer items the seller is aware of (foundation, flood, title, zoning, code violations)?
- Is there a deadline driving the sale (1031 exchange, divorce, estate, relocation)? That informs how much negotiation room exists.
- Schools are D-rated, which usually means shorter tenancies and higher turnover. Who's the typical renter profile here, and what's been the actual vacancy rate?
- Crime grade is F in this area — have there been break-ins, vandalism, or insurance claims at this property in the last 3 years? What carrier currently insures it and at what premium?
- What's the average days-on-market for RENTAL listings here right now (not sales)? A rising rental-DOM trend means longer vacancies and softer asking-rent achievability than the comps imply.
- What's the recent tenant-quality profile in this submarket — average credit score on applications, eviction rate, late-payment / NSF rate, and stable-employment percentage? A property-management company in the area should have these aggregated.
- How much new for-sale + rental construction is in the pipeline within 1–3 miles? Heavy new supply typically softens prices + rents 12–24 months out; constrained supply supports both.
Investment metrics
- 1% rule
- 1.44% ✓
- Cap rate
- 11.62%
- Cash-on-cash
- 19.02%
- DSCR
- 1.85
- GRM
- 5.8
CMA / ARV
- ARV (median comp)
- $72,951
- List price
- $119,900
- Delta
- 64.36%
- Verdict
- OVERPRICED
- Comps
- 20 within 1.0 mi
Show comp detail 7 sales within ~0.75 mi
| Address | Dist | Beds/Ba | Sqft | Sold | Price | $/sf | Match |
|---|---|---|---|---|---|---|---|
| 312 S Columbia Center Blvd #82 Blvd #82 | 0.09mi | 2/2.0 | 1,152 (0%) | 20mo | $87,000 | $76 | 79 |
| 7901 W Clearwater Avenue #167 Ave #167 | 0.08mi | 3/2.0 (+1) | 1,248 (+8%) | 2mo | $90,000 | $72 | 76 |
| 7901 W Clearwater Ave #145 | 0.07mi | 2/2.0 | 1,008 (-12%) | 6mo | $48,000 | $48 | 71 |
| 7901 W Clearwater Ave #137 | 0.13mi | 3/2.0 (+1) | 1,296 (+12%) | 2mo | $102,500 | $79 | 67 |
| 7901 W Clearwater Ave #154 Ave | 0.08mi | 3/2.0 (+1) | 1,296 (+12%) | 5mo | $90,000 | $69 | 67 |
| 312 S Columbia Center Blvd #71 Blvd #71 | 0.10mi | 3/2.0 (+1) | 1,296 (+12%) | 6mo | $70,000 | $54 | 64 |
| 312 S Columbia Center Blvd. #42 Blvd #42 | 0.17mi | 3/2.0 (+1) | 1,248 (+8%) | 12mo | $130,000 | $104 | 63 |
Match score weights: distance 35% · size 25% · config 20% · recency 20%. Top-matched comps best support the ARV.
Projected returns pro-forma
-3.0% appreciation · 3.39% rent growth · sell at horizon
- IRR
- 11.4%
- Equity multiple
- 1.45×
- Total profit
- $15,174
- Equity at exit
- $17,877
- IRR
- 20.7%
- Equity multiple
- 2.78×
- Total profit
- $59,775
- Equity at exit
- $10,367
Cash invested: $33,572 (down + closing). Projections, not guarantees.
Landlord ↔ Tenant lean methodology
- Overall (STATE)
- 28 Tenant-Leaning
- State Washington
- 28 Tenant-Leaning · D+8
- County
- — inherits STATE
- City
- — inherits STATE
ZIP-level market 99336
- Rents YoY
- 3.4%
- Active inventory
- 286
- Price-to-rent
- 5.8×
Monthly cashflow live
- Estimated rent
- $1,723 high interval (Pro) →
- Mortgage (P&I)
- −$629
- Tax est. 1.5%
- −$150 /mo · $1,798/yr
- Insurance
- −$50
- HOA
- −$0
- Vacancy / Maint / Mgmt
- −$362
- Net cashflow
- $532
Break-even live
UW: 25.0% down · 7.5% · 30yr · 1.5% tax · 5.0% vac · 8.0% maint · 8.0% mgmt
Financing live
Cash to close
- Down payment
- $29,975
- Closing costs
- $3,597
- Reserves months
- —
- Total cash needed
- —
Loan-product check · same deal, 3 products live
Conventional
25% down · 7.5% · 30yr
- Down + closing
- —
- Monthly P&I
- —
- Monthly cashflow
- —
- DSCR
- —
- Eligible?
- —
Personal DTI + credit; lowest rate.
DSCR
20% down · 8.5% · 30yr
- Down + closing
- —
- Monthly P&I
- —
- Monthly cashflow
- —
- DSCR
- —
- Eligible?
- —
No personal income docs; deal must DSCR.
Hard money
10% down · 12.0% · 12mo
- Down + closing
- —
- Monthly P&I
- —
- Monthly cashflow
- —
- DSCR
- —
- Eligible?
- —
Short-term bridge; refi at stabilization.
Rent comps 12 comps
| Address | Beds | Baths | Sqft | Rent | $/sqft | DOM | Units | Dist |
|---|---|---|---|---|---|---|---|---|
| 7803 W Deschutes Ave Kennewick, WA | 1.0–3.0 | 1.0–2.0 | 925 | $1,770 | $1.91 | 14d | 13 | 0.27mi |
| 8180 W 4th Ave Kennewick, WA | 2.0–3.0 | 2.0 | 1202 | $1,925 | $1.60 | 14d | 4 | 0.33mi |
| 502 S Florida Pl Kennewick, WA | 2.0 | 1.0 | 1003 | $1,850 | $1.84 | 44d | 1 | 0.33mi |
| 7275 W Clearwater Ave Unit B112 Kennewick, WA | 1.0 | 1.0 | 777 | $1,395 | $1.80 | 44d | 1 | 0.48mi |
| 7275 W Clearwater Ave Kennewick, WA | 1.0 | 1.0 | 777 | $1,495 | $1.92 | 44d | 1 | 0.49mi |
| 7968 W 10th Ave Kennewick, WA | 1.0–3.0 | 1.0–2.0 | 951 | $1,875 | $1.97 | 14d | 10 | 0.65mi |
| 7960 W 10th Ave Kennewick, WA | 1.0–2.0 | 1.0–2.0 | 946 | $2,345 | $2.48 | 14d | 9 | 0.66mi |
| 8831 W Entiat Ave Kennewick, WA | 3.0 | 2.0 | 1232 | $1,995 | $1.62 | 44d | 1 | 0.73mi |
| 725 N Center Pkwy Kennewick, WA | 1.0–3.0 | 1.0–2.0 | 1086 | $1,906 | $1.75 | 14d | 9 | 0.81mi |
| 6809 W Kennewick Ave Unit C Kennewick, WA | 2.0 | 1.0 | 1043 | $1,250 | $1.20 | 44d | 1 | 0.87mi |
| 24 S Quay St Unit 3 Kennewick, WA | 3.0 | 1.5 | 1128 | $1,625 | $1.44 | 14d | 1 | 0.94mi |
| 32 S Quay St #4 Kennewick, WA | 2.0 | 1.0 | 782 | $1,195 | $1.53 | 44d | 1 | 0.95mi |
Listing history 24 events
-
2026-06-18days on market $119,900 Active 257 DOM
-
2026-06-17days on market $119,900 Active 256 DOM
-
2026-06-16days on market $119,900 Active 255 DOM
-
2026-06-15days on market $119,900 Active 254 DOM
-
2026-06-14days on market $119,900 Active 252 DOM
-
2026-06-13days on market $119,900 Active 251 DOM
-
2026-06-10days on market $119,900 Active 249 DOM
-
2026-06-09days on market $119,900 Active 248 DOM
-
2026-06-08days on market $119,900 Active 247 DOM
-
2026-06-07days on market $119,900 Active 246 DOM
-
2026-06-05days on market $119,900 Active 243 DOM
-
2026-06-03days on market $119,900 Active 242 DOM
-
2026-06-02days on market $119,900 Active 241 DOM
-
2026-06-01days on market $119,900 Active 240 DOM
-
2026-05-31days on market $119,900 Active 239 DOM
-
2026-05-30days on market $119,900 Active 238 DOM
-
2025-10-06$119,900 Active 353-char remark
Show marketing remark (353 chars)
Look no more, this home is a well-maintained manufactured home located in a +55 senior park community within city limits. This home offers 2bedrooms 2 baths with the convenience of a carport and the peace of mind that comes with a well-cared-for property. Perfect for those looking to enjoy a relaxed lifestyle. Call your favorite realtor for a showing!
-
2025-10-04$119,900 Active
-
2025-01-03soldstatus $115,000 Closed 777-char remark
Show marketing remark (777 chars)
MLS# 279608 Discover the charm of this inviting 55+ community! Located in a peaceful and quiet area, this unit boasts a fantastic location that enhances your living experience. Recent upgrades include a new heat pump/furnace and roof within the last two years, ensuring comfort and reliability. Recent improvements to paint, flooring and much more! Step inside to find beautifully remodeled bathrooms and kitchen, complemented by newer windows that bring in plenty of natural light. Enjoy the convenience of two spacious living areas and ample extra storage. The shade trees surrounding the property add to the serene ambiance. For just $850 per month, your rent covers water, sewer, and garbage. Don’t miss out on this opportunity—call your favorite Realtor today!
-
2024-12-06historical Active Under Contract 777-char remark
Show marketing remark (777 chars)
MLS# 279608 Discover the charm of this inviting 55+ community! Located in a peaceful and quiet area, this unit boasts a fantastic location that enhances your living experience. Recent upgrades include a new heat pump/furnace and roof within the last two years, ensuring comfort and reliability. Recent improvements to paint, flooring and much more! Step inside to find beautifully remodeled bathrooms and kitchen, complemented by newer windows that bring in plenty of natural light. Enjoy the convenience of two spacious living areas and ample extra storage. The shade trees surrounding the property add to the serene ambiance. For just $850 per month, your rent covers water, sewer, and garbage. Don’t miss out on this opportunity—call your favorite Realtor today!
-
2024-10-16$119,500 Active 777-char remark
Show marketing remark (777 chars)
MLS# 279608 Discover the charm of this inviting 55+ community! Located in a peaceful and quiet area, this unit boasts a fantastic location that enhances your living experience. Recent upgrades include a new heat pump/furnace and roof within the last two years, ensuring comfort and reliability. Recent improvements to paint, flooring and much more! Step inside to find beautifully remodeled bathrooms and kitchen, complemented by newer windows that bring in plenty of natural light. Enjoy the convenience of two spacious living areas and ample extra storage. The shade trees surrounding the property add to the serene ambiance. For just $850 per month, your rent covers water, sewer, and garbage. Don’t miss out on this opportunity—call your favorite Realtor today!
-
2024-08-14soldstatus $45,000 Closed
-
2024-08-05historical Active Under Contract
-
2024-08-02$60,000 Active
ⓘ Source: listings_history table (triggers on properties + properties_extension) + one-shot
backfill from property_details.listing_events for pre-trigger history.
Climate risk First Street
- Flood 1/10 Low 0% chance over 30 yrs
- Wildfire 4/10 Moderate
- Heat 5/10 Major 7 d/yr ≥98°F today · 14 d/yr by 30 yrs out
- Wind 1/10 Low
- Air quality 8/10 Severe 14 unhealthy d/yr today · 15 by 30 yrs out
Nearby sold comps map
Loading sold comps map…
Walkable amenities ~0.75 mi
Loading nearby amenities…
Taxation est. · year 1
- Rental income
- $20,671
- − Mortgage interest
- −$6,716
- − Property taxes
- −$1,798
- − Insurance
- −$600
- − Repairs & maintenance
- −$1,654
- − Management
- −$1,654
- − Depreciation
- −$3,488
- Taxable income
- $4,761
- Est. tax owed @ 24.0%
- −$1,143
- After-tax cash flow
- $5,244/yr
For passive investors: Depreciation is non-cash, so a rental often shows a tax loss while cash-flowing — sheltering income. Rental losses are passive: they offset passive income freely, and up to $25,000/yr can offset ordinary (W-2) income if you actively participate and your MAGI is under $100k (phasing out to $0 by $150k); unused losses carry forward. On sale, claimed depreciation is recaptured at up to 25%, and gains may owe capital-gains tax (a 1031 exchange can defer both). Figures are a year-1 estimate at your 24.0% rate — not tax advice; consult a CPA.
Schools (NCES district)
- District
- Kennewick School District
- NCES district ID
- 5303930
- Math proficiency
- 43% ▼ -1.00%
- Reading proficiency
- 58% ▬ 0.00%
- Median HH income
- $54,191
- Composite
- 45.56/100
- National rank
- #5667
- State rank
- #141 of 291 in WA
Livability — Kennewick
- Score
- 78/100
- State rank
- #131
- US rank
- #2599
Category grades
Schools grade is shown separately in the Schools card above.
Census & demographics
- Census place
- Kennewick, WA
- County
- Benton County · 186,895 people
- City population
- 104,655
- Metro
- Kennewick-Richland, WA
- Population (ZIP)
- 50,735
- Household income
- $62,527
- Rent vs Own
- Severe rent burden
- 2605.0
Population outlook (Benton County) Hauer SSP2
- Today (2025)
- 219,421 people
- By 2030
- 233,813 · +6.6%
- By 2040
- 262,134 · +19.5%
- By 2050
- 290,100 · +32.2%
- By 2075
- 363,525 · +65.7%
- By 2100
- 418,667 · +90.8%
Race, ethnicity, and origin ACS 2023
- Neighborhood character
- Diverse neighborhood (Simpson 0.56)
- Race & ethnicity
- White 55% Hispanic / Latino 37% Two or more races 15% Black 3% Asian 2% Native American 1%
- Hispanic origin (detail)
- Mexican 31% Cuban 2%
- Common ancestry
- Portuguese 4% Slovak 3% Romanian 1%
- Foreign-born
- 16% · Canada, Jamaica
- Languages at home
- 68% English-only · Spanish 29% Arabic 1%
Political lean MEDSL · Benton
- 2024 margin
- Strong R (+21.9) · D 37.7% · R 59.6% · Other 2.7%
- 2008→2024 swing
- +4.2pp toward D · 2008: -26.1pp · 2024: -21.9pp
- All cycles
- 2024: R+21.9 2020: R+21.0 2016: R+26.6 2012: R+27.0 2008: R+26.1
Not yet ingested
- Civics
- —
Market trends
- HPI YoY
- ▼ -408.26%
- Current HPI
- 256.1143
- Rent YoY
- ▲ 3.39%
- Metro
- Kennewick-Richland, WA
- State GDP YoY
- ▲ 4.65%
- F500 in state
- 22
Industry mix (Fortune 500 HQ in WA)
| Industry | F500 HQs | Revenue |
|---|---|---|
| Retail | 2 | $269B |
|
||
| Technology / Retail | 1 | $638B |
|
||
| Technology | 1 | $245B |
|
||
| Telecommunications | 1 | $38B |
|
||
| Food / Beverage | 1 | $36B |
|
||
| Automotive / Trucks | 1 | $34B |
|
||
Price history
+99.8% since first listed8 events — show timeline
- 2025-10-06 Listed $119,900 PACMLS
- 2025-10-04 Listed $119,900 NWMLS as Distributed by MLS Grid
- 2025-01-03 Sold (MLS) $115,000 PACMLS
- 2024-12-06 Contingent — PACMLS
- 2024-10-16 Listed $119,500 PACMLS
- 2024-08-14 Sold (MLS) $45,000 PACMLS
- 2024-08-05 Contingent — PACMLS
- 2024-08-02 Listed $60,000 PACMLS
Property tax history
+0.7%/yrLatest (2026): $191 · -5.7% YoY. Source: county tax records.
Cash-flow waterfall
monthlySold comps — $/sqft
last 12 mo · ≤1 miLoading sold comps…