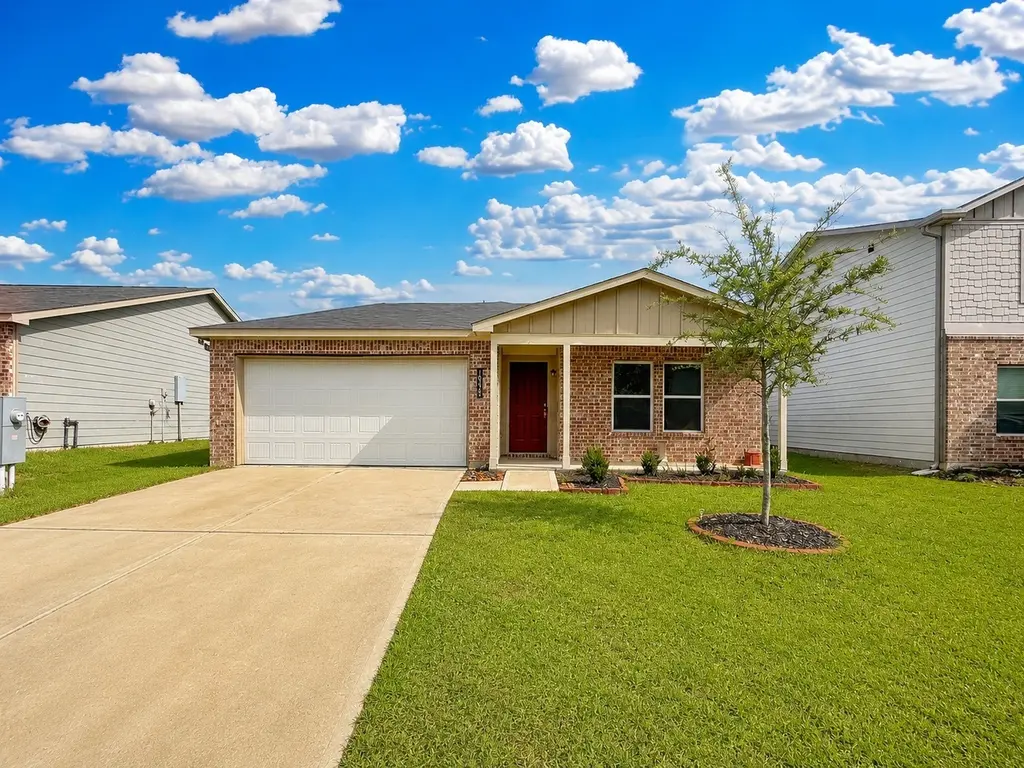
10123 Cerritos Dr · Deerwood, TX
Flood risk 1/10 · Minimal
- FEMA flood zone
- X (unshaded)
- Chance of flooding over 30 yrs
- 0.0%
- Est. flood insurance / yr
- $507 – $1,088
Fire risk 5/10 · Moderate
- Est. fire insurance / yr
- $1,222 – $2,270
Heat risk 8/10 · Major
- Hot days now (above 111°F)
- 7 days/yr
- Hot days in 30 yrs
- 23 days/yr
Wind risk 8/10 · Major
- Chance of severe wind over 30 yrs
- 99.0%
Air-quality risk 2/10 · Minimal
- Unhealthy air days now
- 2 days/yr
- Unhealthy air days in 30 yrs
- 2 days/yr
Risk factors via First Street. Map © Google.
Why this score? — see what drove the D+ grade
The composite is a weighted blend of 9 inputs, each scored 0–100. Each bar is that input's sub-score; the figure is the points it added to the 100-point composite (weight × sub-score).
- Cash flow +12.7/30.0
- ARV discount +11.8/15.0
- Schools +5.1/10.0
- 1% rule +4.0/10.0
- Condition / age +4.0/5.0
- DSCR +3.8/10.0
- Rent growth +2.5/5.0
- Livability +2.5/5.0
- Appreciation +0.0/10.0
$212,000
🖨 Deal sheet (PDF) 📄 Offer letter ✓ Due diligence
Listing remarks
Charming 4-Bedroom Home with Flex Space in Crockett Reserve Built in 2022, this spacious 4-bedroom, 2-bath home offers a modern open-concept design and great potential for the right buyer. Step inside to discover a versatile floor plan featuring a flex room, ideal for a home office, playroom, or creative space. The kitchen boasts granite countertops, stainless steel appliances. Virtual furnishings in photos highlight the home's layout and potential.
Key facts
- Granite countertops
- 4,887 sq ft lot
- 2 garage spots
Tags
Property features AI
Finance
- HOA & community: Crockett Reserve Conroe HOA with annual fee of $470
Exterior
- Parking: Attached 2-car garage
- Utilities: Public water; Public sewer
- Home design: Residential property; Single-story entry (slab foundation); Built in 2022
- Construction: Brick and wood siding construction; Composition roof; Slab foundation
- Exterior features: Subdivision lot
Interior
- Bedrooms: Up to 4 bedrooms
- Bathrooms: 2 full bathrooms
- Heating & cooling: Central heating (electric); Central air conditioning (electric)
- Interior features: 4 total rooms
Neighborhood map
What this means for you Summary
Snapshot
- This is a 4-bed/2.0-bath single-family listed at $212k. Condition is rated good.
Deal economics
- At list price, monthly cash flow is $-23 ($-271/yr) — negative.
- To cash-flow at today's rent, offer at most $208k (1.9% below list).
- To meet the 1% rule (rent ≥ 1% of price), the offer needs to be $190k (10.3% below list).
- Recommended offer: $190k (10.3% below list) — sets the bar for 1% rule.
Location & tenants
- Location reads: area grade D — affects rentability + tenant quality, not the cash-flow math above.
- Conroe ISD (other): math 57% / reading 57% proficiency, ranked #69 of 826 in TX (top 8%) — acceptable for families but not a draw, mixed tenant base, ~2y average lease.
- Zoned schools: Creighton El (math 31% / reading 27%, grade F, #2,668 of 4,322 statewide, top 63%, 940 students, 92% FRL); Moorhead J H (math 35% / reading 42%, grade F, #704 of 1,662 statewide, top 43%, 1,391 students, 82% FRL); Conroe H S (math 32% / reading 51%, grade F, #767 of 1,632 statewide, top 47%, 4,915 students, 61% FRL) — zoned schools average 78% FRL vs 34% district-wide (44 pts higher); higher-poverty schools than district average — tighter screening recommended.
- Zoned-school proficiency averages 36% at this address vs 57% district-wide (-21 pts) — the specific schools serving this property underperform the Conroe ISD average; the district grade overstates school quality for this exact location.
- Market conditions: 416 active listings in the ZIP; 3 comparable units currently listed for rent nearby; rentals at typical pace (median 27d on market — plan ~3-4 weeks tenant-placement turnaround); solid renter incomes; 13,259 units permitted in Montgomery County in 2024 (1,402 in 5+ unit buildings).
Forward outlook
- Local home prices are declining (-3.0%/yr); year-one equity from $1k of loan paydown is wiped out by about $6k of value loss. Plan a longer hold.
- Montgomery County population projected at +65% by 2050 — long-run rental-demand tailwind backs the buy-and-hold thesis.
Negotiation context
- It's been on market 40 days — a 3% lower offer ($206k) is reasonable based on typical stale-listing flexibility.
- 4 sale attempts since 4y ago with the ask held roughly flat each time — persistent listings suggest the price (not the market) is what's stuck; bring a comps-based counter.
Risks & watch-outs
- Climate carrying-cost: severe wind risk, 99% chance of damaging wind over 30y; moderate wildfire risk; extreme-heat days projected 7→23/yr by 2055 (HVAC capex compounding) — expect insurance premiums to compound above CPI over the hold.
Questions for the listing agent
- What do current leases actually rent for vs. the listed asking? Can we see a recent rent roll and the last 12 months of T-12 income?
- It's been on market 40 days. Have you received any prior offers? Is the seller open to a 10% concession, seller financing, or rate buy-down credit?
- What does the HOA fee cover, when was the last increase, and are there any pending special assessments or reserve-fund shortfalls?
- Is there a deadline driving the sale (1031 exchange, divorce, estate, relocation)? That informs how much negotiation room exists.
- The area grade is low — what's the realistic commute time and amenity access for the typical tenant pool here? Any planned neighborhood developments (good or bad) we should know about?
- What's the average days-on-market for RENTAL listings here right now (not sales)? A rising rental-DOM trend means longer vacancies and softer asking-rent achievability than the comps imply.
- What's the recent tenant-quality profile in this submarket — average credit score on applications, eviction rate, late-payment / NSF rate, and stable-employment percentage? A property-management company in the area should have these aggregated.
- How much new for-sale + rental construction is in the pipeline within 1–3 miles? Heavy new supply typically softens prices + rents 12–24 months out; constrained supply supports both.
Investment metrics
- 1% rule
- 0.90% ✗
- Cap rate
- 6.17%
- Cash-on-cash
- -0.46%
- DSCR
- 0.98
- GRM
- 9.3
CMA / ARV
- ARV (median comp)
- $234,293
- List price
- $212,000
- Delta
- -9.51%
- Verdict
- FAIR
- Comps
- 20 within 1.0 mi
Show comp detail 12 sales within ~0.75 mi
| Address | Dist | Beds/Ba | Sqft | Sold | Price | $/sf | Match |
|---|---|---|---|---|---|---|---|
| 15511 Taylorcrest Dr | 0.12mi | 4/2.0 | 1,471 (-11%) | 9mo | $178,000 | $121 | 69 |
| 15616 Del Norte Dr | 0.45mi | 4/2.0 | 1,603 (-3%) | 7mo | $229,900 | $143 | 69 |
| 15670 Briar Forest Dr | 0.08mi | 4/3.0 | 1,884 (+14%) | 12mo | $245,000 | $130 | 58 |
| 10719 Red Flagstone Dr | 0.64mi | 4/2.5 | 1,789 (+9%) | 1mo | $246,900 | $138 | 53 |
| 10707 Red Flagstone Dr | 0.61mi | 3/2.0 (-1) | 1,508 (-8%) | 2mo | $234,900 | $156 | 51 |
| 10743 Red Flagstone Dr | 0.69mi | 4/2.5 | 1,789 (+9%) | 3mo | $229,900 | $129 | 49 |
| 3952 Highline Oaks E | 0.73mi | 3/2.0 (-1) | 1,788 (+9%) | 2mo | $370,000 | $207 | 44 |
| 10734 Red Flagstone Dr | 0.66mi | 4/2.5 | 1,789 (+9%) | 12mo | $237,900 | $133 | 42 |
| 10767 Red Flagstone Dr | 0.74mi | 4/2.5 | 1,789 (+9%) | 9mo | $227,900 | $127 | 41 |
| 10735 Red Flagstone Dr | 0.67mi | 4/2.5 | 1,882 (+14%) | 12mo | $266,900 | $142 | 33 |
| 10750 Red Flagstone Dr | 0.70mi | 4/2.5 | 1,882 (+14%) | 12mo | $253,900 | $135 | 31 |
| 10759 Red Flagstone Dr | 0.73mi | 4/2.5 | 1,882 (+14%) | 12mo | $252,900 | $134 | 30 |
Match score weights: distance 35% · size 25% · config 20% · recency 20%. Top-matched comps best support the ARV.
Projected returns pro-forma
-3.0% appreciation · 3.0% rent growth · sell at horizon
- IRR
- -17.0%
- Equity multiple
- 0.40×
- Total profit
- $-35,724
- Equity at exit
- $31,610
- IRR
- -8.9%
- Equity multiple
- 0.45×
- Total profit
- $-32,692
- Equity at exit
- $18,330
Cash invested: $59,360 (down + closing). Projections, not guarantees.
Landlord ↔ Tenant lean methodology
- Overall (STATE)
- 87 Strongly Landlord-Friendly
- State Texas
- 87 Strongly Landlord-Friendly · R+5
- County
- — inherits STATE
- City
- — inherits STATE
ZIP-level market 77306
- Home prices YoY
- -4.1%
- Active inventory
- 416
- Price-to-rent
- 9.3×
Monthly cashflow live
- Estimated rent
- $1,902 medium interval (Pro) →
- Mortgage (P&I)
- −$1,112
- Tax from tax record
- −$286 /mo · $3,430/yr
- Insurance
- −$88
- HOA
- −$39
- Vacancy / Maint / Mgmt
- −$399
- Net cashflow
- $-23
Break-even live
Sensitivity live
| Price | -10% $97 | -5% $37 | +0% $-23 | +5% $-83 | +10% $-143 |
|---|---|---|---|---|---|
| Rent | -10% $-173 | -5% $-98 | +0% $-23 | +5% $53 | +10% $128 |
| Rate | -1.0pp $84 | -0.5pp $31 | base $-23 | +0.5pp $-77 | +1.0pp $-133 |
UW: 25.0% down · 7.5% · 30yr · 1.5% tax · 5.0% vac · 8.0% maint · 8.0% mgmt
Financing live
Cash to close
- Down payment
- $53,000
- Closing costs
- $6,360
- Reserves months
- —
- Total cash needed
- —
Loan-product check · same deal, 3 products live
Conventional
25% down · 7.5% · 30yr
- Down + closing
- —
- Monthly P&I
- —
- Monthly cashflow
- —
- DSCR
- —
- Eligible?
- —
Personal DTI + credit; lowest rate.
DSCR
20% down · 8.5% · 30yr
- Down + closing
- —
- Monthly P&I
- —
- Monthly cashflow
- —
- DSCR
- —
- Eligible?
- —
No personal income docs; deal must DSCR.
Hard money
10% down · 12.0% · 12mo
- Down + closing
- —
- Monthly P&I
- —
- Monthly cashflow
- —
- DSCR
- —
- Eligible?
- —
Short-term bridge; refi at stabilization.
Rent comps 3 comps
| Address | Beds | Baths | Sqft | Rent | $/sqft | DOM | Units | Dist |
|---|---|---|---|---|---|---|---|---|
| 10050 Cerritos Dr Conroe, TX | 4.0 | 2.0 | 1400 | $1,499 | $1.07 | 26d | 1 | 0.18mi |
| 15743 Del Norte Dr Conroe, TX | 4.0 | 3.0 | 1811 | $1,895 | $1.05 | 45d | 1 | 0.23mi |
| 15581 Briar Forest Dr Conroe, TX | 4.0 | 2.0 | 1400 | $1,545 | $1.10 | 1d | 1 | 0.30mi |
HOA detail
- Monthly dues
- $39 · $468/yr
Listing history 28 events
-
2026-06-21days on market $212,000 Active 40 DOM
-
2026-06-18days on market $212,000 Active 37 DOM
-
2026-06-17days on market $212,000 Active 36 DOM
-
2026-06-16days on market $212,000 Active 35 DOM
-
2026-06-15days on market $212,000 Active 34 DOM
-
2026-06-13pricedays on market $212,000 Active 32 DOM
-
2026-06-09days on market $219,900 Active 28 DOM
-
2026-06-08days on market $219,900 Active 27 DOM
-
2026-06-07days on market $219,900 Active 26 DOM
-
2026-06-04days on market $219,900 Active 23 DOM
-
2026-06-03days on market $219,900 Active 22 DOM
-
2026-06-02days on market $219,900 Active 21 DOM
-
2026-06-01days on market $219,900 Active 20 DOM
-
2026-05-31days on market $219,900 Active 19 DOM
-
2026-05-12$219,900 Active 454-char remark
-
2026-04-07historical
-
2026-02-01price $185,000
-
2026-01-09price $200,000
-
2025-12-19$215,000 Active
-
2025-12-14historical
-
2025-10-30$215,000 Active
-
2023-04-28soldstatus
-
2023-04-27soldstatus Sold
-
2023-02-24status Pending
-
2023-02-16price $239,990
-
2023-01-18price $238,990
-
2023-01-12price $236,990
-
2022-12-22$234,990 Active
ⓘ Source: listings_history table (triggers on properties + properties_extension) + one-shot
backfill from property_details.listing_events for pre-trigger history.
Tax reassessment forecast TX · Resets to sale price
- Current annual tax
- $3,430 · $286/mo
- Projected year-2 tax
- $3,880 · $323/mo
- Expected delta
- +$450/yr (+$37/mo · 13.1%)
ⓘ Screening estimate from a state-policy table — verify with the county assessor before closing.
Climate risk First Street
- Flood 1/10 Low FEMA zone X (unshaded) · 0% chance over 30 yrs
- Wildfire 5/10 Major
- Heat 8/10 Severe 7 d/yr ≥111°F today · 23 d/yr by 30 yrs out
- Wind 8/10 Severe 99% chance of damaging wind over 30 yrs
- Air quality 2/10 Low 2 unhealthy d/yr today · 2 by 30 yrs out
Nearby sold comps map
Loading sold comps map…
Walkable amenities ~0.75 mi
Loading nearby amenities…
Taxation est. · year 1
- Rental income
- $22,821
- − Mortgage interest
- −$11,875
- − Property taxes
- −$3,430
- − Insurance
- −$1,060
- − Repairs & maintenance
- −$1,826
- − Management
- −$1,826
- − HOA
- −$468
- − Depreciation
- −$6,167
- Taxable loss
- −$3,831
- Est. tax savings @ 24.0%
- +$919
- After-tax cash flow
- $649/yr
For passive investors: Depreciation is non-cash, so a rental often shows a tax loss while cash-flowing — sheltering income. Rental losses are passive: they offset passive income freely, and up to $25,000/yr can offset ordinary (W-2) income if you actively participate and your MAGI is under $100k (phasing out to $0 by $150k); unused losses carry forward. On sale, claimed depreciation is recaptured at up to 25%, and gains may owe capital-gains tax (a 1031 exchange can defer both). Figures are a year-1 estimate at your 24.0% rate — not tax advice; consult a CPA.
Condition & rehab AI · 12 photos
This charming 4-bedroom home in Deerwood, TX, built in 2022, offers a modern open-concept design and great potential. The home is in good condition with minimal repairs needed, making it a great investment opportunity.
Value-add opportunities
- Both Painting the exterior and interior walls — Fresh paint enhances curb appeal and interior aesthetics.
- Both Landscaping improvements — Enhances curb appeal and adds value to the property.
- Both Adding smart home features — Improves convenience and adds modern appeal, attracting more buyers and renters.
- Resale Upgrading the kitchen appliances — Modern appliances can increase the home's appeal to potential buyers.
- Rental Adding a smart thermostat — Improves energy efficiency and adds a modern touch, attracting more renters.
Renovation cost estimate screening
Value-add ROI direction
- Both Painting the exterior and interior walls — Fresh paint enhances curb appeal and interior aesthetics. ↑
- Both Landscaping improvements — Enhances curb appeal and adds value to the property. ↑
- Both Adding smart home features — Improves convenience and adds modern appeal, attracting more buyers and renters. ↑
- Resale Upgrading the kitchen appliances — Modern appliances can increase the home's appeal to potential buyers. ↑
- Rental Adding a smart thermostat — Improves energy efficiency and adds a modern touch, attracting more renters. ↑
ⓘ Cost ranges are severity-bucket heuristics (US national rule-of-thumb). Get contractor quotes + a written scope before underwriting a rehab budget.
Schools (NCES district)
- District
- Conroe ISD
- NCES district ID
- 4815000
- Math proficiency
- 57% ▼ -6.00%
- Reading proficiency
- 57% ▼ -1.00%
- Median HH income
- $71,541
- Composite
- 50.65/100
- National rank
- #1833
- State rank
- #69 of 826 in TX
Livability — Deerwood
No livability data for this city. (Only ~50 U.S. cities are tracked.)
Census & demographics
- County
- Montgomery County · 663,713 people
- Metro
- Houston-The Woodlands-Sugar Land, TX
- Population (ZIP)
- 18,086
- Household income
- $76,257
- Rent vs Own
- Severe rent burden
- 231.0
Population outlook (Montgomery County) Hauer SSP2
- Today (2025)
- 713,896 people
- By 2030
- 805,263 · +12.8%
- By 2040
- 992,708 · +39.1%
- By 2050
- 1,179,590 · +65.2%
- By 2075
- 1,628,084 · +128.1%
- By 2100
- 1,937,880 · +171.5%
Race, ethnicity, and origin ACS 2023
- Neighborhood character
- Majority Hispanic (55%)
- Race & ethnicity
- Hispanic / Latino 55% White 41% Two or more races 11% Black 2%
- Hispanic origin (detail)
- Mexican 51%
- Common ancestry
- Iranian 1% Slovak 1% Lithuanian 1%
- Foreign-born
- 21% · Canada
- Languages at home
- 53% English-only · Spanish 45% German/W. Germanic 1%
Political lean MEDSL · Montgomery
- 2024 margin
- Solid R (+45.5) · D 26.8% · R 72.3%
- 2008→2024 swing
- +7.2pp toward D · 2008: -52.7pp · 2024: -45.5pp
- All cycles
- 2024: R+45.5 2020: R+43.8 2016: R+51.4 2012: R+60.7 2008: R+52.7
Not yet ingested
- Civics
- —
Market trends
- HPI YoY
- ▼ -13.02%
- Current HPI
- 306.3801
- Rent YoY
- —
- Metro
- Houston-The Woodlands-Sugar Land, TX
- State GDP YoY
- ▲ 3.95%
- F500 in state
- 110
Industry mix (Fortune 500 HQ in TX)
| Industry | F500 HQs | Revenue |
|---|---|---|
| Energy | 16 | $1,198B |
|
||
| Technology | 5 | $198B |
|
||
| Engineering / Construction | 4 | $72B |
|
||
| Energy Services | 3 | $60B |
|
||
| Utilities | 3 | $41B |
|
||
| Healthcare | 2 | $330B |
|
||
Price history
-9.8% since first listed15 events — show timeline
- 2026-06-11 Price Changed $212,000 HARMLS
- 2026-05-12 Listed $219,900 HARMLS
- 2026-04-07 Listing Removed — HARMLS
- 2026-02-01 Price Changed $185,000 HARMLS
- 2026-01-09 Price Changed $200,000 HARMLS
- 2025-12-19 Listed $215,000 HARMLS
- 2025-12-14 Listing Removed — HARMLS
- 2025-10-30 Listed $215,000 HARMLS
- 2023-04-28 Sold (Public Records) — Public Records
- 2023-04-27 Sold (MLS) — HARMLS
- 2023-02-24 Pending — HARMLS
- 2023-02-16 Price Changed $239,990 HARMLS
- 2023-01-18 Price Changed $238,990 HARMLS
- 2023-01-12 Price Changed $236,990 HARMLS
- 2022-12-22 Listed $234,990 HARMLS
Property tax history
+90.3%/yrLatest (2025): $3,430 · -2.2% YoY. Source: county tax records.
Cash-flow waterfall
monthlySold comps — $/sqft
last 12 mo · ≤1 miLoading sold comps…