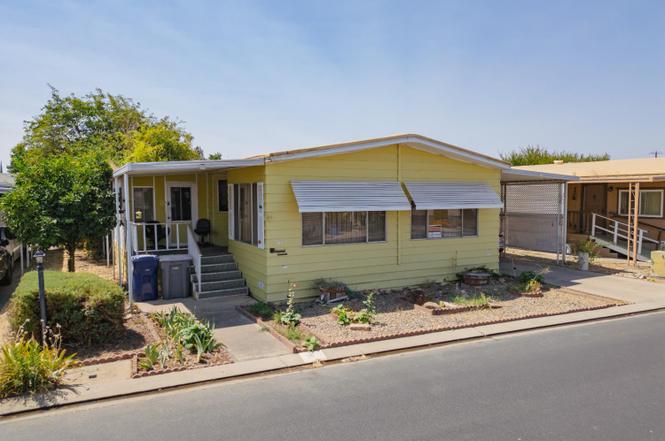
2500 N State Highway 59 #36 · Merced, CA
Flood risk 5/10 · Moderate
- FEMA flood zone
- AO
- Chance of flooding over 30 yrs
- 0.64%
- Est. flood insurance / yr
- $848 – $2,087
Fire risk 1/10 · Minimal
- Est. fire insurance / yr
- $659 – $1,223
Heat risk 7/10 · Major
- Hot days now (above 105°F)
- 7 days/yr
- Hot days in 30 yrs
- 16 days/yr
Wind risk 1/10 · Minimal
- Chance of severe wind over 30 yrs
- —
Air-quality risk 10/10 · Severe
- Unhealthy air days now
- 34 days/yr
- Unhealthy air days in 30 yrs
- 35 days/yr
Risk factors via First Street. Map © Google.
Why this score? — see what drove the C+ grade
The composite is a weighted blend of 9 inputs, each scored 0–100. Each bar is that input's sub-score; the figure is the points it added to the 100-point composite (weight × sub-score).
- Cash flow +30.0/30.0
- 1% rule +10.0/10.0
- DSCR +10.0/10.0
- Livability +3.7/5.0
- Schools +2.8/10.0
- Condition / age +2.5/5.0
- Rent growth +2.3/5.0
- ARV discount +0.4/15.0
- Appreciation +0.0/10.0
$70,000
🖨 Deal sheet (PDF) 📄 Offer letter ✓ Due diligence
Listing remarks
2-Bed, 2-Bath mobile home in a peaceful 55+ community. This bright and inviting residence features a spacious living room with large windows that fill the space with natural light, as well as a separate family room for added comfort. The kitchen offers ample cabinet space, granite countertops, and a functional layout. The primary suite includes mirrored closets, an ensuite bath with a relaxing tub. The second bedroom also enjoys direct access to its own bathroom. Additional highlights include ceiling fans, an indoor laundry room with cabinets, and a welcoming layout designed for easy living. Located in a friendly senior park, this home combines convenience, comfort, and community living.
Key facts
- Large windows
- Primary suite
- Ample cabinet space
Tags
Property features AI
Finance
- Other: Located in a mobile home park (Riviera Holiday Mobile Estates)
- Financial info: Land lease: $610/month
- HOA & community: Senior community; Community has curbs and sidewalks; Manager approval required
Exterior
- Parking: Located in Riviera Holiday Mobile Estates (park name)
- Utilities: Public water (district); No sewer/septic listed
- Home design: Single-story mobile home (Model: SILVERCRESTMA); Mobile home remains on site; Front entry
- Construction: Mobile home, approximately 12 ft by 60 ft; One story
- Exterior features: Lawn; No pool
Interior
- Bedrooms: Entry level: 1
- Bathrooms: 2 full bathrooms
- Heating & cooling: Central furnace (heating)
- Interior features: Ceiling fan; Single-level home with front entry
- Laundry & utility: Laundry inside
Neighborhood map
What this means for you Summary
Snapshot
- This is a 2-bed/2.0-bath manufactured listed at $70k.
Deal economics
- At list price, monthly cash flow is $799 ($10k/yr) — positive.
- The deal already cash-flows at list — no discount required.
- Meets the 1% rule at list price ($2k rent vs $70k).
- Recommended offer: $62k (12.0% below list) — sets the bar for market timing.
- Cap rate 22.1% vs local median 3.4% in Merced — top-decile yield for the area; either an underpriced asset or a hidden risk that comps aren't pricing in. Stress-test before assuming the spread holds.
Location & tenants
- Location reads 73/100 on livability (#153 in CA) — a middle-class / working-renter tenant base. Strengths: amenities A+, commute A+, housing A+; Watch: schools D, employment D, crime F.
- Merced Union High (urban): math 20% / reading 46% proficiency, ranked #301 of 517 in CA (top 58%) — families likely to look elsewhere, expect single-tenant / working-renter base with shorter leases.
- Market conditions: Rents soft (-0.8%/yr); 173 active listings in the ZIP; 16 comparable units currently listed for rent nearby; rentals at typical pace (median 15d on market — plan ~3-4 weeks tenant-placement turnaround); 459 units permitted in Merced County in 2024 (0 in 5+ unit buildings).
- This rent runs 33% of the median local income ($65k/yr) — at the standard rent-burdened threshold; future hikes will face affordability resistance.
Forward outlook
- Local home prices are declining (-3.0%/yr); year-one equity from $484 of loan paydown is wiped out by about $2k of value loss. Plan a longer hold.
- Merced County population projected at +12% by 2050 — modest demand growth; plan on rents tracking national, not racing it.
- At projected returns (-3.0% appreciation + 0.0% rent growth), your $20k cash investment doubles in ~3 years — after that, you're playing with house money.
Negotiation context
- It's been on market 314 days — a 12% lower offer ($62k) is reasonable based on typical stale-listing flexibility.
Risks & watch-outs
- Watch-outs: flood insurance adds $122/mo.
- Climate carrying-cost: in FEMA flood zone AO (mandatory federal flood insurance); extreme-heat days projected 7→16/yr by 2055 (HVAC capex compounding) — expect insurance premiums to compound above CPI over the hold.
Questions for the listing agent
- It's been on market 314 days. Have you received any prior offers? Is the seller open to a 12% concession, seller financing, or rate buy-down credit?
- Built in 1977 — when were the roof, HVAC, electrical panel, plumbing, and water heater last replaced?
- What's the actual annual flood-insurance premium (NFIP or private), and is the property in a SFHA with mandatory coverage?
- Why hasn't it sold? Are there any deal-killer items the seller is aware of (foundation, flood, title, zoning, code violations)?
- Is there a deadline driving the sale (1031 exchange, divorce, estate, relocation)? That informs how much negotiation room exists.
- Schools are D-rated, which usually means shorter tenancies and higher turnover. Who's the typical renter profile here, and what's been the actual vacancy rate?
- Crime grade is F in this area — have there been break-ins, vandalism, or insurance claims at this property in the last 3 years? What carrier currently insures it and at what premium?
- What's the average days-on-market for RENTAL listings here right now (not sales)? A rising rental-DOM trend means longer vacancies and softer asking-rent achievability than the comps imply.
- What's the recent tenant-quality profile in this submarket — average credit score on applications, eviction rate, late-payment / NSF rate, and stable-employment percentage? A property-management company in the area should have these aggregated.
- How much new for-sale + rental construction is in the pipeline within 1–3 miles? Heavy new supply typically softens prices + rents 12–24 months out; constrained supply supports both.
Investment metrics
- 1% rule
- 2.54% ✓
- Cap rate
- 22.08%
- Cash-on-cash
- 56.40%
- DSCR
- 3.51
- GRM
- 3.3
CMA / ARV
- ARV (on-the-fly)
- $60,480
- Comps found
- 1
Show comp detail 1 sale within ~0.75 mi
| Address | Dist | Beds/Ba | Sqft | Sold | Price | $/sf | Match |
|---|---|---|---|---|---|---|---|
| 2500 N Highway 59 #70 | 0.18mi | 3/2.0 (+1) | 1,440 (0%) | 5mo | $61,000 | $42 | 82 |
Match score weights: distance 35% · size 25% · config 20% · recency 20%. Top-matched comps best support the ARV.
Projected returns pro-forma
-3.0% appreciation · 0.0% rent growth · sell at horizon
- IRR
- 42.8%
- Equity multiple
- 2.76×
- Total profit
- $34,429
- Equity at exit
- $10,437
- IRR
- 47.3%
- Equity multiple
- 4.87×
- Total profit
- $75,771
- Equity at exit
- $6,052
Cash invested: $19,600 (down + closing). Projections, not guarantees.
Landlord ↔ Tenant lean methodology
- Overall (STATE)
- 18 Strongly Tenant-Friendly
- State California
- 18 Strongly Tenant-Friendly · D+13
- County
- — inherits STATE
- City
- — inherits STATE
ZIP-level market 95348
- Rents YoY
- -0.8%
- Active inventory
- 173
- Price-to-rent
- 3.3×
Monthly cashflow live
- Estimated rent
- $1,778 high interval (Pro) →
- Mortgage (P&I)
- −$367
- Tax est. 1.5%
- −$88 /mo · $1,050/yr
- Insurance
- −$29
- Flood insurance flood zone
- −$122 /mo · $1,468/yr
- HOA
- −$0
- Vacancy / Maint / Mgmt
- −$373
- Net cashflow
- $799
Break-even live
Sensitivity live
| Price | -10% $847 | -5% $823 | +0% $799 | +5% $775 | +10% $751 |
|---|---|---|---|---|---|
| Rent | -10% $658 | -5% $729 | +0% $799 | +5% $869 | +10% $939 |
| Rate | -1.0pp $834 | -0.5pp $817 | base $799 | +0.5pp $781 | +1.0pp $762 |
UW: 25.0% down · 7.5% · 30yr · 1.5% tax · 5.0% vac · 8.0% maint · 8.0% mgmt
Financing live
Cash to close
- Down payment
- $17,500
- Closing costs
- $2,100
- Reserves months
- —
- Total cash needed
- —
Loan-product check · same deal, 3 products live
Conventional
25% down · 7.5% · 30yr
- Down + closing
- —
- Monthly P&I
- —
- Monthly cashflow
- —
- DSCR
- —
- Eligible?
- —
Personal DTI + credit; lowest rate.
DSCR
20% down · 8.5% · 30yr
- Down + closing
- —
- Monthly P&I
- —
- Monthly cashflow
- —
- DSCR
- —
- Eligible?
- —
No personal income docs; deal must DSCR.
Hard money
10% down · 12.0% · 12mo
- Down + closing
- —
- Monthly P&I
- —
- Monthly cashflow
- —
- DSCR
- —
- Eligible?
- —
Short-term bridge; refi at stabilization.
Rent comps 16 comps
| Address | Beds | Baths | Sqft | Rent | $/sqft | DOM | Units | Dist |
|---|---|---|---|---|---|---|---|---|
| 2908 Willowbrook Dr Unit 2962-28 Merced, CA | 2.0 | 2.0 | 1091 | $1,775 | $1.63 | 22d | 1 | 0.22mi |
| 1935 V St Merced, CA | 3.0 | 2.0 | 1280 | $1,800 | $1.41 | 22d | 1 | 0.44mi |
| 1836 Cheyenne Dr Merced, CA | 3.0 | 2.0 | 1122 | $1,929 | $1.72 | 14d | 1 | 0.54mi |
| 1422 Lansing St Merced, CA | 3.0 | 2.0 | 1187 | $1,900 | $1.60 | 14d | 1 | 0.80mi |
| 1331 Frankfort Ct Merced, CA | 3.0 | 2.0 | 1331 | $1,600 | $1.20 | 14d | 1 | 0.83mi |
| 1859 Heritage Dr Merced, CA | 3.0 | 2.0 | 1022 | $1,700 | $1.66 | 14d | 1 | 0.84mi |
| 3219 Denver Ave Unit 3221 Merced, CA | 3.0 | 2.0 | 1000 | $1,900 | $1.90 | 14d | 1 | 0.86mi |
| 937 W 20th St Unit 937-939 Merced, CA | 3.0 | 2.0 | 1455 | $1,725 | $1.19 | 14d | 1 | 0.95mi |
| 929 W 22nd St Merced, CA | 2.0 | 1.0 | 936 | $1,595 | $1.70 | 14d | 1 | 0.97mi |
| 2029 O St Merced, CA | 3.0 | 1.5 | 1450 | $1,795 | $1.24 | 14d | 1 | 1.07mi |
| 820 W 23rd St Merced, CA | 2.0 | 1.0 | 1014 | $1,750 | $1.73 | 14d | 1 | 1.08mi |
| 2415 O St Unit 2419 Merced, CA | 2.0 | 1.5 | 1000 | $1,500 | $1.50 | 14d | 1 | 1.12mi |
| 3521 San Francisco St Merced, CA | 3.0 | 2.0 | 1830 | $2,100 | $1.15 | 22d | 1 | 1.26mi |
| 925 Loughborough Dr Merced, CA | 1.0–2.0 | 1.0–2.0 | 770 | $1,350 | $1.75 | 14d | 3 | 1.36mi |
| 2929 M St Merced, CA | 2.0 | 2.0 | 1397 | $1,888 | $1.35 | 14d | 1 | 1.42mi |
| 777 Loughborough Dr Merced, CA | 1.0–2.0 | 1.0 | 810 | $1,139 | $1.41 | 14d | 2 | 1.44mi |
Listing history 19 events
-
2026-06-21days on market $70,000 Active 314 DOM
-
2026-06-18days on market $70,000 Active 311 DOM
-
2026-06-17days on market $70,000 Active 310 DOM
-
2026-06-16days on market $70,000 Active 309 DOM
-
2026-06-15days on market $70,000 Active 308 DOM
-
2026-06-14days on market $70,000 Active 306 DOM
-
2026-06-13days on market $70,000 Active 305 DOM
-
2026-06-10days on market $70,000 Active 303 DOM
-
2026-06-09days on market $70,000 Active 302 DOM
-
2026-06-08days on market $70,000 Active 301 DOM
-
2026-06-07days on market $70,000 Active 300 DOM
-
2026-06-03days on market $70,000 Active 296 DOM
-
2026-06-02days on market $70,000 Active 295 DOM
-
2026-06-01days on market $70,000 Active 294 DOM
-
2026-05-31days on market $70,000 Active 293 DOM
-
2026-05-30days on market $70,000 Active 292 DOM
-
2025-12-04price $70,000
-
2025-11-03price $75,000
-
2025-08-11$85,000 Active
ⓘ Source: listings_history table (triggers on properties + properties_extension) + one-shot
backfill from property_details.listing_events for pre-trigger history.
Climate risk First Street
- Flood 5/10 Major FEMA zone AO · 64% chance over 30 yrs
- Wildfire 1/10 Low
- Heat 7/10 Severe 7 d/yr ≥105°F today · 16 d/yr by 30 yrs out
- Wind 1/10 Low
- Air quality 10/10 Extreme 34 unhealthy d/yr today · 35 by 30 yrs out
Nearby sold comps map
Loading sold comps map…
Walkable amenities ~0.75 mi
Loading nearby amenities…
Taxation est. · year 1
- Rental income
- $21,341
- − Mortgage interest
- −$3,921
- − Property taxes
- −$1,050
- − Insurance
- −$1,818
- − Repairs & maintenance
- −$1,707
- − Management
- −$1,707
- − Depreciation
- −$2,036
- Taxable income
- $9,101
- Est. tax owed @ 24.0%
- −$2,184
- After-tax cash flow
- $7,402/yr
For passive investors: Depreciation is non-cash, so a rental often shows a tax loss while cash-flowing — sheltering income. Rental losses are passive: they offset passive income freely, and up to $25,000/yr can offset ordinary (W-2) income if you actively participate and your MAGI is under $100k (phasing out to $0 by $150k); unused losses carry forward. On sale, claimed depreciation is recaptured at up to 25%, and gains may owe capital-gains tax (a 1031 exchange can defer both). Figures are a year-1 estimate at your 24.0% rate — not tax advice; consult a CPA.
Schools (NCES district)
- District
- Merced Union High
- NCES district ID
- 0624660
- Math proficiency
- 20% ▲ 3.00%
- Reading proficiency
- 46% ▼ -1.00%
- Median HH income
- $44,977
- Composite
- 28.11/100
- National rank
- #6823
- State rank
- #301 of 517 in CA
Livability — Merced
- Score
- 73/100
- State rank
- #153
- US rank
- #5111
Category grades
Schools grade is shown separately in the Schools card above.
Census & demographics
- Census place
- Merced, CA
- County
- Merced County · 205,386 people
- City population
- 112,228
- Metro
- Merced, CA
- Population (ZIP)
- 37,540
- Household income
- $64,944
- Rent vs Own
- Severe rent burden
- 1408.0
Population outlook (Merced County) Hauer SSP2
- Today (2025)
- 285,501 people
- By 2030
- 293,437 · +2.8%
- By 2040
- 308,808 · +8.2%
- By 2050
- 321,011 · +12.4%
- By 2075
- 338,497 · +18.6%
- By 2100
- 330,493 · +15.8%
Race, ethnicity, and origin ACS 2023
- Neighborhood character
- Diverse neighborhood (Simpson 0.68)
- Race & ethnicity
- Hispanic / Latino 49% White 23% Asian 16% Two or more races 15% Black 7%
- Hispanic origin (detail)
- Mexican 45%
- Common ancestry
- Russian 2% Lithuanian 1% Italian 1%
- Foreign-born
- 22% · Canada, Guatemala, China
- Languages at home
- 53% English-only · Spanish 32% Other Asian/Pacific 8% Other Indo-European 4%
Political lean MEDSL · Merced
- 2024 margin
- Toss-up / Even · D 46.5% · R 50.9% · Other 2.6%
- 2008→2024 swing
- -12.7pp toward R · 2008: 8.3pp · 2024: -4.4pp
- All cycles
- 2024: R+4.4 2020: D+10.6 2016: D+7.9 2012: D+5.4 2008: D+8.3
Not yet ingested
- Civics
- —
Market trends
- HPI YoY
- ▼ -323.74%
- Current HPI
- 247.7309
- Rent YoY
- ▼ -0.77%
- Metro
- Merced, CA
- State GDP YoY
- ▲ 3.21%
- F500 in state
- 116
Industry mix (Fortune 500 HQ in CA)
| Industry | F500 HQs | Revenue |
|---|---|---|
| Technology | 27 | $1,492B |
|
||
| Financial Services | 3 | $174B |
|
||
| Retail | 3 | $44B |
|
||
| Insurance | 3 | $26B |
|
||
| Media / Entertainment | 2 | $115B |
|
||
| Pharmaceuticals / Biotech | 2 | $62B |
|
||
Price history
-17.6% since first listed3 events — show timeline
- 2025-12-04 Price Changed $70,000 CRMLS
- 2025-11-03 Price Changed $75,000 CRMLS
- 2025-08-11 Listed $85,000 CRMLS
Cash-flow waterfall
monthlySold comps — $/sqft
last 12 mo · ≤1 miLoading sold comps…