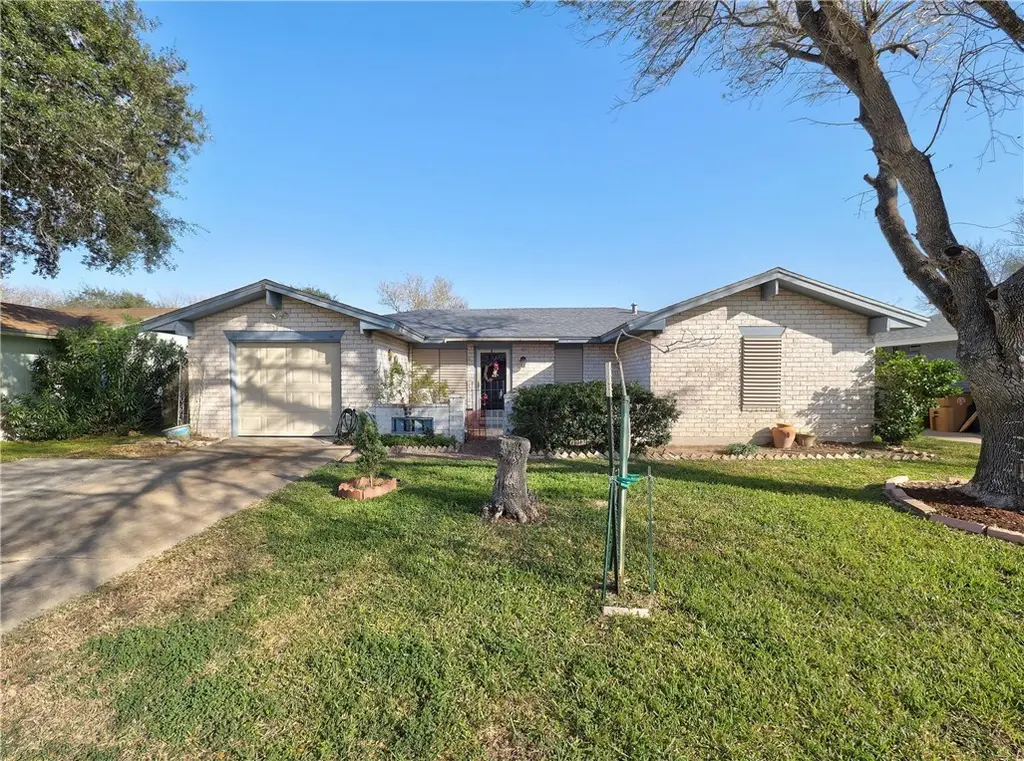
1906 Tara Dr · Corpus Christi, TX
Flood risk 6/10 · Moderate
- FEMA flood zone
- X (unshaded)
- Chance of flooding over 30 yrs
- 0.71%
- Est. flood insurance / yr
- $507 – $1,088
Fire risk 1/10 · Minimal
- Est. fire insurance / yr
- $1,222 – $2,270
Heat risk 10/10 · Severe
- Hot days now (above 107°F)
- 7 days/yr
- Hot days in 30 yrs
- 28 days/yr
Wind risk 9/10 · Severe
- Chance of severe wind over 30 yrs
- 99.0%
Air-quality risk 1/10 · Minimal
- Unhealthy air days now
- 0 days/yr
- Unhealthy air days in 30 yrs
- 0 days/yr
Risk factors via First Street. Map © Google.
Why this score? — see what drove the D grade
The composite is a weighted blend of 9 inputs, each scored 0–100. Each bar is that input's sub-score; the figure is the points it added to the 100-point composite (weight × sub-score).
- ARV discount +11.1/15.0
- Cash flow +11.0/30.0
- Livability +3.9/5.0
- 1% rule +3.8/10.0
- DSCR +3.2/10.0
- Schools +2.8/10.0
- Condition / age +2.5/5.0
- Rent growth +2.1/5.0
- Appreciation +0.0/10.0
$185,000
🖨 Deal sheet 📄 Offer letter ✓ Due diligence
Listing remarks MLS
Cute, cozy, and centrally located — this 1,198 sq ft 3-bedroom, 1.5-bath home is full of charm and ready for its next chapter. Lovingly maintained by its current owner, it offers the kind of warmth and care you can truly feel the moment you step inside. The all-brick exterior provides timeless curb appeal and low-maintenance durability, while the one-car garage adds convenience and extra storage. Inside, you’ll find spacious bedrooms, each featuring its own built-in dressing table — a sweet and practical touch you don’t often see. The layout is comfortable and functional, making great use of every square foot. Step out back to enjoy the screened-in porch — perfect for morning coffee, evening relaxation, or gathering with friends without worrying about the bugs. Beyond that, the backyard offers plenty of room to garden, play, or simply unwind. This is a cute little house with solid bones, thoughtful details, and a price that makes sense. Whether you’re starting out or investing, this well-cared-for home is a fantastic opportunity in a convenient central location.
Key facts
- Screened-in porch
- All brick exterior
- 6,482 sq ft lot
Tags
Neighborhood map
What this means for you Summary
Snapshot
- This is a 3-bed/1.5-bath single-family listed at $185k.
Deal economics
- At list price, monthly cash flow is $-78 ($-932/yr) — negative.
- To cash-flow at today's rent, offer at most $171k (7.4% below list).
- To meet the 1% rule (rent ≥ 1% of price), the offer needs to be $163k (12.0% below list).
- Recommended offer: $163k (12.0% below list) — sets the bar for 1% rule.
- Cap rate 5.8% vs local median 3.6% in Corpus Christi — top-decile yield for the area; either an underpriced asset or a hidden risk that comps aren't pricing in. Stress-test before assuming the spread holds.
Location & tenants
- Location reads 78/100 on livability (#66 in TX, #2,404 nationally) — a middle-class / working-renter tenant base. Strengths: commute A+, cost of living A+, housing A+; Watch: crime F.
- Corpus Christi ISD (urban): math 31% / reading 35% proficiency, ranked #562 of 826 in TX (top 68%) — families likely to look elsewhere, expect single-tenant / working-renter base with shorter leases; 63% free/reduced lunch — lower-income household profile, screen leases tightly.
- Market conditions: Rents soft (-1.5%/yr); 207 active listings in the ZIP; 40 comparable units currently listed for rent nearby; rentals at typical pace (median 21d on market — plan ~3-4 weeks tenant-placement turnaround); 45% of comp listings sitting > 30 days — soft ceiling on asking rent; 1,397 units permitted in Nueces County in 2024 (47 in 5+ unit buildings).
- This rent runs 32% of the median local income ($61k/yr) — at the standard rent-burdened threshold; future hikes will face affordability resistance.
Forward outlook
- Local home prices are declining (-3.0%/yr); year-one equity from $1k of loan paydown is wiped out by about $6k of value loss. Plan a longer hold.
- Nueces County population projected at +36% by 2050 — long-run rental-demand tailwind backs the buy-and-hold thesis.
Negotiation context
- It's been on market 97 days — a 9% lower offer ($168k) is reasonable based on typical stale-listing flexibility.
Risks & watch-outs
- Climate carrying-cost: major flood risk; severe wind risk, 99% chance of damaging wind over 30y; extreme-heat days projected 7→28/yr by 2055 (HVAC capex compounding) — expect insurance premiums to compound above CPI over the hold.
Questions for the listing agent
- What do current leases actually rent for vs. the listed asking? Can we see a recent rent roll and the last 12 months of T-12 income?
- It's been on market 97 days. Have you received any prior offers? Is the seller open to a 12% concession, seller financing, or rate buy-down credit?
- Built in 1974 — when were the roof, HVAC, electrical panel, plumbing, and water heater last replaced?
- Why hasn't it sold? Are there any deal-killer items the seller is aware of (foundation, flood, title, zoning, code violations)?
- Is there a deadline driving the sale (1031 exchange, divorce, estate, relocation)? That informs how much negotiation room exists.
- Crime grade is F in this area — have there been break-ins, vandalism, or insurance claims at this property in the last 3 years? What carrier currently insures it and at what premium?
- The area grade is low — what's the realistic commute time and amenity access for the typical tenant pool here? Any planned neighborhood developments (good or bad) we should know about?
- What's the average days-on-market for RENTAL listings here right now (not sales)? A rising rental-DOM trend means longer vacancies and softer asking-rent achievability than the comps imply.
- What's the recent tenant-quality profile in this submarket — average credit score on applications, eviction rate, late-payment / NSF rate, and stable-employment percentage? A property-management company in the area should have these aggregated.
- How much new for-sale + rental construction is in the pipeline within 1–3 miles? Heavy new supply typically softens prices + rents 12–24 months out; constrained supply supports both.
Investment metrics
- 1% rule
- 0.88% ✗
- Cap rate
- 5.79%
- Cash-on-cash
- -1.80%
- DSCR
- 0.92
- GRM
- 9.5
CMA / ARV
- ARV (median comp)
- $201,291
- List price
- $185,000
- Delta
- -8.09%
- Verdict
- FAIR
- Comps
- 20 within 1.0 mi
Show comp detail 12 sales within ~0.75 mi
| Address | Dist | Beds/Ba | Sqft | Sold | Price | $/sf | Match |
|---|---|---|---|---|---|---|---|
| 1901 Tara Dr | 0.03mi | 3/2.0 | 1,173 (-2%) | 8mo | $212,000 | $181 | 87 |
| 6234 Beechwood Dr | 0.50mi | 3/2.0 | 1,202 (+0%) | 2mo | $179,900 | $150 | 73 |
| 1938 Spencer Dr | 0.14mi | 4/1.0 (+1) | 1,267 (+6%) | 7mo | $189,500 | $150 | 71 |
| 6701 Meadowbreeze Pkwy | 0.41mi | 3/2.0 | 1,204 (+0%) | 9mo | $199,900 | $166 | 71 |
| 1806 Volga Dr | 0.30mi | 3/2.0 | 1,280 (+7%) | 4mo | $249,000 | $195 | 69 |
| 6729 Rhonda Dr | 0.15mi | 3/1.5 | 1,026 (-14%) | 1mo | $190,000 | $185 | 68 |
| 2137 Meadowlight Pkwy | 0.32mi | 3/2.0 | 1,098 (-8%) | 6mo | $150,000 | $137 | 64 |
| 2221 Meadowgrove Dr | 0.38mi | 3/2.0 | 1,282 (+7%) | 11mo | $219,900 | $172 | 59 |
| 2309 Nautical Wind Dr | 0.50mi | 3/2.0 | 1,246 (+4%) | 13mo | $225,000 | $181 | 58 |
| 1650 Pinewood Dr | 0.50mi | 3/2.0 | 1,329 (+11%) | 1mo | $174,900 | $132 | 56 |
| 2302 Tropical Wind Dr | 0.48mi | 3/2.0 | 1,338 (+12%) | 2mo | $240,000 | $179 | 55 |
| 6222 Birchwood Dr | 0.54mi | 3/1.5 | 1,036 (-14%) | 6mo | $204,500 | $197 | 47 |
Match score weights: distance 35% · size 25% · config 20% · recency 20%. Top-matched comps best support the ARV.
Projected returns pro-forma
-3.0% appreciation · 0.0% rent growth · sell at horizon
- IRR
- -22.9%
- Equity multiple
- 0.24×
- Total profit
- $-39,620
- Equity at exit
- $27,584
- IRR
- -28.8%
- Equity multiple
- -0.14×
- Total profit
- $-59,000
- Equity at exit
- $15,995
Cash invested: $51,800 (down + closing). Projections, not guarantees.
Landlord ↔ Tenant lean methodology
- Overall (STATE)
- 87 Strongly Landlord-Friendly
- State Texas
- 87 Strongly Landlord-Friendly · R+5
- County
- — inherits STATE
- City
- — inherits STATE
ZIP-level market 78412
- Rents YoY
- -1.5%
- Active inventory
- 207
- Price-to-rent
- 9.5×
Monthly cashflow live
- Estimated rent
- $1,629 high interval (Pro) →
- Mortgage (P&I)
- −$970
- Tax from tax record
- −$317 /mo · $3,804/yr
- Insurance
- −$77
- HOA
- −$0
- Vacancy / Maint / Mgmt
- −$342
- Net cashflow
- $-78
Break-even live
UW: 25.0% down · 7.5% · 30yr · 1.5% tax · 5.0% vac · 8.0% maint · 8.0% mgmt
Financing live
Cash to close
- Down payment
- $46,250
- Closing costs
- $5,550
- Reserves months
- —
- Total cash needed
- —
Loan-product check · same deal, 3 products live
Conventional
25% down · 7.5% · 30yr
- Down + closing
- —
- Monthly P&I
- —
- Monthly cashflow
- —
- DSCR
- —
- Eligible?
- —
Personal DTI + credit; lowest rate.
DSCR
20% down · 8.5% · 30yr
- Down + closing
- —
- Monthly P&I
- —
- Monthly cashflow
- —
- DSCR
- —
- Eligible?
- —
No personal income docs; deal must DSCR.
Hard money
10% down · 12.0% · 12mo
- Down + closing
- —
- Monthly P&I
- —
- Monthly cashflow
- —
- DSCR
- —
- Eligible?
- —
Short-term bridge; refi at stabilization.
Rent comps 40 comps
| Address | Beds | Baths | Sqft | Rent | $/sqft | DOM | Units | Dist |
|---|---|---|---|---|---|---|---|---|
| 6706 Rhonda Dr Corpus Christi, TX | 2.0 | 1.0 | 1002 | $1,375 | $1.37 | 21d | 1 | 0.08mi |
| 6620 Hardwick Dr Corpus Christi, TX | 2.0 | 1.0 | 1000 | $1,250 | $1.25 | 43d | 1 | 0.09mi |
| 6629 Rhine Dr Unit A Corpus Christi, TX | 3.0 | 2.0 | 1350 | $1,695 | $1.26 | 13d | 1 | 0.10mi |
| 2001 Woodbend Dr Corpus Christi, TX | 2.0–3.0 | 2.0 | 1267 | $2,204 | $1.74 | 13d | 17 | 0.30mi |
| 6433 Aspenwood Dr Corpus Christi, TX | 3.0 | 2.0 | 1465 | $1,750 | $1.19 | 43d | 1 | 0.33mi |
| 6617 Meadowbreeze Pkwy Corpus Christi, TX | 3.0 | 2.0 | 1284 | $1,800 | $1.40 | 44d | 1 | 0.42mi |
| 1622 Woodlawn Dr Corpus Christi, TX | 3.0 | 2.0 | 1152 | $1,895 | $1.64 | 13d | 1 | 0.43mi |
| 6606 Riding Wind Dr Corpus Christi, TX | 3.0 | 2.0 | 1325 | $1,950 | $1.47 | 43d | 1 | 0.47mi |
| 2002 Airline Rd Corpus Christi, TX | 1.0–3.0 | 1.0–2.0 | 794 | $1,440 | $1.81 | 13d | 19 | 0.48mi |
| 1641 Nile Dr Corpus Christi, TX | 1.0–2.0 | 1.0–2.0 | 965 | $1,255 | $1.30 | 13d | 31 | 0.52mi |
| 2333 Nautical Wind Dr Corpus Christi, TX | 3.0 | 2.0 | 1273 | $1,950 | $1.53 | 43d | 1 | 0.57mi |
| 1901 Rodd Field Rd Unit 144 Corpus Christi, TX | 2.0 | 1.0 | 813 | $999 | $1.23 | 43d | 1 | 0.58mi |
| 6136 Hidden Cv Corpus Christi, TX | 2.0 | 1.5 | 1047 | $1,450 | $1.38 | 43d | 1 | 0.63mi |
| 6118 Hidden Cv Corpus Christi, TX | 2.0 | 1.0 | 991 | $1,050 | $1.06 | 43d | 1 | 0.63mi |
| 2058 Hidden Lk Corpus Christi, TX | 2.0 | 1.0 | 991 | $1,200 | $1.21 | 21d | 1 | 0.65mi |
| 6813 Southhaven Dr Corpus Christi, TX | 3.0 | 2.0 | 1129 | $1,699 | $1.50 | 43d | 1 | 0.68mi |
| 6162 Misty Meadow Rd Corpus Christi, TX | 1.0–2.0 | 1.0–2.0 | 729 | $1,185 | $1.62 | 21d | 5 | 0.70mi |
| 1818 Rodd Field Rd Unit B2 Corpus Christi, TX | 2.0 | 2.0 | 1200 | $1,850 | $1.54 | 13d | 1 | 0.78mi |
| 7430 Cessna Dr Corpus Christi, TX | 3.0 | 2.0 | 1370 | $2,000 | $1.46 | 43d | 1 | 0.88mi |
| 2006 Melisa Ln Corpus Christi, TX | 3.0 | 1.0 | 1324 | $1,450 | $1.10 | 21d | 1 | 0.90mi |
| 2006 Melisa Ln Corpus Christi, TX | 3.0 | 1.0 | 1324 | $1,450 | $1.10 | 13d | 1 | 0.90mi |
| 1206 Rickey Dr Corpus Christi, TX | 3.0 | 1.0 | 1131 | $1,100 | $0.97 | 13d | 1 | 0.96mi |
| 7218 S Padre Island Dr Corpus Christi, TX | 1.0–3.0 | 1.0–2.0 | 860 | $1,300 | $1.51 | 13d | 22 | 0.99mi |
| 2706 Grace Cir Unit B Corpus Christi, TX | 3.0 | 2.0 | 1369 | $2,095 | $1.53 | 21d | 1 | 0.99mi |
| 5929 Wooldridge Rd Unit 2906 Corpus Christi, TX | 2.0 | 2.0 | 1100 | $1,000 | $0.91 | 43d | 1 | 1.06mi |
| 5929 Wooldridge Rd Unit 2405 Corpus Christi, TX | 2.0 | 2.0 | 1100 | $1,100 | $1.00 | 43d | 1 | 1.09mi |
| 2805 Summer Ridge Dr Corpus Christi, TX | 3.0 | 2.0 | 1420 | $1,800 | $1.27 | 43d | 1 | 1.16mi |
| 7510 Wooldridge Rd Corpus Christi, TX | 1.0–3.0 | 1.0–2.0 | 1148 | $2,335 | $2.03 | 43d | 1 | 1.16mi |
| 1218 Vance Dr Corpus Christi, TX | 4.0 | 1.5 | 1200 | $1,895 | $1.58 | 43d | 1 | 1.23mi |
| 5750 Curtis Clark Dr Corpus Christi, TX | 2.0 | 1.0–2.0 | 756 | $1,560 | $2.06 | 13d | 20 | 1.23mi |
| 2921 Airline Rd Corpus Christi, TX | 1.0–2.0 | 1.0–2.0 | 982 | $1,664 | $1.69 | 43d | 1 | 1.29mi |
| 1701 Ennis Joslin Rd Corpus Christi, TX | 1.0–3.0 | 1.0–2.0 | 1035 | $2,259 | $2.18 | 13d | 25 | 1.30mi |
| 1515 Ennis Joslin Rd Corpus Christi, TX | 2.0 | 1.0–2.5 | 756 | $1,200 | $1.59 | 13d | 1 | 1.37mi |
| 1011 Ennis Joslin Rd #106 Corpus Christi, TX | 2.0 | 1.5 | 1058 | $1,200 | $1.13 | 43d | 1 | 1.37mi |
| 6225 Saratoga Blvd Corpus Christi, TX | 1.0–3.0 | 1.0–2.0 | 962 | $1,969 | $2.05 | 21d | 27 | 1.39mi |
| 6225 Saratoga Blvd Corpus Christi, TX | 1.0–3.0 | 1.0–2.0 | 962 | $1,969 | $2.05 | 13d | 27 | 1.39mi |
| 1514 Ennis Joslin Rd Corpus Christi, TX | 1.0–3.0 | 1.0–2.0 | 1164 | $2,285 | $1.96 | 13d | 1 | 1.41mi |
| 5921 Riley Dr Corpus Christi, TX | 3.0 | 1.0 | 1134 | $1,795 | $1.58 | 21d | 1 | 1.44mi |
| 7202 Mansions Dr Unit J3 1 Corpus Christi, TX | 2.0 | 2.0 | 1057 | $1,695 | $1.60 | 43d | 1 | 1.44mi |
| 1966 Ennis Joslin Rd Corpus Christi, TX | 2.0 | 2.0 | 986 | $1,767 | $1.79 | 13d | 53 | 1.46mi |
Listing history 8 events
-
2026-06-05days on market $185,000 Active 97 DOM
-
2026-06-03days on market $185,000 Active 96 DOM
-
2026-06-02days on market $185,000 Active 95 DOM
-
2026-06-01days on market $185,000 Active 94 DOM
-
2026-05-31days on market $185,000 Active 93 DOM
-
2026-05-30days on market $185,000 Active 92 DOM
-
2026-02-24$185,000 Active 1114-char remark
Show marketing remark (1114 chars)
Cute, cozy, and centrally located — this 1,198 sq ft 3-bedroom, 1.5-bath home is full of charm and ready for its next chapter. Lovingly maintained by its current owner, it offers the kind of warmth and care you can truly feel the moment you step inside. The all-brick exterior provides timeless curb appeal and low-maintenance durability, while the one-car garage adds convenience and extra storage. Inside, you’ll find spacious bedrooms, each featuring its own built-in dressing table — a sweet and practical touch you don’t often see. The layout is comfortable and functional, making great use of every square foot. Step out back to enjoy the screened-in porch — perfect for morning coffee, evening relaxation, or gathering with friends without worrying about the bugs. Beyond that, the backyard offers plenty of room to garden, play, or simply unwind. This is a cute little house with solid bones, thoughtful details, and a price that makes sense. Whether you’re starting out or investing, this well-cared-for home is a fantastic opportunity in a convenient central location.
-
2001-05-02soldstatus
ⓘ Source: listings_history table (triggers on properties + properties_extension) + one-shot
backfill from property_details.listing_events for pre-trigger history.
Tax reassessment forecast TX · Resets to sale price
- Current annual tax
- $3,804 · $317/mo
- Projected year-2 tax
- $3,804 · $317/mo
- Expected delta
- $0/yr ($0/mo · 0.0%)
ⓘ Screening estimate from a state-policy table — verify with the county assessor before closing.
Climate risk First Street
- Flood 6/10 Major FEMA zone X (unshaded) · 71% chance over 30 yrs
- Wildfire 1/10 Low
- Heat 10/10 Extreme 7 d/yr ≥107°F today · 28 d/yr by 30 yrs out
- Wind 9/10 Extreme 99% chance of damaging wind over 30 yrs
- Air quality 1/10 Low 0 unhealthy d/yr today · 0 by 30 yrs out
Nearby sold comps map
Loading sold comps map…
Walkable amenities ~0.75 mi
Loading nearby amenities…
Taxation est. · year 1
- Rental income
- $19,543
- − Mortgage interest
- −$10,363
- − Property taxes
- −$3,804
- − Insurance
- −$925
- − Repairs & maintenance
- −$1,563
- − Management
- −$1,563
- − Depreciation
- −$5,382
- Taxable loss
- −$4,058
- Est. tax savings @ 24.0%
- +$974
- After-tax cash flow
- $42/yr
For passive investors: Depreciation is non-cash, so a rental often shows a tax loss while cash-flowing — sheltering income. Rental losses are passive: they offset passive income freely, and up to $25,000/yr can offset ordinary (W-2) income if you actively participate and your MAGI is under $100k (phasing out to $0 by $150k); unused losses carry forward. On sale, claimed depreciation is recaptured at up to 25%, and gains may owe capital-gains tax (a 1031 exchange can defer both). Figures are a year-1 estimate at your 24.0% rate — not tax advice; consult a CPA.
Schools (NCES district)
- District
- Corpus Christi ISD
- NCES district ID
- 4815270
- Math proficiency
- 31% ▼ -18.00%
- Reading proficiency
- 35% ▼ -7.00%
- Median HH income
- $45,672
- Composite
- 28.27/100
- National rank
- #6793
- State rank
- #562 of 826 in TX
Livability — Corpus Christi
- Score
- 78/100
- State rank
- #66
- US rank
- #2404
Category grades
Schools grade is shown separately in the Schools card above.
Census & demographics
- Census place
- Corpus Christi, TX
- County
- Nueces County · 296,836 people
- City population
- 296,836
- Metro
- Corpus Christi, TX
- Population (ZIP)
- 38,631
- Household income
- $61,215
- Rent vs Own
- Severe rent burden
- 1932.0
Population outlook (Nueces County) Hauer SSP2
- Today (2025)
- 418,037 people
- By 2030
- 447,123 · +7.0%
- By 2040
- 505,911 · +21.0%
- By 2050
- 567,522 · +35.8%
- By 2075
- 729,686 · +74.6%
- By 2100
- 847,087 · +102.6%
Race, ethnicity, and origin ACS 2023
- Neighborhood character
- Diverse neighborhood (Simpson 0.56)
- Race & ethnicity
- Hispanic / Latino 57% White 34% Two or more races 29% Asian 4% Black 3%
- Hispanic origin (detail)
- Mexican 52%
- Common ancestry
- Slovak 2% Romanian 1% Lithuanian 1%
- Foreign-born
- 8% · Canada, China, Vietnam
- Languages at home
- 74% English-only · Spanish 22% Other Indo-European 1% Vietnamese 1%
Political lean MEDSL · Nueces
- 2024 margin
- R (+11.5) · D 43.8% · R 55.3%
- 2008→2024 swing
- -7.1pp toward R · 2008: -4.4pp · 2024: -11.5pp
- All cycles
- 2024: R+11.5 2020: R+2.9 2016: R+1.5 2012: R+3.2 2008: R+4.4
Not yet ingested
- Civics
- —
Market trends
- HPI YoY
- ▼ -255.29%
- Current HPI
- 177.36
- Rent YoY
- ▼ -1.53%
- Metro
- Corpus Christi, TX
- State GDP YoY
- ▲ 3.95%
- F500 in state
- 110
Industry mix (Fortune 500 HQ in TX)
| Industry | F500 HQs | Revenue |
|---|---|---|
| Energy | 16 | $1,198B |
|
||
| Technology | 5 | $198B |
|
||
| Engineering / Construction | 4 | $72B |
|
||
| Energy Services | 3 | $60B |
|
||
| Utilities | 3 | $41B |
|
||
| Healthcare | 2 | $330B |
|
||
Price history
2 events — show timeline
- 2026-02-24 Listed $185,000 CBMLS
- 2001-05-02 Sold (Public Records) — Public Records
Property tax history
+5.1%/yrLatest (2025): $3,804 · +12.0% YoY. Source: county tax records.
Cash-flow waterfall
monthlySold comps — $/sqft
last 12 mo · ≤1 miLoading sold comps…