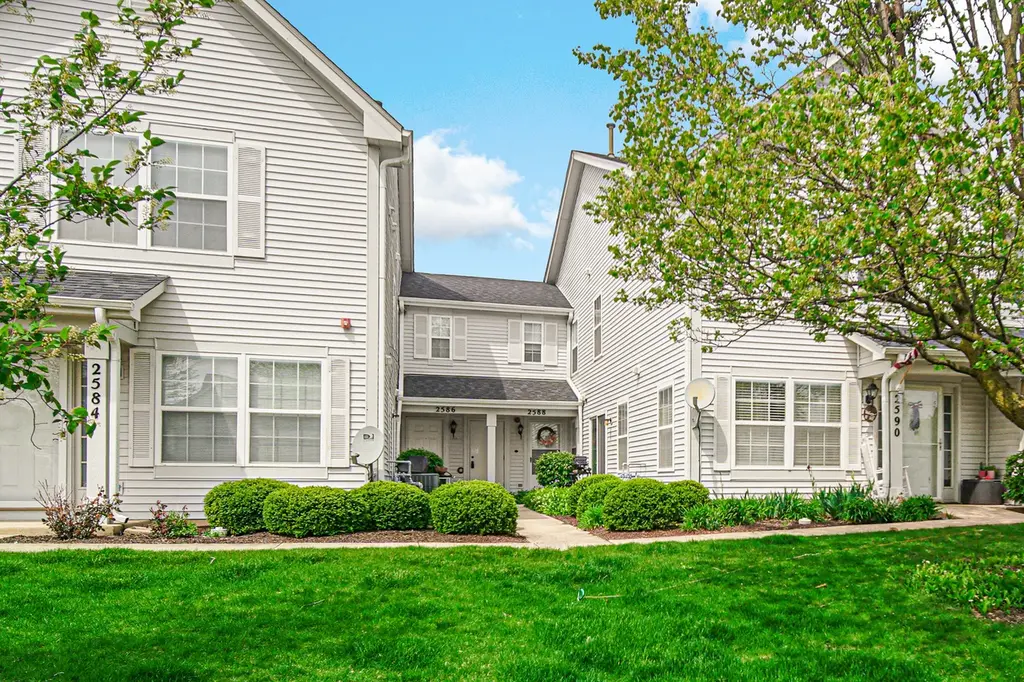
2588 Dickens Ct · Aurora, IL
Flood risk 1/10 · Minimal
- FEMA flood zone
- X (unshaded)
- Chance of flooding over 30 yrs
- 0.0%
- Est. flood insurance / yr
- $507 – $1,088
Fire risk 1/10 · Minimal
- Est. fire insurance / yr
- $804 – $1,492
Heat risk 3/10 · Minor
- Hot days now (above 103°F)
- 7 days/yr
- Hot days in 30 yrs
- 15 days/yr
Wind risk 2/10 · Minimal
- Chance of severe wind over 30 yrs
- 1.0%
Air-quality risk 3/10 · Minor
- Unhealthy air days now
- 3 days/yr
- Unhealthy air days in 30 yrs
- 4 days/yr
Risk factors via First Street. Map © Google.
Why this score? — see what drove the D- grade
The composite is a weighted blend of 9 inputs, each scored 0–100. Each bar is that input's sub-score; the figure is the points it added to the 100-point composite (weight × sub-score).
- Appreciation +10.0/10.0
- Cash flow +6.1/30.0
- ARV discount +5.3/15.0
- Livability +3.8/5.0
- 1% rule +3.4/10.0
- Schools +3.1/10.0
- Rent growth +2.5/5.0
- Condition / age +2.5/5.0
- DSCR +0.4/10.0
$289,000
🖨 Deal sheet (PDF) 📄 Offer letter ✓ Due diligence
Listing remarks MLS
There are no remarks available.
Key facts
- $368 HOA
- Garage
- Built 1998
Property features AI
Finance
- Other: Property currently being leased; Commuter access: school bus service, commuter bus, commuter train, interstate access
- HOA & community: Monthly association fee of $337; Master association fee $380 yearly; Association covers water, insurance, exterior maintenance, lawn care, scavenger, and snow removal; Community park; Pets allowed (cats and dogs OK) with deposits and possible additional pet rent; max pet weight 40 lbs
Exterior
- Parking: Attached garage with garage door opener (1 garage space, 1 total parking); Asphalt driveway
- Utilities: Public water; Public sewer; Electric with circuit breakers
- Home design: Attached single-unit townhouse, 2 stories; Entry level: 1; Condo ownership; Estimated living area
- Construction: Vinyl siding; Asphalt roof; Concrete perimeter foundation; Building about 26–30 years old; Part of a 4-unit building
- Exterior features: Patio
Interior
- Kitchen: Range; Microwave; Dishwasher; Refrigerator; Eating area with breakfast bar and table space
- Bedrooms: Master bedroom on second level (15 x 13); Second bedroom on second level (12 x 10); Two additional bedrooms
- Flooring: Laminate flooring in living/dining areas; Wood laminate in living room and dining room; Ceramic tile in kitchen, eating area, and laundry; Carpet in bedrooms
- Bathrooms: Two full baths; One half bath; Soaking tub
- Heating & cooling: Natural gas forced air heating; Central air conditioning
- Interior features: Separate dining room; Window screens; Ceiling fan(s); CO detectors; 6 total rooms
- Laundry & utility: Washer and dryer included; In-unit laundry on upper level (8 x 6)
Neighborhood map
What this means for you Summary
Snapshot
- This is a 2-bed/2.5-bath townhouse listed at $289k.
Deal economics
- At list price, monthly cash flow is $-540 ($-6k/yr) — negative.
- To cash-flow at today's rent, offer at most $194k (33.0% below list).
- To meet the 1% rule (rent ≥ 1% of price), the offer needs to be $244k (15.7% below list).
- Recommended offer: $194k (33.0% below list) — sets the bar for cash-flow.
Location & tenants
- Location reads 75/100 on livability (#232 in IL, #4,272 nationally) — a middle-class / working-renter tenant base. Strengths: commute A+, housing A+, employment A-; Watch: amenities F, health & safety F.
- CUSD 308 (suburban): math 29% / reading 34% proficiency, ranked #179 of 620 in IL (top 29%) — families likely to look elsewhere, expect single-tenant / working-renter base with shorter leases; only 20% free/reduced lunch — higher-income household profile.
- Zoned schools: Wolfs Crossing Elem School (math 42% / reading 42%, grade F, #336 of 2,056 statewide, top 18%, 485 students, 0% FRL); Bednarcik Junior High School (math 39% / reading 38%, grade F, #154 of 665 statewide, top 24%, 571 students, 0% FRL); Oswego East High School (math 35% / reading 40%, grade F, #104 of 693 statewide, top 15%, 2,836 students, 0% FRL) — zoned schools average 0% FRL vs 20% district-wide (20 pts lower); this property's tenant base skews higher-income than the district average.
- Market conditions: 122 active listings in the ZIP; 40 comparable units currently listed for rent nearby; rentals at typical pace (median 26d on market — plan ~3-4 weeks tenant-placement turnaround); 45% of comp listings sitting > 30 days — soft ceiling on asking rent; high-income renter base; 2,028 units permitted in Will County in 2024 (530 in 5+ unit buildings).
Forward outlook
- In year one you build about $31k of equity ($2k loan paydown + $29k appreciation (10.0% local appreciation)).
- Will County population projected to shrink 4% by 2050 — rents likely to lag national; underwrite the cash flow, not the appreciation.
- By year 2, paydown + projected appreciation supports a ~$50k cash-out refi (75% LTV) — recoverable capital for the next deal without selling this one.
Negotiation context
- It's been on market 26 days — a 2% lower offer ($285k) is reasonable based on typical stale-listing flexibility.
- 5 sale attempts since 2y ago with the ask held roughly flat each time — persistent listings suggest the price (not the market) is what's stuck; bring a comps-based counter.
Questions for the listing agent
- What do current leases actually rent for vs. the listed asking? Can we see a recent rent roll and the last 12 months of T-12 income?
- What does the HOA fee cover, when was the last increase, and are there any pending special assessments or reserve-fund shortfalls?
- Is there a deadline driving the sale (1031 exchange, divorce, estate, relocation)? That informs how much negotiation room exists.
- Schools are F-rated, which usually means shorter tenancies and higher turnover. Who's the typical renter profile here, and what's been the actual vacancy rate?
- The area grade is low — what's the realistic commute time and amenity access for the typical tenant pool here? Any planned neighborhood developments (good or bad) we should know about?
- What's the average days-on-market for RENTAL listings here right now (not sales)? A rising rental-DOM trend means longer vacancies and softer asking-rent achievability than the comps imply.
- What's the recent tenant-quality profile in this submarket — average credit score on applications, eviction rate, late-payment / NSF rate, and stable-employment percentage? A property-management company in the area should have these aggregated.
- How much new for-sale + rental construction is in the pipeline within 1–3 miles? Heavy new supply typically softens prices + rents 12–24 months out; constrained supply supports both.
Investment metrics
- 1% rule
- 0.84% ✗
- Cap rate
- 4.05%
- Cash-on-cash
- -8.01%
- DSCR
- 0.64
- GRM
- 9.9
CMA / ARV
- ARV (on-the-fly)
- $275,416
- Comps found
- 5
Show comp detail 5 sales within ~0.75 mi
| Address | Dist | Beds/Ba | Sqft | Sold | Price | $/sf | Match |
|---|---|---|---|---|---|---|---|
| 2509 Dickens Dr | 0.19mi | 3/2.5 (+1) | 1,384 (0%) | 12mo | $275,000 | $199 | 76 |
| 2487 Dickens Dr | 0.21mi | 2/2.5 | 1,384 (0%) | 24mo | $258,000 | $186 | 70 |
| 2411 Dickens Dr | 0.21mi | 3/2.5 (+1) | 1,366 (-1%) | 19mo | $270,000 | $198 | 67 |
| 2331 Georgetown Cir | 0.70mi | 2/2.5 | 1,426 (+3%) | 17mo | $290,000 | $203 | 48 |
| 2049 Sunrise Cir | 0.75mi | 2/2.5 | 1,266 (-8%) | 11mo | $280,000 | $221 | 42 |
Match score weights: distance 35% · size 25% · config 20% · recency 20%. Top-matched comps best support the ARV.
Projected returns pro-forma
10.0% appreciation · 3.0% rent growth · sell at horizon
- IRR
- 18.7%
- Equity multiple
- 2.52×
- Total profit
- $123,320
- Equity at exit
- $260,354
- IRR
- 17.4%
- Equity multiple
- 5.83×
- Total profit
- $390,856
- Equity at exit
- $561,463
Cash invested: $80,920 (down + closing). Projections, not guarantees.
Landlord ↔ Tenant lean methodology
- Overall (STATE)
- 43 Moderately Tenant-Leaning
- State Illinois
- 43 Moderately Tenant-Leaning · D+7
- County
- — inherits STATE
- City
- — inherits STATE
ZIP-level market 60503
- Home prices YoY
- 4.6%
- Active inventory
- 122
- Price-to-rent
- 9.9×
Monthly cashflow live
- Estimated rent
- $2,437 high interval (Pro) →
- Mortgage (P&I)
- −$1,516
- Tax from tax record
- −$461 /mo · $5,536/yr
- Insurance
- −$120
- HOA
- −$368
- Vacancy / Maint / Mgmt
- −$512
- Net cashflow
- $-540
Break-even live
Sensitivity live
| Price | -10% $-377 | -5% $-458 | +0% $-540 | +5% $-622 | +10% $-704 |
|---|---|---|---|---|---|
| Rent | -10% $-733 | -5% $-636 | +0% $-540 | +5% $-444 | +10% $-348 |
| Rate | -1.0pp $-395 | -0.5pp $-467 | base $-540 | +0.5pp $-615 | +1.0pp $-691 |
UW: 25.0% down · 7.5% · 30yr · 1.5% tax · 5.0% vac · 8.0% maint · 8.0% mgmt
Financing live
Cash to close
- Down payment
- $72,250
- Closing costs
- $8,670
- Reserves months
- —
- Total cash needed
- —
Loan-product check · same deal, 3 products live
Conventional
25% down · 7.5% · 30yr
- Down + closing
- —
- Monthly P&I
- —
- Monthly cashflow
- —
- DSCR
- —
- Eligible?
- —
Personal DTI + credit; lowest rate.
DSCR
20% down · 8.5% · 30yr
- Down + closing
- —
- Monthly P&I
- —
- Monthly cashflow
- —
- DSCR
- —
- Eligible?
- —
No personal income docs; deal must DSCR.
Hard money
10% down · 12.0% · 12mo
- Down + closing
- —
- Monthly P&I
- —
- Monthly cashflow
- —
- DSCR
- —
- Eligible?
- —
Short-term bridge; refi at stabilization.
Rent comps 40 comps
| Address | Beds | Baths | Sqft | Rent | $/sqft | DOM | Units | Dist |
|---|---|---|---|---|---|---|---|---|
| 2565 Dickens Ct Aurora, IL | 2.0 | 2.5 | 1116 | $2,300 | $2.06 | 45d | 1 | 0.06mi |
| 2554 Dickens Dr Aurora, IL | 2.0 | 2.5 | 1116 | $2,050 | $1.84 | 26d | 1 | 0.09mi |
| 2552 Dickens Dr Unit 2552 Aurora, IL | 2.0 | 2.0 | 1120 | $2,150 | $1.92 | 45d | 1 | 0.09mi |
| 2454 Frost Dr Unit 2454 Aurora, IL | 2.0 | 2.5 | 1230 | $2,300 | $1.87 | 45d | 1 | 0.18mi |
| 2873 Carlsbad Cir Aurora, IL | 3.0 | 2.5 | 1626 | $2,990 | $1.84 | 45d | 1 | 0.18mi |
| 2503 Dickens Dr #2503 Aurora, IL | 2.0 | 2.0 | 1150 | $2,050 | $1.78 | 45d | 1 | 0.21mi |
| 2550 Providence Ave Aurora, IL | 2.0 | 2.5 | 1550 | $2,300 | $1.48 | 45d | 1 | 0.74mi |
| 2531 Congress Ave #2531 Aurora, IL | 3.0 | 2.5 | 1532 | $2,500 | $1.63 | 45d | 1 | 0.77mi |
| 2270 Georgetown Cir Unit 2270 Aurora, IL | 3.0 | 2.5 | 1533 | $2,800 | $1.83 | 45d | 1 | 0.81mi |
| 2460 Georgetown Cir Aurora, IL | 2.0 | 2.5 | 1532 | $2,400 | $1.57 | 3d | 1 | 0.81mi |
| 260 Devoe Dr Oswego, IL | 3.0 | 2.5 | 1704 | $2,400 | $1.41 | 14d | 1 | 0.85mi |
| 2575 Hillsboro Blvd Aurora, IL | 3.0 | 2.5 | 1530 | $2,500 | $1.63 | 45d | 1 | 0.86mi |
| 2598 Hillsboro Blvd Aurora, IL | 3.0 | 2.5 | 1482 | $2,395 | $1.62 | 22d | 1 | 0.89mi |
| 2516 Hillsboro Blvd Aurora, IL | 2.0 | 2.5 | 1482 | $2,300 | $1.55 | 19d | 1 | 0.93mi |
| 337 Devoe Dr #337 Oswego, IL | 3.0 | 2.5 | 1500 | $2,600 | $1.73 | 26d | 1 | 0.98mi |
| 347 Devoe Dr Oswego, IL | 3.0 | 2.5 | 1520 | $2,595 | $1.71 | 14d | 1 | 1.00mi |
| 2000 Emblem Cir Oswego, IL | 1.0–2.0 | 1.0–2.0 | 966 | $2,362 | $2.45 | 0d | 29 | 1.01mi |
| 2205 Daybreak Dr #2205 Aurora, IL | 2.0 | 2.5 | 1700 | $2,500 | $1.47 | 6d | 1 | 1.02mi |
| 2226 Daybreak Dr #2226 Aurora, IL | 3.0 | 2.5 | 1627 | $2,500 | $1.54 | 45d | 1 | 1.02mi |
| 4462 Monroe Ct Naperville, IL | 2.0 | 2.5 | 1783 | $3,400 | $1.91 | 45d | 1 | 1.05mi |
| 4456 Monroe Ct Naperville, IL | 2.0 | 2.5 | 1588 | $2,795 | $1.76 | 45d | 1 | 1.06mi |
| 4456 Monroe Ct Naperville, IL | 2.0 | 2.5 | 1588 | $2,795 | $1.76 | 13d | 1 | 1.06mi |
| 4456 Monroe Ct Naperville, IL | 2.0 | 2.5 | 1600 | $2,850 | $1.78 | 3d | 1 | 1.06mi |
| 4475 Monroe Ct Naperville, IL | 2.0 | 2.5 | 1555 | $3,100 | $1.99 | 0d | 1 | 1.07mi |
| 4444 Monroe Ct Naperville, IL | 3.0 | 2.5 | 1783 | $3,300 | $1.85 | 0d | 1 | 1.07mi |
| 4444 Monroe Ct Unit 4444 Naperville, IL | 3.0 | 2.5 | 1783 | $3,300 | $1.85 | 3d | 1 | 1.07mi |
| 2909 Madison Dr Naperville, IL | 3.0 | 2.5 | 1783 | $3,095 | $1.74 | 20d | 1 | 1.10mi |
| 2923 Madison Dr Naperville, IL | 2.0 | 2.5 | 1550 | $2,550 | $1.65 | 23d | 1 | 1.10mi |
| 2933 Madison Dr Naperville, IL | 2.0 | 2.5 | 1783 | $3,000 | $1.68 | 11d | 1 | 1.11mi |
| 2995 Madison Dr Naperville, IL | 2.0 | 2.5 | 1793 | $3,000 | $1.67 | 13d | 1 | 1.18mi |
| 246 Cooney Way Oswego, IL | 3.0 | 2.5 | 1767 | $2,800 | $1.58 | 45d | 1 | 1.32mi |
| 2337 Summerlin Dr Aurora, IL | 3.0 | 1.5 | 1700 | $2,500 | $1.47 | 45d | 1 | 1.36mi |
| 690 Lincoln Station Dr Oswego, IL | 3.0 | 2.5 | 1318 | $2,100 | $1.59 | 4d | 1 | 1.36mi |
| 2333 Summerlin Dr #2333 Aurora, IL | 2.0 | 2.0 | 1572 | $2,500 | $1.59 | 45d | 1 | 1.36mi |
| 669 Lincoln Station Dr #669 Oswego, IL | 3.0 | 2.5 | 1315 | $2,250 | $1.71 | 22d | 1 | 1.41mi |
| 652 Lincoln Station Dr Oswego, IL | 3.0 | 2.5 | 1500 | $1,999 | $1.33 | 19d | 1 | 1.45mi |
| 652 Lincoln Station Dr Oswego, IL | 3.0 | 2.5 | 1500 | $1,999 | $1.33 | 5d | 1 | 1.45mi |
| 1914 Spinnaker Ct Aurora, IL | 3.0 | 2.5 | 1412 | $3,000 | $2.12 | 45d | 1 | 1.46mi |
| 644 Lincoln Station Dr #644 Oswego, IL | 3.0 | 2.5 | 1318 | $2,250 | $1.71 | 45d | 1 | 1.47mi |
| 640 Lincoln Station Dr Oswego, IL | 2.0 | 2.5 | 1318 | $2,100 | $1.59 | 45d | 1 | 1.47mi |
HOA detail
- Monthly dues
- $368 · $4,416/yr
Listing history 32 events
-
2026-06-21days on market $289,000 Active 26 DOM
-
2026-06-18days on market $289,000 Active 23 DOM
-
2026-06-17days on market $289,000 Active 22 DOM
-
2026-06-16days on market $289,000 Active 21 DOM
-
2026-06-15days on market $289,000 Active 20 DOM
-
2026-06-13days on market $289,000 Active 18 DOM
-
2026-06-09days on market $289,000 Active 14 DOM
-
2026-06-08days on market $289,000 Active 13 DOM
-
2026-06-07days on market $289,000 Active 12 DOM
-
2026-06-04days on market $289,000 Active 9 DOM
-
2026-06-03days on market $289,000 Active 8 DOM
-
2026-06-02days on market $289,000 Active 7 DOM
-
2026-06-01days on market $289,000 Active 6 DOM
-
2026-05-31days on market $289,000 Active 5 DOM
-
2026-05-21historical $289,000
-
2025-06-04historical $2,345
-
2025-05-20price $2,345
-
2025-05-09$2,350
-
2025-05-08historical $2,390
-
2025-04-16price $2,390
-
2025-04-02$2,400
-
2024-05-24historical $2,300
-
2024-05-08soldstatus $255,000
-
2024-05-03price $2,300
-
2024-04-30price $2,301
-
2024-04-27$2,300
-
2024-04-25soldstatus $255,000 Closed 31-char remark
Show marketing remark (31 chars)
There are no remarks available.
-
2024-03-25historical Contingent - Continue to Show 31-char remark
Show marketing remark (31 chars)
There are no remarks available.
-
2024-03-22$235,000 Active 31-char remark
Show marketing remark (31 chars)
There are no remarks available.
-
2017-04-17soldstatus $356,100
-
2004-07-07soldstatus $144,500
-
2002-06-25soldstatus $128,500
ⓘ Source: listings_history table (triggers on properties + properties_extension) + one-shot
backfill from property_details.listing_events for pre-trigger history.
Tax reassessment forecast IL · Partial reset (capped growth)
- Current annual tax
- $5,536 · $461/mo
- Projected year-2 tax
- $6,048 · $504/mo
- Expected delta
- +$512/yr (+$43/mo · 9.3%)
ⓘ Screening estimate from a state-policy table — verify with the county assessor before closing.
Climate risk First Street
- Flood 1/10 Low FEMA zone X (unshaded) · 0% chance over 30 yrs
- Wildfire 1/10 Low
- Heat 3/10 Moderate 7 d/yr ≥103°F today · 15 d/yr by 30 yrs out
- Wind 2/10 Low 100% chance of damaging wind over 30 yrs
- Air quality 3/10 Moderate 3 unhealthy d/yr today · 4 by 30 yrs out
Nearby sold comps map
Loading sold comps map…
Walkable amenities ~0.75 mi
Loading nearby amenities…
Taxation est. · year 1
- Rental income
- $29,243
- − Mortgage interest
- −$16,188
- − Property taxes
- −$5,536
- − Insurance
- −$1,445
- − Repairs & maintenance
- −$2,339
- − Management
- −$2,339
- − HOA
- −$4,416
- − Depreciation
- −$8,407
- Taxable loss
- −$11,429
- Est. tax savings @ 24.0%
- +$2,743
- After-tax cash flow
- $-3,739/yr
For passive investors: Depreciation is non-cash, so a rental often shows a tax loss while cash-flowing — sheltering income. Rental losses are passive: they offset passive income freely, and up to $25,000/yr can offset ordinary (W-2) income if you actively participate and your MAGI is under $100k (phasing out to $0 by $150k); unused losses carry forward. On sale, claimed depreciation is recaptured at up to 25%, and gains may owe capital-gains tax (a 1031 exchange can defer both). Figures are a year-1 estimate at your 24.0% rate — not tax advice; consult a CPA.
Schools (NCES district)
- District
- CUSD 308
- NCES district ID
- 1730270
- Math proficiency
- 29% ▼ -10.00%
- Reading proficiency
- 34% ▼ -9.00%
- Median HH income
- $89,945
- Composite
- 31.25/100
- National rank
- #6028
- State rank
- #179 of 620 in IL
Livability — Aurora
- Score
- 75/100
- State rank
- #232
- US rank
- #4272
Category grades
Schools grade is shown separately in the Schools card above.
Census & demographics
- Census place
- Aurora, IL
- County
- Will County · 412,448 people
- City population
- 186,692
- Metro
- Chicago-Naperville-Elgin, IL-IN-WI
- Population (ZIP)
- 16,789
- Household income
- $136,726
- Rent vs Own
- Severe rent burden
- 19.0
Population outlook (Will County) Hauer SSP2
- Today (2025)
- 705,368 people
- By 2030
- 708,154 · +0.4%
- By 2040
- 702,692 · -0.4%
- By 2050
- 680,249 · -3.6%
- By 2075
- 611,990 · -13.2%
- By 2100
- 516,215 · -26.8%
Race, ethnicity, and origin ACS 2023
- Neighborhood character
- Diverse neighborhood (Simpson 0.69)
- Race & ethnicity
- White 49% Asian 19% Black 14% Hispanic / Latino 14% Two or more races 7%
- Hispanic origin (detail)
- Mexican 11% Puerto Rican 1%
- Common ancestry
- Romanian 10% Scandinavian 3% Italian 1%
- Foreign-born
- 22% · Canada, China, Vietnam
- Languages at home
- 68% English-only · Other Indo-European 11% Spanish 8% Other Asian/Pacific 4%
Political lean MEDSL · Will
- 2024 margin
- Toss-up / Even · D 50.1% · R 48.5% · Other 1.4%
- 2008→2024 swing
- -11.6pp toward R · 2008: 13.2pp · 2024: 1.6pp
- All cycles
- 2024: D+1.6 2020: D+8.3 2016: D+5.7 2012: D+3.7 2008: D+13.2
Not yet ingested
- Civics
- —
Market trends
- HPI YoY
- ▲ 10.31%
- Current HPI
- 232.382
- Rent YoY
- —
- Metro
- Chicago-Naperville-Elgin, IL-IN-WI
- State GDP YoY
- ▲ 1.59%
- F500 in state
- 60
Industry mix (Fortune 500 HQ in IL)
| Industry | F500 HQs | Revenue |
|---|---|---|
| Insurance | 4 | $201B |
|
||
| Consumer Goods | 4 | $87B |
|
||
| Industrial Machinery | 3 | $64B |
|
||
| Healthcare | 2 | $55B |
|
||
| Retail / Pharmacy | 1 | $148B |
|
||
| Agriculture / Food | 1 | $86B |
|
||
Price history
+124.9% since first listed19 events — show timeline
- 2026-05-26 Listed $289,000 MRED as Distributed by MLS Grid
- 2026-05-21 Coming Soon $289,000 MRED as Distributed by MLS Grid
- 2025-06-04 Rental Removed $2,345 MRED
- 2025-05-20 Price Changed $2,345 MRED
- 2025-05-09 Listed for Rent $2,350 MRED
- 2025-05-08 Rental Removed $2,390 MRED
- 2025-04-16 Price Changed $2,390 MRED
- 2025-04-02 Listed for Rent $2,400 MRED
- 2024-05-24 Rental Removed $2,300 MRED
- 2024-05-08 Sold (Public Records) $255,000 Public Records
- 2024-05-03 Price Changed $2,300 MRED
- 2024-04-30 Price Changed $2,301 MRED
- 2024-04-27 Listed for Rent $2,300 MRED
- 2024-04-25 Sold (MLS) $255,000 MRED as Distributed by MLS Grid
- 2024-03-25 Contingent — MRED as Distributed by MLS Grid
- 2024-03-22 Listed $235,000 MRED as Distributed by MLS Grid
- 2017-04-17 Sold (Public Records) $356,100 Public Records
- 2004-07-07 Sold (Public Records) $144,500 Public Records
- 2002-06-25 Sold (Public Records) $128,500 Public Records
Property tax history
+1.5%/yrLatest (2024): $5,536 · +5.3% YoY. Source: county tax records.
Cash-flow waterfall
monthlySold comps — $/sqft
last 12 mo · ≤1 miLoading sold comps…