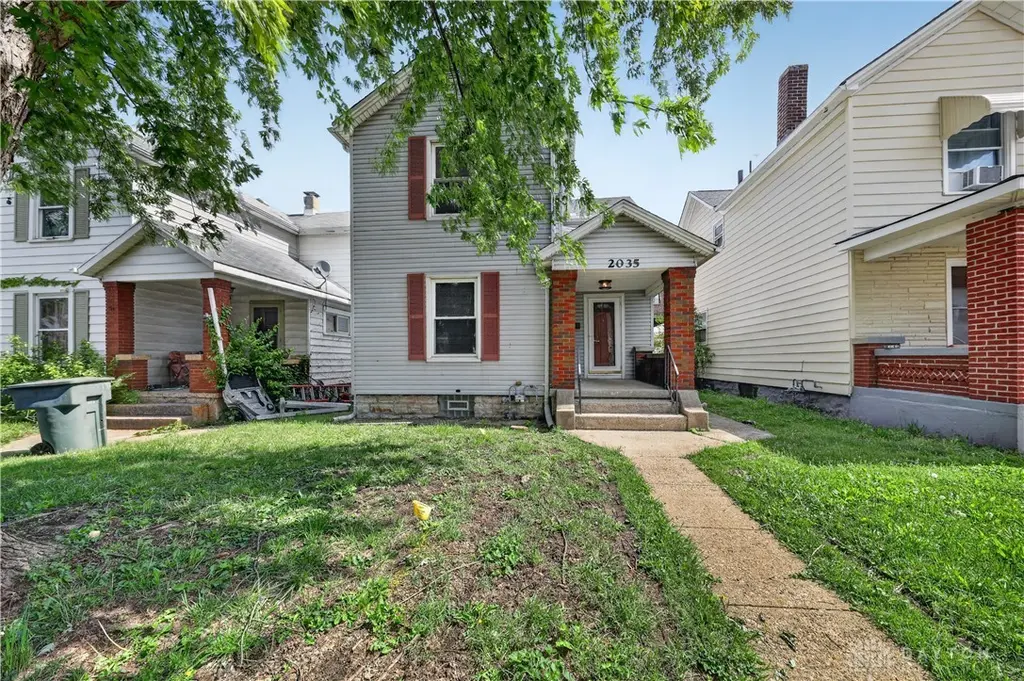
2035 Stapleton Ct · Dayton, OH
Flood risk 1/10 · Minimal
- FEMA flood zone
- X (unshaded)
- Chance of flooding over 30 yrs
- 0.0%
- Est. flood insurance / yr
- $473 – $860
Fire risk 1/10 · Minimal
- Est. fire insurance / yr
- $713 – $1,323
Heat risk 4/10 · Minor
- Hot days now (above 102°F)
- 7 days/yr
- Hot days in 30 yrs
- 19 days/yr
Wind risk 2/10 · Minimal
- Chance of severe wind over 30 yrs
- —
Air-quality risk 3/10 · Minor
- Unhealthy air days now
- 2 days/yr
- Unhealthy air days in 30 yrs
- 4 days/yr
Risk factors via First Street. Map © Google.
Why this score? — see what drove the D grade
The composite is a weighted blend of 9 inputs, each scored 0–100. Each bar is that input's sub-score; the figure is the points it added to the 100-point composite (weight × sub-score).
- Cash flow +17.8/30.0
- ARV discount +8.0/15.0
- DSCR +5.6/10.0
- 1% rule +4.1/10.0
- Livability +3.2/5.0
- Rent growth +2.5/5.0
- Condition / age +2.5/5.0
- Schools +1.3/10.0
- Appreciation +0.0/10.0
$124,900
🖨 Deal sheet (PDF) 📄 Offer letter ✓ Due diligence
Listing remarks MLS
Look no further for a stunning 2 ST. featuring brick columns outlining the cov. porch. 2 car det. Gar w/ opener w/ wifi. Alley access. Fenced yd. Welcome thru a red steel door w/ reinforced oak door panels. Slate foyer entry floor. Window from the turn of the century. Living rm w/ nostalgic fp. All floors woodlike vinyl. Replaced base boards in white. All vinyl dbl hung windows. New lights fixtures or paddle fans. Dining rm w/ refin. built-in hutch. Doors either new or refinished thruout. Kitchen huge for this home, lots of refurbished walnut wood cabinets 2-tone painted, under cab. lights, & new flooring. But, the best feature, a SS 5 burner ceramic top range w/ convection oven, SS dbl door w/ ice refrig. , new Kohler faucet, gar. dis. Partial base w/ 2014 95% eff. Trane furnace & AC. New laundry tub. W/ D stay. Glass block windows. All painted 3 bedrms, new flooring, new or ref. doors, and rem. bath. All blinds . Mud rm to backyd & 2-car gar. entrance. Landscaping. Impressive & Immaculate.
Key facts
- Private patio
- Efficient layout
- Welcoming porch
Tags
Property features AI
Finance
- Financial info: Offered for sale
Exterior
- Parking: Detached 2-car garage
- Home design: 2-story single-family home
- Construction: Frame construction with vinyl and wood siding
- Exterior features: Residential zoning; Lot dimensions approximately 31 x 112
Interior
- Kitchen: Range; Refrigerator
- Bedrooms: Second-floor bedroom (8 x 8); Second-floor bedroom (12 x 12)
- Bathrooms: 1 full bathroom
- Heating & cooling: Forced air heating; Central air conditioning
- Interior features: Finished partial basement; Decorative fireplace; Total of 6 rooms
Neighborhood map
What this means for you Summary
Snapshot
- This is a 3-bed/1.0-bath single-family listed at $125k.
Deal economics
- At list price, monthly cash flow is $102 ($1k/yr) — positive.
- The deal already cash-flows at list — no discount required.
- To meet the 1% rule (rent ≥ 1% of price), the offer needs to be $113k (9.2% below list).
- Recommended offer: $113k (9.2% below list) — sets the bar for 1% rule.
Location & tenants
- Location reads 65/100 on livability (#716 in OH) — a middle-class / working-renter tenant base. Strengths: cost of living A+, housing A+, health & safety A; Watch: amenities C-, crime F, commute F.
- Dayton City (urban): math 12% / reading 21% proficiency, ranked #641 of 656 in OH (top 98%) — low school quality limits family demand, transient renter base, plan for 1-2y turnover; 74% free/reduced lunch — lower-income household profile, screen leases tightly.
- Zoned schools: Kiser Elementary School (math 11% / reading 15%, grade F, #1,429 of 1,584 statewide, top 90%, 552 students, 0% FRL); Belmont High School (math 5% / reading 20%, grade F, #720 of 781 statewide, top 93%, 1,100 students, 0% FRL) — zoned schools average 0% FRL vs 74% district-wide (74 pts lower); this property's tenant base skews higher-income than the district average.
- Market conditions: 67 active listings in the ZIP; 22 comparable units currently listed for rent nearby; rentals at typical pace (median 25d on market — plan ~3-4 weeks tenant-placement turnaround); lower-income renter base — watch delinquency; 907 units permitted in Montgomery County in 2024 (416 in 5+ unit buildings).
- This rent runs 35% of the median local income ($39k/yr) — at the standard rent-burdened threshold; future hikes will face affordability resistance.
Forward outlook
- Local home prices are declining (-3.0%/yr); year-one equity from $864 of loan paydown is wiped out by about $4k of value loss. Plan a longer hold.
- Montgomery County population projected at -10% by 2050 — secular population decline; favor cash flow + early exit over multi-decade hold.
Negotiation context
- It's been on market 16 days — a 2% lower offer ($123k) is reasonable based on typical stale-listing flexibility.
- 5 sale attempts since 14y ago with the ask held roughly flat each time — persistent listings suggest the price (not the market) is what's stuck; bring a comps-based counter.
- Current owner paid $49k; list at $125k implies a 155% gain — meaningful room to come down on a strong offer.
Risks & watch-outs
- Watch-outs: built in 1910 — expect roof / HVAC / electrical / plumbing capex.
Questions for the listing agent
- Built in 1910 — when were the roof, HVAC, electrical panel, plumbing, and water heater last replaced?
- Is there a deadline driving the sale (1031 exchange, divorce, estate, relocation)? That informs how much negotiation room exists.
- Crime grade is F in this area — have there been break-ins, vandalism, or insurance claims at this property in the last 3 years? What carrier currently insures it and at what premium?
- The area grade is low — what's the realistic commute time and amenity access for the typical tenant pool here? Any planned neighborhood developments (good or bad) we should know about?
- What's the average days-on-market for RENTAL listings here right now (not sales)? A rising rental-DOM trend means longer vacancies and softer asking-rent achievability than the comps imply.
- What's the recent tenant-quality profile in this submarket — average credit score on applications, eviction rate, late-payment / NSF rate, and stable-employment percentage? A property-management company in the area should have these aggregated.
- How much new for-sale + rental construction is in the pipeline within 1–3 miles? Heavy new supply typically softens prices + rents 12–24 months out; constrained supply supports both.
Investment metrics
- 1% rule
- 0.91% ✗
- Cap rate
- 7.28%
- Cash-on-cash
- 3.51%
- DSCR
- 1.16
- GRM
- 9.2
CMA / ARV
- ARV (on-the-fly)
- $126,256
- Comps found
- 12
Show comp detail 12 sales within ~0.75 mi
| Address | Dist | Beds/Ba | Sqft | Sold | Price | $/sf | Match |
|---|---|---|---|---|---|---|---|
| 129 Rita St | 0.08mi | 3/1.5 | 1,355 (+12%) | 2mo | $165,000 | $122 | 74 |
| 1811 Warner Ave | 0.23mi | 2/1.0 (-1) | 1,146 (-6%) | 3mo | $97,000 | $85 | 72 |
| 165 Rita St | 0.09mi | 3/1.0 | 1,360 (+12%) | 5mo | $60,000 | $44 | 71 |
| 77 Baltimore St | 0.28mi | 3/1.0 | 1,319 (+9%) | 2mo | $111,900 | $85 | 71 |
| 1531 Chapel St | 0.42mi | 3/2.5 | 1,216 (+0%) | 6mo | $126,500 | $104 | 69 |
| 18 Baltimore St | 0.32mi | 3/1.0 | 1,109 (-9%) | 6mo | $134,000 | $121 | 66 |
| 1033 Gerhard St | 0.18mi | 2/1.5 (-1) | 1,087 (-10%) | 4mo | $70,000 | $64 | 64 |
| 1417 Schaeffer St | 0.50mi | 2/1.0 (-1) | 1,178 (-3%) | 4mo | $65,000 | $55 | 63 |
| 310 Brandt St | 0.31mi | 3/1.0 | 1,389 (+14%) | 0mo | $147,000 | $106 | 61 |
| 435 Grove Ave | 0.44mi | 4/2.0 (+1) | 1,162 (-4%) | 4mo | $150,000 | $129 | 60 |
| 1304 Valley St | 0.41mi | 2/2.0 (-1) | 1,051 (-13%) | 1mo | $135,900 | $129 | 49 |
| 1322 Schaeffer St | 0.55mi | 3/2.0 | 1,384 (+14%) | 4mo | $40,000 | $29 | 44 |
Match score weights: distance 35% · size 25% · config 20% · recency 20%. Top-matched comps best support the ARV.
Projected returns pro-forma
-3.0% appreciation · 3.0% rent growth · sell at horizon
- IRR
- -10.8%
- Equity multiple
- 0.61×
- Total profit
- $-13,743
- Equity at exit
- $18,623
- IRR
- -1.5%
- Equity multiple
- 0.89×
- Total profit
- $-3,673
- Equity at exit
- $10,799
Cash invested: $34,972 (down + closing). Projections, not guarantees.
Landlord ↔ Tenant lean methodology
- Overall (STATE)
- 73 Landlord-Friendly
- State Ohio
- 73 Landlord-Friendly · R+6
- County
- — inherits STATE
- City
- — inherits STATE
ZIP-level market 45404
- Home prices YoY
- -24.2%
- Active inventory
- 67
- Price-to-rent
- 9.2×
Monthly cashflow live
- Estimated rent
- $1,134 high interval (Pro) →
- Mortgage (P&I)
- −$655
- Tax from tax record
- −$87 /mo · $1,039/yr
- Insurance
- −$52
- HOA
- −$0
- Vacancy / Maint / Mgmt
- −$238
- Net cashflow
- $102
Break-even live
Sensitivity live
| Price | -10% $173 | -5% $138 | +0% $102 | +5% $67 | +10% $32 |
|---|---|---|---|---|---|
| Rent | -10% $13 | -5% $58 | +0% $102 | +5% $147 | +10% $192 |
| Rate | -1.0pp $165 | -0.5pp $134 | base $102 | +0.5pp $70 | +1.0pp $37 |
UW: 25.0% down · 7.5% · 30yr · 1.5% tax · 5.0% vac · 8.0% maint · 8.0% mgmt
Financing live
Cash to close
- Down payment
- $31,225
- Closing costs
- $3,747
- Reserves months
- —
- Total cash needed
- —
Loan-product check · same deal, 3 products live
Conventional
25% down · 7.5% · 30yr
- Down + closing
- —
- Monthly P&I
- —
- Monthly cashflow
- —
- DSCR
- —
- Eligible?
- —
Personal DTI + credit; lowest rate.
DSCR
20% down · 8.5% · 30yr
- Down + closing
- —
- Monthly P&I
- —
- Monthly cashflow
- —
- DSCR
- —
- Eligible?
- —
No personal income docs; deal must DSCR.
Hard money
10% down · 12.0% · 12mo
- Down + closing
- —
- Monthly P&I
- —
- Monthly cashflow
- —
- DSCR
- —
- Eligible?
- —
Short-term bridge; refi at stabilization.
Rent comps 22 comps
| Address | Beds | Baths | Sqft | Rent | $/sqft | DOM | Units | Dist |
|---|---|---|---|---|---|---|---|---|
| 2034 Leo St Dayton, OH | 2.0 | 1.0 | 888 | $1,100 | $1.24 | 23d | 1 | 0.18mi |
| 78 Notre Dame Ave Unit A Dayton, OH | 3.0 | 1.0 | 1015 | $1,025 | $1.01 | 45d | 1 | 0.33mi |
| 2119 Bellefontaine Ave Dayton, OH | 3.0 | 1.5 | 1500 | $1,400 | $0.93 | 4d | 1 | 0.34mi |
| 163 Grove Ave Unit 163 Dayton, OH | 3.0 | 1.0 | 1000 | $950 | $0.95 | 45d | 1 | 0.41mi |
| 155 Grove Ave Unit 155 Dayton, OH | 3.0 | 1.0 | 1150 | $950 | $0.83 | 45d | 1 | 0.42mi |
| 1517 Chapel St Unit 1521 Dayton, OH | 2.0 | 1.0 | 1239 | $1,000 | $0.81 | 5d | 1 | 0.46mi |
| 200 Hart St Dayton, OH | 3.0 | 1.0 | 1304 | $1,250 | $0.96 | 25d | 1 | 0.62mi |
| 224 Deeds Ave Dayton, OH | 2.0 | 1.0 | 1124 | $950 | $0.85 | 25d | 1 | 0.67mi |
| 29 N Garfield St Dayton, OH | 3.0 | 1.0 | 1092 | $1,000 | $0.92 | 25d | 1 | 0.98mi |
| 451 Hunter Ave Dayton, OH | 2.0 | 1.0 | 974 | $800 | $0.82 | 25d | 1 | 1.01mi |
| 821 Herman Ave Dayton, OH | 3.0 | 1.0 | 1456 | $1,100 | $0.76 | 23d | 1 | 1.03mi |
| 809 Herman Ave Dayton, OH | 2.0 | 1.0 | 747 | $700 | $0.94 | 5d | 1 | 1.05mi |
| 101 N Irwin St Dayton, OH | 2.0 | 1.0 | 900 | $1,100 | $1.22 | 5d | 1 | 1.09mi |
| 120 S Monmouth St Dayton, OH | 2.0 | 1.0 | 1000 | $950 | $0.95 | 45d | 1 | 1.28mi |
| 2200 E 5th St Dayton, OH | 2.0 | 1.0 | 1000 | $825 | $0.82 | 25d | 1 | 1.32mi |
| 15 John St Unit 15 Dayton, OH | 2.0 | 1.0 | 1200 | $800 | $0.67 | 25d | 1 | 1.33mi |
| 112 Webster St Dayton, OH | 2.0 | 1.0–2.0 | 802 | $2,198 | $2.74 | 4d | 63 | 1.38mi |
| 204 Sears St Dayton, OH | 3.0 | 1.0–2.5 | 1124 | $2,793 | $2.48 | 4d | 10 | 1.38mi |
| 3707 E 3rd St Unit 3705 Dayton, OH | 3.0 | 1.0 | 1410 | $1,045 | $0.74 | 25d | 1 | 1.43mi |
| 3719 E 3rd St Unit 3717 Dayton, OH | 3.0 | 1.0 | 1092 | $1,100 | $1.01 | 4d | 1 | 1.44mi |
| 224 S Irwin St Unit 226 Dayton, OH | 2.0 | 1.0 | 992 | $900 | $0.91 | 5d | 1 | 1.47mi |
| 144 N Quentin Ave Dayton, OH | 3.0 | 1.0 | 1038 | $1,600 | $1.54 | 45d | 1 | 1.49mi |
Listing history 12 events
-
2026-06-22days on market $124,900 Active 16 DOM
-
2026-06-18days on market $124,900 Active 13 DOM
-
2026-06-17days on market $124,900 Active 12 DOM
-
2026-06-16days on market $124,900 Active 11 DOM
-
2026-06-15days on market $124,900 Active 10 DOM
-
2026-06-14days on market $124,900 Active 8 DOM
-
2026-06-13days on market $124,900 Active 7 DOM
-
2026-06-10days on market $124,900 Active 5 DOM
-
2026-06-09days on market $124,900 Active 4 DOM
-
2026-06-08days on market $124,900 Active 3 DOM
-
2026-06-07remarks 699-char remark
-
2026-06-07$124,900 Active 2 DOM
ⓘ Source: listings_history table (triggers on properties + properties_extension) + one-shot
backfill from property_details.listing_events for pre-trigger history.
Tax reassessment forecast OH · Partial reset (capped growth)
- Current annual tax
- $1,039 · $87/mo
- Projected year-2 tax
- $1,494 · $124/mo
- Expected delta
- +$455/yr (+$38/mo · 43.8%)
ⓘ Screening estimate from a state-policy table — verify with the county assessor before closing.
Climate risk First Street
- Flood 1/10 Low FEMA zone X (unshaded) · 0% chance over 30 yrs
- Wildfire 1/10 Low
- Heat 4/10 Moderate 7 d/yr ≥102°F today · 19 d/yr by 30 yrs out
- Wind 2/10 Low
- Air quality 3/10 Moderate 2 unhealthy d/yr today · 4 by 30 yrs out
Nearby sold comps map
Loading sold comps map…
Walkable amenities ~0.75 mi
Loading nearby amenities…
Taxation est. · year 1
- Rental income
- $13,610
- − Mortgage interest
- −$6,996
- − Property taxes
- −$1,039
- − Insurance
- −$624
- − Repairs & maintenance
- −$1,089
- − Management
- −$1,089
- − Depreciation
- −$3,633
- Taxable loss
- −$861
- Est. tax savings @ 24.0%
- +$207
- After-tax cash flow
- $1,435/yr
For passive investors: Depreciation is non-cash, so a rental often shows a tax loss while cash-flowing — sheltering income. Rental losses are passive: they offset passive income freely, and up to $25,000/yr can offset ordinary (W-2) income if you actively participate and your MAGI is under $100k (phasing out to $0 by $150k); unused losses carry forward. On sale, claimed depreciation is recaptured at up to 25%, and gains may owe capital-gains tax (a 1031 exchange can defer both). Figures are a year-1 estimate at your 24.0% rate — not tax advice; consult a CPA.
Schools (NCES district)
- District
- Dayton City
- NCES district ID
- 3904384
- Math proficiency
- 12% ▼ -12.00%
- Reading proficiency
- 21% ▼ -11.00%
- Median HH income
- $28,688
- Composite
- 12.94/100
- National rank
- #9579
- State rank
- #641 of 656 in OH
Livability — Dayton
- Score
- 65/100
- State rank
- #716
- US rank
- #12895
Category grades
Schools grade is shown separately in the Schools card above.
Census & demographics
- Census place
- Dayton, OH
- County
- Montgomery County · 459,541 people
- City population
- 164,387
- Metro
- Dayton-Kettering, OH
- Population (ZIP)
- 9,826
- Household income
- $38,874
- Rent vs Own
- Severe rent burden
- 702.0
Population outlook (Montgomery County) Hauer SSP2
- Today (2025)
- 523,241 people
- By 2030
- 514,948 · -1.6%
- By 2040
- 493,378 · -5.7%
- By 2050
- 469,639 · -10.2%
- By 2075
- 418,360 · -20.0%
- By 2100
- 353,315 · -32.5%
Race, ethnicity, and origin ACS 2023
- Neighborhood character
- Predominantly White (70%)
- Race & ethnicity
- White 70% Black 19% Two or more races 7% Hispanic / Latino 4% Asian 1%
- Common ancestry
- Iranian 3% Slovak 2% Serbian 1%
- Foreign-born
- 9% · Canada
- Languages at home
- 88% English-only · Spanish 4% Arabic 4% Other Asian/Pacific 3%
Political lean MEDSL · Montgomery
- 2024 margin
- Toss-up / Even · D 49.8% · R 49.3%
- 2008→2024 swing
- -5.8pp toward R · 2008: 6.2pp · 2024: 0.5pp
- All cycles
- 2024: D+0.5 2020: D+2.2 2016: R+1.2 2012: D+3.1 2008: D+6.2
Not yet ingested
- Civics
- —
Market trends
- HPI YoY
- ▼ -67.48%
- Current HPI
- 210.9571
- Rent YoY
- —
- Metro
- Dayton-Kettering, OH
- State GDP YoY
- ▲ 1.98%
- F500 in state
- 48
Industry mix (Fortune 500 HQ in OH)
| Industry | F500 HQs | Revenue |
|---|---|---|
| Insurance | 3 | $145B |
|
||
| Industrial Machinery | 3 | $49B |
|
||
| Financial Services | 3 | $24B |
|
||
| Consumer Goods | 2 | $93B |
|
||
| Aerospace / Defense | 2 | $47B |
|
||
| Utilities | 2 | $33B |
|
||
Price history
+309.5% since first listed20 events — show timeline
- 2026-06-05 Listed $124,900 Dayton MLS
- 2017-12-05 Sold (Public Records) $49,000 Public Records
- 2017-11-16 Sold (MLS) $49,000 Dayton MLS
- 2017-11-16 Sold (MLS) $49,000 Dayton MLS
- 2017-10-27 Contingent — Dayton MLS
- 2017-09-26 Price Changed $54,000 Dayton MLS
- 2017-08-08 Listed $55,000 Dayton MLS
- 2016-08-02 Listing Removed — Dayton MLS
- 2016-07-25 Price Changed $54,000 Dayton MLS
- 2016-07-18 Price Changed $59,000 Dayton MLS
- 2016-06-11 Listed $65,000 Dayton MLS
- 2014-06-19 Sold (MLS) $24,000 Dayton MLS
- 2014-06-19 Sold (MLS) $24,000 Dayton MLS
- 2014-06-10 Listing Removed — Dayton MLS
- 2014-05-16 Listed $25,000 Dayton MLS
- 2013-03-14 Sold (MLS) $21,200 Dayton MLS
- 2013-03-14 Sold (MLS) $21,200 Dayton MLS
- 2013-02-26 Listing Removed — Dayton MLS
- 2012-06-21 Listed $28,000 Dayton MLS
- 1987-08-28 Sold (Public Records) $30,500 Public Records
Property tax history
+0.8%/yrLatest (2025): $1,039 · -0.2% YoY. Source: county tax records.
Cash-flow waterfall
monthlySold comps — $/sqft
last 12 mo · ≤1 miLoading sold comps…