2505 Jackson #138 · Escalon, CA
Flood risk No data
- FEMA flood zone
- —
- Chance of flooding over 30 yrs
- —
- Est. flood insurance / yr
- —
Fire risk No data
- Est. fire insurance / yr
- —
Heat risk No data
- Hot days now (above threshold)
- —
- Hot days in 30 yrs
- —
Wind risk No data
- Chance of severe wind over 30 yrs
- —
Air-quality risk No data
- Unhealthy air days now
- —
- Unhealthy air days in 30 yrs
- —
Risk factors via First Street. Map © Google.
Why this score? — see what drove the C grade
The composite is a weighted blend of 9 inputs, each scored 0–100. Each bar is that input's sub-score; the figure is the points it added to the 100-point composite (weight × sub-score).
- Cash flow +27.0/30.0
- DSCR +9.3/10.0
- 1% rule +7.3/10.0
- Condition / age +3.8/5.0
- Schools +3.2/10.0
- Livability +2.8/5.0
- Rent growth +2.5/5.0
- ARV discount +0.0/15.0
- Appreciation +0.0/10.0
$129,900
🖨 Deal sheet (PDF) 📄 Offer letter ✓ Due diligence
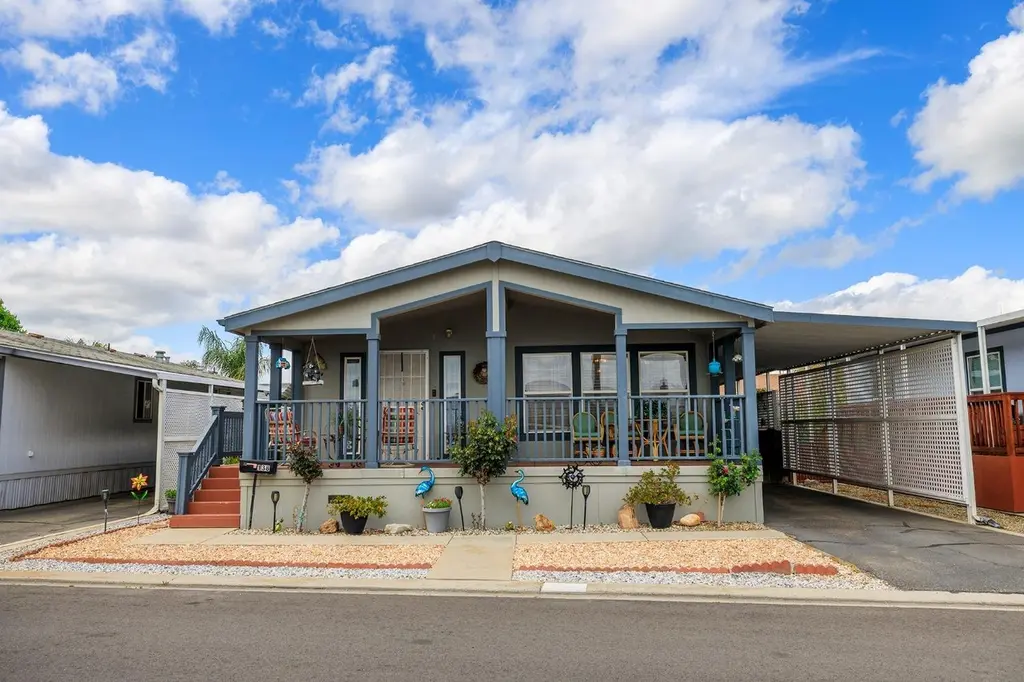
Listing remarks
This beautiful 2bd/2bath, 1129 sq ft home is located in the 55+ community of Almond Grove. The minute you walk in it feels like home! The home was placed into the park and is for sale by the original owner. .a rare find! East facing covered porch is the perfect place to enjoy quite time, anytime! Once inside the open living room, dining room and kitchen makes it easy to relax and enjoy being home! Down the hallway will be the spacious 2nd bedroom, full bath and primary suite with a spa like feel bathroom! Off of the kitchen you will find the office area, pantry and laundry. A door leading you out to the carport, backyard walkway, beautiful side yard and front beauty of Rose trees. Enjo
Key facts
- Pantry
- Beautiful side yard
- Office area
Tags
Neighborhood map
What this means for you Summary
Snapshot
- This is a 2-bed/2.0-bath manufactured listed at $130k. Condition is rated good.
Deal economics
- At list price, monthly cash flow is $362 ($4k/yr) — positive.
- The deal already cash-flows at list — no discount required.
- Meets the 1% rule at list price ($2k rent vs $130k).
- Recommended offer: $114k (12.0% below list) — sets the bar for market timing.
- Cap rate 9.6% vs local median 3.0% in Escalon — top-decile yield for the area; either an underpriced asset or a hidden risk that comps aren't pricing in. Stress-test before assuming the spread holds.
Location & tenants
- Location reads 55/100 on livability (#847 in CA) — a working-class tenant base; expect higher turnover. Strengths: housing A-; Watch: crime C-, amenities F, commute F.
- Escalon Unified (town): math 27% / reading 45% proficiency, ranked #258 of 517 in CA (top 50%) — families likely to look elsewhere, expect single-tenant / working-renter base with shorter leases.
- Zoned schools: Dent Elementary (math 32% / reading 38%, grade F, #712 of 1,571 statewide, top 46%, 668 students, 42% FRL); El Portal Middle (math 22% / reading 48%, grade F, #181 of 498 statewide, top 36%, 588 students, 44% FRL); Escalon High (math 27% / reading 62%, grade F, #434 of 1,170 statewide, top 39%, 812 students, 40% FRL) — zoned schools at 42% FRL track the district average.
- Market conditions: 50 active listings in the ZIP; 2 comparable units currently listed for rent nearby; 3,779 units permitted in San Joaquin County in 2024 (0 in 5+ unit buildings).
Forward outlook
- Local home prices are declining (-3.0%/yr); year-one equity from $898 of loan paydown is wiped out by about $4k of value loss. Plan a longer hold.
- San Joaquin County population projected at +17% by 2050 — long-run rental-demand tailwind backs the buy-and-hold thesis.
- At projected returns (-3.0% appreciation + 3.0% rent growth), your $36k cash investment doubles in ~10 years — after that, you're playing with house money.
Negotiation context
- It's been on market 425 days — a 12% lower offer ($114k) is reasonable based on typical stale-listing flexibility.
Questions for the listing agent
- It's been on market 425 days. Have you received any prior offers? Is the seller open to a 12% concession, seller financing, or rate buy-down credit?
- Why hasn't it sold? Are there any deal-killer items the seller is aware of (foundation, flood, title, zoning, code violations)?
- Is there a deadline driving the sale (1031 exchange, divorce, estate, relocation)? That informs how much negotiation room exists.
- What's the average days-on-market for RENTAL listings here right now (not sales)? A rising rental-DOM trend means longer vacancies and softer asking-rent achievability than the comps imply.
- What's the recent tenant-quality profile in this submarket — average credit score on applications, eviction rate, late-payment / NSF rate, and stable-employment percentage? A property-management company in the area should have these aggregated.
- How much new for-sale + rental construction is in the pipeline within 1–3 miles? Heavy new supply typically softens prices + rents 12–24 months out; constrained supply supports both.
Investment metrics
- 1% rule
- 1.23% ✓
- Cap rate
- 9.64%
- Cash-on-cash
- 11.95%
- DSCR
- 1.53
- GRM
- 6.8
CMA / ARV
- ARV (median comp)
- $99,900
- List price
- $129,900
- Delta
- 30.03%
- Verdict
- OVERPRICED
- Comps
- 5 within 2.0 mi
Projected returns pro-forma
-3.0% appreciation · 3.0% rent growth · sell at horizon
- IRR
- 1.5%
- Equity multiple
- 1.06×
- Total profit
- $2,045
- Equity at exit
- $19,369
- IRR
- 11.1%
- Equity multiple
- 1.87×
- Total profit
- $31,585
- Equity at exit
- $11,231
Cash invested: $36,372 (down + closing). Projections, not guarantees.
Landlord ↔ Tenant lean methodology
- Overall (STATE)
- 18 Strongly Tenant-Friendly
- State California
- 18 Strongly Tenant-Friendly · D+13
- County
- — inherits STATE
- City
- — inherits STATE
ZIP-level market 95320
- Active inventory
- 50
- Price-to-rent
- 6.8×
Monthly cashflow live
- Estimated rent
- $1,595 medium interval (Pro) →
- Mortgage (P&I)
- −$681
- Tax est. 1.5%
- −$162 /mo · $1,948/yr
- Insurance
- −$54
- HOA
- −$0
- Vacancy / Maint / Mgmt
- −$335
- Net cashflow
- $362
Break-even live
Sensitivity live
| Price | -10% $452 | -5% $407 | +0% $362 | +5% $317 | +10% $272 |
|---|---|---|---|---|---|
| Rent | -10% $236 | -5% $299 | +0% $362 | +5% $425 | +10% $488 |
| Rate | -1.0pp $428 | -0.5pp $395 | base $362 | +0.5pp $329 | +1.0pp $294 |
UW: 25.0% down · 7.5% · 30yr · 1.5% tax · 5.0% vac · 8.0% maint · 8.0% mgmt
Financing live
Cash to close
- Down payment
- $32,475
- Closing costs
- $3,897
- Reserves months
- —
- Total cash needed
- —
Loan-product check · same deal, 3 products live
Conventional
25% down · 7.5% · 30yr
- Down + closing
- —
- Monthly P&I
- —
- Monthly cashflow
- —
- DSCR
- —
- Eligible?
- —
Personal DTI + credit; lowest rate.
DSCR
20% down · 8.5% · 30yr
- Down + closing
- —
- Monthly P&I
- —
- Monthly cashflow
- —
- DSCR
- —
- Eligible?
- —
No personal income docs; deal must DSCR.
Hard money
10% down · 12.0% · 12mo
- Down + closing
- —
- Monthly P&I
- —
- Monthly cashflow
- —
- DSCR
- —
- Eligible?
- —
Short-term bridge; refi at stabilization.
Rent comps 2 comps
| Address | Beds | Baths | Sqft | Rent | $/sqft | DOM | Units | Dist |
|---|---|---|---|---|---|---|---|---|
| 2174 Coley Ave Apt 34 Escalon, CA | 1.0 | 1.0 | 750 | $1,525 | $2.03 | 15d | 1 | 0.65mi |
| 2174 Coley Ave Apt 32 Escalon, CA | 2.0 | 1.0 | 950 | $1,650 | $1.74 | 15d | 1 | 0.65mi |
Listing history 9 events
-
2026-06-09days on market $129,900 Active 425 DOM
-
2026-06-08days on market $129,900 Active 424 DOM
-
2026-06-07days on market $129,900 Active 423 DOM
-
2026-06-05days on market $129,900 Active 420 DOM
-
2026-06-03days on market $129,900 Active 419 DOM
-
2026-06-02days on market $129,900 Active 418 DOM
-
2026-06-01days on market $129,900 Active 417 DOM
-
2026-05-31days on market $129,900 Active 416 DOM
-
2026-05-30days on market $129,900 Active 415 DOM
ⓘ Source: listings_history table (triggers on properties + properties_extension) + one-shot
backfill from property_details.listing_events for pre-trigger history.
Nearby sold comps map
Loading sold comps map…
Walkable amenities ~0.75 mi
Loading nearby amenities…
Taxation est. · year 1
- Rental income
- $19,138
- − Mortgage interest
- −$7,276
- − Property taxes
- −$1,948
- − Insurance
- −$650
- − Repairs & maintenance
- −$1,531
- − Management
- −$1,531
- − Depreciation
- −$3,779
- Taxable income
- $2,423
- Est. tax owed @ 24.0%
- −$581
- After-tax cash flow
- $3,765/yr
For passive investors: Depreciation is non-cash, so a rental often shows a tax loss while cash-flowing — sheltering income. Rental losses are passive: they offset passive income freely, and up to $25,000/yr can offset ordinary (W-2) income if you actively participate and your MAGI is under $100k (phasing out to $0 by $150k); unused losses carry forward. On sale, claimed depreciation is recaptured at up to 25%, and gains may owe capital-gains tax (a 1031 exchange can defer both). Figures are a year-1 estimate at your 24.0% rate — not tax advice; consult a CPA.
Condition & rehab AI · 13 photos
This 2bd/2bath home in Almond Grove is in good condition with cosmetic updates needed. Painting the exterior and replacing window screens will enhance curb appeal and energy efficiency.
Repairs flagged
- Minor kitchen backsplash — existing tile
- Minor bathroom vanity — existing fixtures
Value-add opportunities
- Both paint exterior — enhances curb appeal and value
- Both replace window screens — improves energy efficiency and aesthetics
- Resale update kitchen backsplash — modernizes kitchen and adds value
- Resale update bathroom vanity — modernizes bathroom and adds value
Renovation cost estimate screening
| Repair item | Severity | Est. cost |
|---|---|---|
| kitchen backsplash · existing tile | Minor | $500–3,000 |
| bathroom vanity · existing fixtures | Minor | $500–3,000 |
| Total estimated repair cost · 2 items | $1,000–6,000 |
Value-add ROI direction
- Both paint exterior — enhances curb appeal and value ↑
- Both replace window screens — improves energy efficiency and aesthetics ↑
- Resale update kitchen backsplash — modernizes kitchen and adds value ↑
- Resale update bathroom vanity — modernizes bathroom and adds value ↑
ⓘ Cost ranges are severity-bucket heuristics (US national rule-of-thumb). Get contractor quotes + a written scope before underwriting a rehab budget.
Schools (NCES district)
- District
- Escalon Unified
- NCES district ID
- 0612840
- Math proficiency
- 27% ▼ -9.00%
- Reading proficiency
- 45% ▼ -4.00%
- Median HH income
- $58,800
- Composite
- 31.95/100
- National rank
- #5844
- State rank
- #258 of 517 in CA
Livability — Escalon
- Score
- 55/100
- State rank
- #847
- US rank
- #23351
Category grades
Schools grade is shown separately in the Schools card above.
Census & demographics
- Census place
- Escalon, CA
- Population (ZIP)
- 13,511
Population outlook (San Joaquin County) Hauer SSP2
- Today (2025)
- 796,965 people
- By 2030
- 828,849 · +4.0%
- By 2040
- 885,611 · +11.1%
- By 2050
- 929,798 · +16.7%
- By 2075
- 994,578 · +24.8%
- By 2100
- 971,291 · +21.9%
Race, ethnicity, and origin ACS 2023
- Neighborhood character
- Predominantly White (66%)
- Race & ethnicity
- White 66% Hispanic / Latino 28% Two or more races 15%
- Hispanic origin (detail)
- Mexican 25%
- Common ancestry
- Russian 13% Iranian 5% Slovak 1%
- Foreign-born
- 11% · Canada
- Languages at home
- 79% English-only · Spanish 17% Other Indo-European 3%
Political lean MEDSL · San Joaquin
- 2024 margin
- Toss-up / Even · D 48.0% · R 48.9% · Other 3.0%
- 2008→2024 swing
- -11.6pp toward R · 2008: 10.7pp · 2024: -0.9pp
- All cycles
- 2024: R+0.9 2020: D+13.9 2016: D+12.9 2012: D+8.9 2008: D+10.7
Not yet ingested
- Civics
- —
Market trends
- HPI YoY
- ▼ -259.16%
- Current HPI
- 289.011
- Rent YoY
- —
- Metro
- —
- State GDP YoY
- ▲ 3.21%
- F500 in state
- 116
Industry mix (Fortune 500 HQ in CA)
| Industry | F500 HQs | Revenue |
|---|---|---|
| Technology | 27 | $1,492B |
|
||
| Financial Services | 3 | $174B |
|
||
| Retail | 3 | $44B |
|
||
| Insurance | 3 | $26B |
|
||
| Media / Entertainment | 2 | $115B |
|
||
| Pharmaceuticals / Biotech | 2 | $62B |
|
||
Cash-flow waterfall
monthlySold comps — $/sqft
last 12 mo · ≤1 miLoading sold comps…