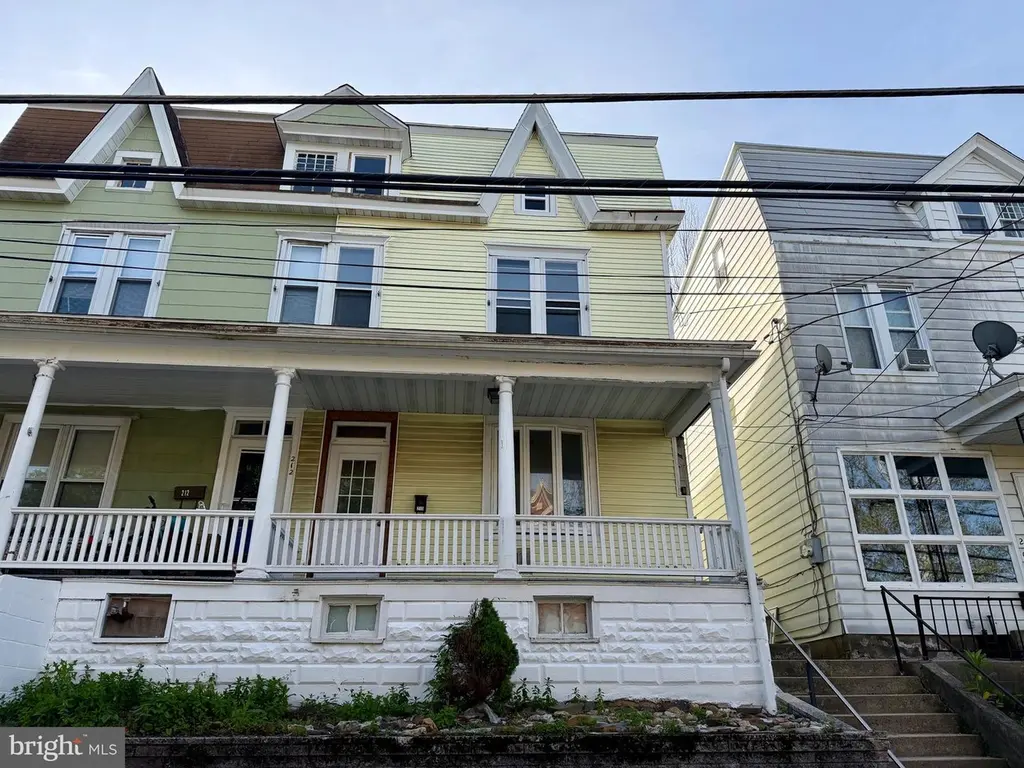
210 N Warren St · Orwigsburg, PA
Flood risk 1/10 · Minimal
- FEMA flood zone
- X (unshaded)
- Chance of flooding over 30 yrs
- 0.0%
- Est. flood insurance / yr
- $473 – $860
Fire risk 3/10 · Minor
- Est. fire insurance / yr
- $511 – $949
Heat risk 4/10 · Minor
- Hot days now (above 98°F)
- 7 days/yr
- Hot days in 30 yrs
- 15 days/yr
Wind risk 4/10 · Minor
- Chance of severe wind over 30 yrs
- 7.0%
Air-quality risk 2/10 · Minimal
- Unhealthy air days now
- 1 days/yr
- Unhealthy air days in 30 yrs
- 2 days/yr
Risk factors via First Street. Map © Google.
Why this score? — see what drove the B grade
The composite is a weighted blend of 9 inputs, each scored 0–100. Each bar is that input's sub-score; the figure is the points it added to the 100-point composite (weight × sub-score).
- Cash flow +26.6/30.0
- ARV discount +15.0/15.0
- DSCR +9.1/10.0
- 1% rule +7.1/10.0
- Schools +4.6/10.0
- Livability +3.5/5.0
- Rent growth +2.5/5.0
- Condition / age +2.5/5.0
- Appreciation +0.0/10.0
$139,900
🖨 Deal sheet 📄 Offer letter ✓ Due diligence
Listing remarks
Move-in ready! Affordable! Quick closing possible! Seller has done a lot of the work, but there's plenty of opportunity to finish this home just the way you'd like! The roof was replaced in 2021, and the furnace is approximately 10 years young! To make your move easier, most windows have been replaced, the home has been insulated and freshly painted throughout, with new flooring added, and a kitchen refresh. On the main floor, you'll find a living room, dining room or family room- you choose- an eat-in kitchen, and a laundry room/half bath. The upper floor contains the 3 bedrooms and the full bathroom. You won't find many like this in the Blue Mountain School District or Orwigsburg at t
Key facts
- Built 1900
- Listed 17 days
Property features AI
Finance
- Financial info: Lease not considered
Exterior
- Parking: On-street parking
- Utilities: Public water; Public sewer; Oil hot water
- Home design: Semi-detached home; Fee simple ownership; Estimated year built
- Construction: Mixed construction materials; Permanent foundation; Above-grade and below-grade structures
- Exterior features: Lot approximately 21 x 99; Not in a federal flood zone
Interior
- Kitchen: Dishwasher; Electric oven/range; Refrigerator
- Bedrooms: Three bedrooms on the first upper level
- Bathrooms: One full bathroom (upper level); One half bathroom (main level)
- Heating & cooling: Hot water radiator heating; Oil-fired heating
- Interior features: Full basement with interior access; Estimated living area
- Laundry & utility: Main floor laundry
Neighborhood map
What this means for you Summary
Snapshot
- This is a 3-bed/1.5-bath townhouse listed at $140k.
Deal economics
- At list price, monthly cash flow is $375 ($4k/yr) — positive.
- The deal already cash-flows at list — no discount required.
- Meets the 1% rule at list price ($2k rent vs $140k).
- Recommended offer: $138k (1.5% below list) — sets the bar for market timing.
- Cap rate 9.5% vs local median 3.2% in Orwigsburg — top-decile yield for the area; either an underpriced asset or a hidden risk that comps aren't pricing in. Stress-test before assuming the spread holds.
Location & tenants
- Location reads 70/100 on livability (#746 in PA) — a middle-class / working-renter tenant base. Strengths: crime A+, cost of living A+, housing A+; Watch: amenities F, commute F, health & safety F.
- Blue Mountain SD (town): math 42% / reading 65% proficiency, ranked #126 of 539 in PA (top 23%) — acceptable for families but not a draw, mixed tenant base, ~2y average lease.
- Market conditions: 57 active listings in the ZIP; 169 units permitted in Schuylkill County in 2024 (0 in 5+ unit buildings).
Forward outlook
- Local home prices are declining (-3.0%/yr); year-one equity from $967 of loan paydown is wiped out by about $4k of value loss. Plan a longer hold.
- Schuylkill County population projected at -16% by 2050 — secular population decline; favor cash flow + early exit over multi-decade hold.
- At projected returns (-3.0% appreciation + 3.0% rent growth), your $39k cash investment doubles in ~10 years — after that, you're playing with house money.
Negotiation context
- It's been on market 18 days — a 2% lower offer ($138k) is reasonable based on typical stale-listing flexibility.
- Current owner paid $55k; list at $140k implies a 154% gain — meaningful room to come down on a strong offer.
Risks & watch-outs
- Watch-outs: built in 1900 — expect roof / HVAC / electrical / plumbing capex.
Questions for the listing agent
- Built in 1900 — when were the roof, HVAC, electrical panel, plumbing, and water heater last replaced?
- Is there a deadline driving the sale (1031 exchange, divorce, estate, relocation)? That informs how much negotiation room exists.
- What's the average days-on-market for RENTAL listings here right now (not sales)? A rising rental-DOM trend means longer vacancies and softer asking-rent achievability than the comps imply.
- What's the recent tenant-quality profile in this submarket — average credit score on applications, eviction rate, late-payment / NSF rate, and stable-employment percentage? A property-management company in the area should have these aggregated.
- How much new for-sale + rental construction is in the pipeline within 1–3 miles? Heavy new supply typically softens prices + rents 12–24 months out; constrained supply supports both.
Investment metrics
- 1% rule
- 1.21% ✓
- Cap rate
- 9.51%
- Cash-on-cash
- 11.48%
- DSCR
- 1.51
- GRM
- 6.9
CMA / ARV
- ARV (on-the-fly)
- $186,817
- Comps found
- 4
Show comp detail 4 sales within ~0.75 mi
| Address | Dist | Beds/Ba | Sqft | Sold | Price | $/sf | Match |
|---|---|---|---|---|---|---|---|
| 215 N Wayne St | 0.04mi | 3/1.5 | 1,428 (-3%) | 20mo | $181,000 | $127 | 77 |
| 223-S. Liberty | 0.25mi | 3/1.5 | 1,344 (-9%) | 2mo | $145,000 | $108 | 72 |
| 421 W Market | 0.28mi | 3/1.5 | 1,544 (+5%) | 8mo | $189,000 | $122 | 72 |
| 307 W Market St | 0.19mi | 4/1.0 (+1) | 1,348 (-8%) | 14mo | $172,500 | $128 | 58 |
Match score weights: distance 35% · size 25% · config 20% · recency 20%. Top-matched comps best support the ARV.
Projected returns pro-forma
-3.0% appreciation · 3.0% rent growth · sell at horizon
- IRR
- 0.8%
- Equity multiple
- 1.03×
- Total profit
- $1,220
- Equity at exit
- $20,860
- IRR
- 10.5%
- Equity multiple
- 1.81×
- Total profit
- $31,880
- Equity at exit
- $12,096
Cash invested: $39,172 (down + closing). Projections, not guarantees.
Landlord ↔ Tenant lean methodology
- Overall (STATE)
- 62 Landlord-Friendly
- State Pennsylvania
- 62 Landlord-Friendly · EVEN
- County
- — inherits STATE
- City
- — inherits STATE
ZIP-level market 17961
- Home prices YoY
- -26.2%
- Active inventory
- 57
- Price-to-rent
- 6.9×
Monthly cashflow live
- Estimated rent
- $1,687 medium interval (Pro) →
- Mortgage (P&I)
- −$734
- Tax from tax record
- −$166 /mo · $1,995/yr
- Insurance
- −$58
- HOA
- −$0
- Vacancy / Maint / Mgmt
- −$354
- Net cashflow
- $375
Break-even live
UW: 25.0% down · 7.5% · 30yr · 1.5% tax · 5.0% vac · 8.0% maint · 8.0% mgmt
Financing live
Cash to close
- Down payment
- $34,975
- Closing costs
- $4,197
- Reserves months
- —
- Total cash needed
- —
Loan-product check · same deal, 3 products live
Conventional
25% down · 7.5% · 30yr
- Down + closing
- —
- Monthly P&I
- —
- Monthly cashflow
- —
- DSCR
- —
- Eligible?
- —
Personal DTI + credit; lowest rate.
DSCR
20% down · 8.5% · 30yr
- Down + closing
- —
- Monthly P&I
- —
- Monthly cashflow
- —
- DSCR
- —
- Eligible?
- —
No personal income docs; deal must DSCR.
Hard money
10% down · 12.0% · 12mo
- Down + closing
- —
- Monthly P&I
- —
- Monthly cashflow
- —
- DSCR
- —
- Eligible?
- —
Short-term bridge; refi at stabilization.
Listing history 14 events
-
2026-06-19days on market $139,900 Coming Soon 18 DOM
-
2026-06-18days on market $139,900 Coming Soon 17 DOM
-
2026-06-17days on market $139,900 Coming Soon 16 DOM
-
2026-06-16days on market $139,900 Coming Soon 15 DOM
-
2026-06-15days on market $139,900 Coming Soon 14 DOM
-
2026-06-14days on market $139,900 Coming Soon 12 DOM
-
2026-06-12days on market $139,900 Coming Soon 11 DOM
-
2026-06-09days on market $139,900 Coming Soon 8 DOM
-
2026-06-08days on market $139,900 Coming Soon 7 DOM
-
2026-06-07days on market $139,900 Coming Soon 6 DOM
-
2026-06-07days on market $139,900 Coming Soon 5 DOM
-
2026-06-04days on market $139,900 Coming Soon 2 DOM
-
2026-06-02remarks 699-char remark
-
2026-06-02$139,900 Coming Soon 1 DOM
ⓘ Source: listings_history table (triggers on properties + properties_extension) + one-shot
backfill from property_details.listing_events for pre-trigger history.
Tax reassessment forecast PA · Partial reset (capped growth)
- Current annual tax
- $1,995 · $166/mo
- Projected year-2 tax
- $2,103 · $175/mo
- Expected delta
- +$108/yr (+$9/mo · 5.4%)
ⓘ Screening estimate from a state-policy table — verify with the county assessor before closing.
Climate risk First Street
- Flood 1/10 Low FEMA zone X (unshaded) · 0% chance over 30 yrs
- Wildfire 3/10 Moderate
- Heat 4/10 Moderate 7 d/yr ≥98°F today · 15 d/yr by 30 yrs out
- Wind 4/10 Moderate 7% chance of damaging wind over 30 yrs
- Air quality 2/10 Low 1 unhealthy d/yr today · 2 by 30 yrs out
Nearby sold comps map
Loading sold comps map…
Walkable amenities ~0.75 mi
Loading nearby amenities…
Taxation est. · year 1
- Rental income
- $20,248
- − Mortgage interest
- −$7,837
- − Property taxes
- −$1,995
- − Insurance
- −$700
- − Repairs & maintenance
- −$1,620
- − Management
- −$1,620
- − Depreciation
- −$4,070
- Taxable income
- $2,407
- Est. tax owed @ 24.0%
- −$578
- After-tax cash flow
- $3,920/yr
For passive investors: Depreciation is non-cash, so a rental often shows a tax loss while cash-flowing — sheltering income. Rental losses are passive: they offset passive income freely, and up to $25,000/yr can offset ordinary (W-2) income if you actively participate and your MAGI is under $100k (phasing out to $0 by $150k); unused losses carry forward. On sale, claimed depreciation is recaptured at up to 25%, and gains may owe capital-gains tax (a 1031 exchange can defer both). Figures are a year-1 estimate at your 24.0% rate — not tax advice; consult a CPA.
Schools (NCES district)
- District
- Blue Mountain SD
- NCES district ID
- 4203870
- Math proficiency
- 42% ▼ -9.00%
- Reading proficiency
- 65% ▼ -7.00%
- Median HH income
- $58,661
- Composite
- 46.42/100
- National rank
- #2454
- State rank
- #126 of 539 in PA
Livability — Orwigsburg
- Score
- 70/100
- State rank
- #746
- US rank
- #7462
Category grades
Schools grade is shown separately in the Schools card above.
Census & demographics
- Census place
- Orwigsburg, PA
- Population (ZIP)
- 6,711
Population outlook (Schuylkill County) Hauer SSP2
- Today (2025)
- 137,447 people
- By 2030
- 133,121 · -3.1%
- By 2040
- 124,172 · -9.7%
- By 2050
- 115,611 · -15.9%
- By 2075
- 100,796 · -26.7%
- By 2100
- 86,667 · -36.9%
Race, ethnicity, and origin ACS 2023
- Neighborhood character
- Predominantly White (93%)
- Race & ethnicity
- White 93% Two or more races 5% Asian 1% Hispanic / Latino 1%
- Common ancestry
- Romanian 7% Polish 2% Iranian 2%
- Foreign-born
- 1%
- Languages at home
- 95% English-only · Spanish 1% Tagalog/Filipino 1% German/W. Germanic 1%
Political lean MEDSL · Schuylkill
- 2024 margin
- Solid R (+42.1) · D 28.5% · R 70.6%
- 2008→2024 swing
- -33.4pp toward R · 2008: -8.7pp · 2024: -42.1pp
- All cycles
- 2024: R+42.1 2020: R+39.9 2016: R+43.4 2012: R+13.4 2008: R+8.7
Not yet ingested
- Civics
- —
Market trends
- HPI YoY
- ▼ -60.01%
- Current HPI
- 168.6122
- Rent YoY
- —
- Metro
- —
- State GDP YoY
- ▲ 1.68%
- F500 in state
- 34
Industry mix (Fortune 500 HQ in PA)
| Industry | F500 HQs | Revenue |
|---|---|---|
| Healthcare | 2 | $309B |
|
||
| Insurance | 2 | $27B |
|
||
| Telecommunications / Media | 1 | $124B |
|
||
| Industrial Distribution | 1 | $22B |
|
||
| Financial Services | 1 | $20B |
|
||
| Chemicals / Materials | 1 | $18B |
|
||
Price history
+154.4% since first listed2 events — show timeline
- 2026-06-02 Coming Soon $139,900 BRIGHT MLS
- 2005-08-29 Sold (Public Records) $55,000 Public Records
Property tax history
+3.6%/yrLatest (2025): $1,995 · +9.6% YoY. Source: county tax records.
Cash-flow waterfall
monthlySold comps — $/sqft
last 12 mo · ≤1 miLoading sold comps…