 9-Plex
850-872 Oliverea Rd · Pine Hill, NY
Flood risk No data
- FEMA flood zone
- —
- Chance of flooding over 30 yrs
- —
- Est. flood insurance / yr
- —
Fire risk No data
- Est. fire insurance / yr
- —
Heat risk No data
- Hot days now (above threshold)
- —
- Hot days in 30 yrs
- —
Wind risk No data
- Chance of severe wind over 30 yrs
- —
Air-quality risk No data
- Unhealthy air days now
- —
- Unhealthy air days in 30 yrs
- —
Risk factors via First Street. Map © Google.
Why this score? — see what drove the B- grade
The composite is a weighted blend of 9 inputs, each scored 0–100. Each bar is that input's sub-score; the figure is the points it added to the 100-point composite (weight × sub-score).
- Cash flow +26.9/30.0
- DSCR +9.3/10.0
- ARV discount +7.5/15.0
- 1% rule +7.2/10.0
- Appreciation +5.6/10.0
- Schools +5.2/10.0
- Livability +2.8/5.0
- Rent growth +2.5/5.0
- Condition / age +1.0/5.0
$975,000
🖨 Deal sheet 📄 Offer letter ✓ Due diligence
Multi-family units
County records classify this as Multi-Family (5+ Unit). Listing-text estimate: 9 units. confirmed
5+ unit building — per-unit beds/baths from public records are typically unavailable; the breakdown below (if shown) is an estimate from the listing text.
Listing remarks
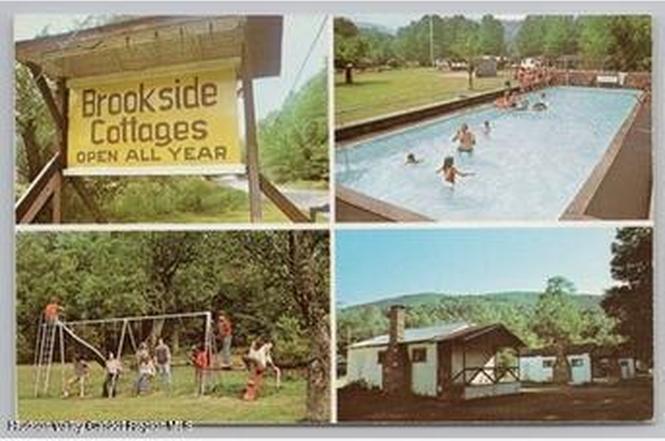
Once known as Brookside Cottages, this rare Catskills hospitality compound offers the chance to revive a piece of mountain history in one of the region's most sought-after destinations. Tucked away on approximately 7 acres along scenic Oliverea Road in the heart of Catskills Park, the property is surrounded by the same natural beauty and authentic character that have helped transform neighboring destinations into some of the Catskills' most celebrated retreats. The offering includes 11 cabin structures containing 16 existing lodging units (converted from 17 and a mix of 1 and 2 bedrooms), a recreation hall/lodge building with garage space, and a larger house structure across the road that s
Key facts
- 11 cabin structures
- Mature trees
- 7.73 acre lot
Tags
Property features AI
Finance
- Other: Zoning: r1.5
Exterior
- Parking: Attached or detached 2-car garage
- Utilities: Spring water source; Cesspool sewer; 200+ amp electric service with circuit breakers
- Home design: Multi-family / residential income property; Cabin / hotel-motel structure types; One level; Shingle roof
- Construction: Frame construction with wood siding; Block foundation; Built on one level
- Exterior features: Riverfront property with river access and stream; Level lot with views; Paved frontage on a county road; Frontage on Esopus Creek; Pool details: see remarks
Interior
- Kitchen: Range
- Flooring: Wood flooring; Varied flooring
- Heating & cooling: No cooling
- Interior features: Fireplace (wood burning); Fire pit; Playground; Covered, front, and screened porch; see remarks for additional patio/porch details
Neighborhood map
What this means for you Summary
Snapshot
- This is a 9 × 3-bed/?-bath units multifamily listed at $975k. Condition is rated poor.
Deal economics
- At list price, monthly cash flow is $3k ($32k/yr) — positive. Per door: $300/mo.
- The deal already cash-flows at list — no discount required.
- Meets the 1% rule at list price ($12k rent vs $975k).
- Cap rate 9.6% vs local median 1.1% in Pine Hill — top-decile yield for the area; either an underpriced asset or a hidden risk that comps aren't pricing in. Stress-test before assuming the spread holds.
Location & tenants
- Location reads 56/100 on livability (#1,098 in NY) — a working-class tenant base; expect higher turnover. Strengths: housing A+; Watch: crime C-, employment C-, cost of living C-.
- Onteora Central School District (rural): math 58% / reading 59% proficiency, ranked #288 of 755 in NY (top 38%) — acceptable for families but not a draw, mixed tenant base, ~2y average lease.
- Market conditions: 11 active listings in the ZIP; 464 units permitted in Ulster County in 2024 (170 in 5+ unit buildings).
Forward outlook
- In year one you build about $18k of equity ($7k loan paydown + $11k appreciation (1.1% local appreciation)).
- Ulster County population projected at -14% by 2050 — secular population decline; favor cash flow + early exit over multi-decade hold.
- At projected returns (1.1% appreciation + 3.0% rent growth), your $273k cash investment doubles in ~5 years — after that, you're playing with house money.
- By year 4, paydown + projected appreciation supports a ~$65k cash-out refi (75% LTV) — recoverable capital for the next deal without selling this one.
Negotiation context
- Only 4 days on market — expect competitive offers; lowballing is unlikely to land.
Risks & watch-outs
- Watch-outs: built in 1940 — expect roof / HVAC / electrical / plumbing capex.
Questions for the listing agent
- Can we see the unit-by-unit rent roll, current vacancy, and any below-market leases? What's the average tenancy length?
- What capital expenditures (roof, boiler, parking lot, exteriors) have been made in the last 5 years, and what's planned in the next 2?
- Have any recent inspections been done? Can we get a copy of the seller's disclosures and any deferred-maintenance estimates?
- Built in 1940 — when were the roof, HVAC, electrical panel, plumbing, and water heater last replaced?
- Is there a deadline driving the sale (1031 exchange, divorce, estate, relocation)? That informs how much negotiation room exists.
- Schools are F-rated, which usually means shorter tenancies and higher turnover. Who's the typical renter profile here, and what's been the actual vacancy rate?
- What's the average days-on-market for RENTAL listings here right now (not sales)? A rising rental-DOM trend means longer vacancies and softer asking-rent achievability than the comps imply.
- What's the recent tenant-quality profile in this submarket — average credit score on applications, eviction rate, late-payment / NSF rate, and stable-employment percentage? A property-management company in the area should have these aggregated.
- How much new apartment / multifamily construction is in the pipeline within 1–3 miles? Heavy new supply (>2% of stock underway) typically softens rents 12–24 months out; light construction supports rent growth.
Investment metrics
- 1% rule
- 1.22% ✓
- Cap rate
- 9.61%
- Cash-on-cash
- 11.85%
- DSCR
- 1.53
- GRM
- 6.8
CMA / ARV
No comps found within radius.
Projected returns pro-forma
1.15% appreciation · 3.0% rent growth · sell at horizon
- IRR
- 14.1%
- Equity multiple
- 1.72×
- Total profit
- $197,374
- Equity at exit
- $340,497
- IRR
- 17.5%
- Equity multiple
- 3.15×
- Total profit
- $585,784
- Equity at exit
- $458,464
Cash invested: $273,000 (down + closing). Projections, not guarantees.
Landlord ↔ Tenant lean methodology
- Overall (STATE)
- 15 Strongly Tenant-Friendly
- State New York
- 15 Strongly Tenant-Friendly · D+10
- County
- — inherits STATE
- City
- — inherits STATE
ZIP-level market 12410
- Home prices YoY
- 0.3%
- Active inventory
- 11
- Price-to-rent
- 61.2×
Monthly cashflow live
- Estimated rent
- $11,943 medium interval (Pro) →
- Mortgage (P&I)
- −$5,113
- Tax est. 1.5%
- −$1,219 /mo · $14,625/yr
- Insurance
- −$406
- HOA
- −$0
- Vacancy / Maint / Mgmt
- −$2,508
- Net cashflow
- $2,697
Break-even live
9-unit breakdown (identical units grouped — click to expand)
| Units | Beds | Baths | Est. rent |
|---|---|---|---|
| 9× units | 3 | — | $11,943 |
| #1 | 3 | — | $1,327 |
| #2 | 3 | — | $1,327 |
| #3 | 3 | — | $1,327 |
| #4 | 3 | — | $1,327 |
| #5 | 3 | — | $1,327 |
| #6 | 3 | — | $1,327 |
| #7 | 3 | — | $1,327 |
| #8 | 3 | — | $1,327 |
| #9 | 3 | — | $1,327 |
| Total (9 units) | $11,943 | ||
UW: 25.0% down · 7.5% · 30yr · 1.5% tax · 5.0% vac · 8.0% maint · 8.0% mgmt
Financing live
Cash to close
- Down payment
- $243,750
- Closing costs
- $29,250
- Reserves months
- —
- Total cash needed
- —
Loan-product check · same deal, 3 products live
Conventional
25% down · 7.5% · 30yr
- Down + closing
- —
- Monthly P&I
- —
- Monthly cashflow
- —
- DSCR
- —
- Eligible?
- —
Personal DTI + credit; lowest rate.
DSCR
20% down · 8.5% · 30yr
- Down + closing
- —
- Monthly P&I
- —
- Monthly cashflow
- —
- DSCR
- —
- Eligible?
- —
No personal income docs; deal must DSCR.
Hard money
10% down · 12.0% · 12mo
- Down + closing
- —
- Monthly P&I
- —
- Monthly cashflow
- —
- DSCR
- —
- Eligible?
- —
Short-term bridge; refi at stabilization.
Listing history 5 events
-
2026-06-19days on market $975,000 Active 4 DOM
-
2026-06-18days on market $975,000 Active 3 DOM
-
2026-06-17days on market $975,000 Active 2 DOM
-
2026-06-15remarks 699-char remark
-
2026-06-15$975,000 Active 1 DOM
ⓘ Source: listings_history table (triggers on properties + properties_extension) + one-shot
backfill from property_details.listing_events for pre-trigger history.
Nearby sold comps map
Loading sold comps map…
Walkable amenities ~0.75 mi
Loading nearby amenities…
Taxation est. · year 1
- Rental income
- $143,316
- − Mortgage interest
- −$54,615
- − Property taxes
- −$14,625
- − Insurance
- −$4,875
- − Repairs & maintenance
- −$11,465
- − Management
- −$11,465
- − Depreciation
- −$28,364
- Taxable income
- $17,907
- Est. tax owed @ 24.0%
- −$4,298
- After-tax cash flow
- $28,066/yr
For passive investors: Depreciation is non-cash, so a rental often shows a tax loss while cash-flowing — sheltering income. Rental losses are passive: they offset passive income freely, and up to $25,000/yr can offset ordinary (W-2) income if you actively participate and your MAGI is under $100k (phasing out to $0 by $150k); unused losses carry forward. On sale, claimed depreciation is recaptured at up to 25%, and gains may owe capital-gains tax (a 1031 exchange can defer both). Figures are a year-1 estimate at your 24.0% rate — not tax advice; consult a CPA.
Condition & rehab AI · 12 photos
This property requires extensive renovations and updates to improve its condition and increase its resale and rental value.
Repairs flagged
- Major Kitchen appliances — The appliances are outdated and need to be replaced.
- Major Kitchen sink — The sink is worn and in need of replacement.
- Major Bathroom fixtures — The fixtures are outdated and need to be replaced.
- Major Bathroom tiles — The tiles are worn and need to be replaced.
- Major Exterior siding — The siding is peeling and needs repainting.
- Major Flooring — The flooring is worn and needs replacement.
- Major Interior walls — The walls have peeling paint and need repainting.
- Major HVAC and mechanical systems — The systems are outdated and need replacement.
Value-add opportunities
- Resale Renovate and update the kitchen and bathrooms — Updating the kitchen and bathrooms will improve the home's appearance and functionality, making it more attractive to potential buyers.
- Resale Replace the HVAC and mechanical systems — Upgrading the HVAC and mechanical systems will improve the home's energy efficiency and comfort, making it more attractive to potential buyers.
- Resale Paint the exterior and interior walls — Painting the exterior and interior walls will improve the home's appearance and make it more attractive to potential buyers.
- Resale Landscaping and trimming — Landscaping and trimming will improve the home's curb appeal and make it more attractive to potential buyers.
Renovation cost estimate screening
| Repair item | Severity | Est. cost |
|---|---|---|
| Kitchen appliances · The appliances are outdated and need to be replaced. | Major | $15,000–50,000 |
| Kitchen sink · The sink is worn and in need of replacement. | Major | $15,000–50,000 |
| Bathroom fixtures · The fixtures are outdated and need to be replaced. | Major | $15,000–50,000 |
| Bathroom tiles · The tiles are worn and need to be replaced. | Major | $15,000–50,000 |
| Exterior siding · The siding is peeling and needs repainting. | Major | $15,000–50,000 |
| Flooring · The flooring is worn and needs replacement. | Major | $15,000–50,000 |
| Interior walls · The walls have peeling paint and need repainting. | Major | $15,000–50,000 |
| HVAC and mechanical systems · The systems are outdated and need replacement. | Major | $15,000–50,000 |
| Total estimated repair cost · 8 items | $120,000–400,000 |
Value-add ROI direction
- Resale Renovate and update the kitchen and bathrooms — Updating the kitchen and bathrooms will improve the home's appearance and functionality, making it more attractive to potential buyers. ↑
- Resale Replace the HVAC and mechanical systems — Upgrading the HVAC and mechanical systems will improve the home's energy efficiency and comfort, making it more attractive to potential buyers. ↑
- Resale Paint the exterior and interior walls — Painting the exterior and interior walls will improve the home's appearance and make it more attractive to potential buyers. ↑
- Resale Landscaping and trimming — Landscaping and trimming will improve the home's curb appeal and make it more attractive to potential buyers. ↑
ⓘ Cost ranges are severity-bucket heuristics (US national rule-of-thumb). Get contractor quotes + a written scope before underwriting a rehab budget.
Schools (NCES district)
- District
- Onteora Central School District
- NCES district ID
- 3621840
- Math proficiency
- 58% ▬ 0.00%
- Reading proficiency
- 59% ▼ -3.00%
- Median HH income
- $56,997
- Composite
- 52.17/100
- National rank
- #3482
- State rank
- #288 of 755 in NY
Livability — Pine Hill
- Score
- 56/100
- State rank
- #1098
- US rank
- #22409
Category grades
Schools grade is shown separately in the Schools card above.
Census & demographics
- Population (ZIP)
- 379
Population outlook (Ulster County) Hauer SSP2
- Today (2025)
- 175,887 people
- By 2030
- 171,876 · -2.3%
- By 2040
- 161,771 · -8.0%
- By 2050
- 151,470 · -13.9%
- By 2075
- 133,023 · -24.4%
- By 2100
- 113,504 · -35.5%
Race, ethnicity, and origin ACS 2023
- Neighborhood character
- Predominantly White (100%)
- Race & ethnicity
- White 100%
- Common ancestry
- Slovak 24% Subsaharan African 2% Lithuanian 2%
Political lean MEDSL · Ulster
- 2024 margin
- D (+18.7) · D 59.3% · R 40.7%
- 2008→2024 swing
- -4.9pp toward R · 2008: 23.6pp · 2024: 18.7pp
- All cycles
- 2024: D+18.7 2020: D+20.9 2016: D+9.1 2012: D+21.9 2008: D+23.6
Not yet ingested
- Civics
- —
Market trends
- HPI YoY
- ▲ 1.15%
- Current HPI
- 333.8207
- Rent YoY
- —
- Metro
- —
- State GDP YoY
- ▲ 2.60%
- F500 in state
- 92
Industry mix (Fortune 500 HQ in NY)
| Industry | F500 HQs | Revenue |
|---|---|---|
| Financial Services | 10 | $950B |
|
||
| Consumer Goods | 9 | $162B |
|
||
| Insurance | 4 | $225B |
|
||
| Telecommunications | 2 | $144B |
|
||
| Pharmaceuticals | 2 | $112B |
|
||
| Media / Entertainment | 2 | $69B |
|
||
Price history
1 event — show timeline
- 2026-06-15 Listed $975,000 HVCRMLS
Cash-flow waterfall
monthlySold comps — $/sqft
last 12 mo · ≤1 miLoading sold comps…