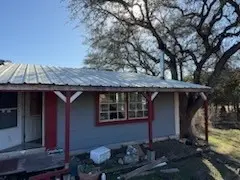
21405 Horseshoe Loop · Lago Vista, TX
Flood risk 1/10 · Minimal
- FEMA flood zone
- X (unshaded)
- Chance of flooding over 30 yrs
- 0.0%
- Est. flood insurance / yr
- $507 – $1,088
Fire risk 2/10 · Minimal
- Est. fire insurance / yr
- $1,222 – $2,270
Heat risk 8/10 · Major
- Hot days now (above 107°F)
- 7 days/yr
- Hot days in 30 yrs
- 24 days/yr
Wind risk 6/10 · Moderate
- Chance of severe wind over 30 yrs
- 66.0%
Air-quality risk 1/10 · Minimal
- Unhealthy air days now
- 0 days/yr
- Unhealthy air days in 30 yrs
- 0 days/yr
Risk factors via First Street. Map © Google.
Why this score? — see what drove the B grade
The composite is a weighted blend of 9 inputs, each scored 0–100. Each bar is that input's sub-score; the figure is the points it added to the 100-point composite (weight × sub-score).
- Cash flow +30.0/30.0
- 1% rule +10.0/10.0
- DSCR +10.0/10.0
- ARV discount +7.5/15.0
- Schools +3.8/10.0
- Livability +3.6/5.0
- Rent growth +3.2/5.0
- Condition / age +2.5/5.0
- Appreciation +0.0/10.0
$69,900
🖨 Deal sheet (PDF) 📄 Offer letter ✓ Due diligence
Listing remarks
Attention investors and DIY enthusiasts! Multiple exit strategies: finish this remodel then either flip, rent or move in! Home being sold as is.
Key facts
- 0.31 acre lot
- Parking
- Built 1983
Property features AI
Exterior
- Parking: One parking space
- Utilities: Electricity available; Sewer available; Water available
- Home design: Single-story home; Faces north; Resale property
- Construction: Year built: public records; Construction details: see remarks
- Exterior features: Front porch; No additional exterior features listed
Interior
- Bedrooms: Three main-level bedrooms
- Bathrooms: Two full bathrooms (main level)
- Heating & cooling: Heating: see remarks
- Interior features: Main level primary bedroom
Neighborhood map
What this means for you Summary
Snapshot
- This is a 3-bed/2.0-bath manufactured listed at $70k.
Deal economics
- At list price, monthly cash flow is $930 ($11k/yr) — positive.
- The deal already cash-flows at list — no discount required.
- Meets the 1% rule at list price ($2k rent vs $70k).
- Cap rate 22.3% vs local median 2.2% in Lago Vista — top-decile yield for the area; either an underpriced asset or a hidden risk that comps aren't pricing in. Stress-test before assuming the spread holds.
Location & tenants
- Location reads 72/100 on livability (#275 in TX) — a middle-class / working-renter tenant base. Strengths: crime A+, employment A+, housing A+; Watch: amenities F, commute F, health & safety F.
- Lago Vista ISD (rural): math 33% / reading 51% proficiency, ranked #269 of 826 in TX (top 33%) — families likely to look elsewhere, expect single-tenant / working-renter base with shorter leases.
- Market conditions: Rents rising (+3.0%/yr); 1100 active listings in the ZIP; 6 comparable units currently listed for rent nearby; rentals at typical pace (median 25d on market — plan ~3-4 weeks tenant-placement turnaround); high-income renter base; 17,121 units permitted in Travis County in 2024 (11,963 in 5+ unit buildings).
Forward outlook
- Local home prices are declining (-3.0%/yr); year-one equity from $483 of loan paydown is wiped out by about $2k of value loss. Plan a longer hold.
- Travis County population projected at +60% by 2050 — long-run rental-demand tailwind backs the buy-and-hold thesis.
- At projected returns (-3.0% appreciation + 3.0% rent growth), your $20k cash investment doubles in ~2 years — after that, you're playing with house money.
Negotiation context
- Only 6 days on market — expect competitive offers; lowballing is unlikely to land.
Risks & watch-outs
- Climate carrying-cost: major wind risk, 66% chance of damaging wind over 30y; extreme-heat days projected 7→24/yr by 2055 (HVAC capex compounding) — expect insurance premiums to compound above CPI over the hold.
Questions for the listing agent
- Is there a deadline driving the sale (1031 exchange, divorce, estate, relocation)? That informs how much negotiation room exists.
- What's the average days-on-market for RENTAL listings here right now (not sales)? A rising rental-DOM trend means longer vacancies and softer asking-rent achievability than the comps imply.
- What's the recent tenant-quality profile in this submarket — average credit score on applications, eviction rate, late-payment / NSF rate, and stable-employment percentage? A property-management company in the area should have these aggregated.
- How much new for-sale + rental construction is in the pipeline within 1–3 miles? Heavy new supply typically softens prices + rents 12–24 months out; constrained supply supports both.
Investment metrics
- 1% rule
- 2.62% ✓
- Cap rate
- 22.27%
- Cash-on-cash
- 57.05%
- DSCR
- 3.54
- GRM
- 3.2
CMA / ARV
- ARV (on-the-fly)
- $174,720
- Comps found
- 1
Show comp detail 1 sale within ~0.75 mi
| Address | Dist | Beds/Ba | Sqft | Sold | Price | $/sf | Match |
|---|---|---|---|---|---|---|---|
| 7106 Chippewa Cir | 0.29mi | 3/2.0 | 1,624 (+12%) | 20mo | $195,000 | $120 | 50 |
Match score weights: distance 35% · size 25% · config 20% · recency 20%. Top-matched comps best support the ARV.
Projected returns pro-forma
-3.0% appreciation · 2.98% rent growth · sell at horizon
- IRR
- 55.5%
- Equity multiple
- 3.45×
- Total profit
- $47,943
- Equity at exit
- $10,422
- IRR
- 60.5%
- Equity multiple
- 7.03×
- Total profit
- $118,094
- Equity at exit
- $6,044
Cash invested: $19,572 (down + closing). Projections, not guarantees.
Landlord ↔ Tenant lean methodology
- Overall (STATE)
- 87 Strongly Landlord-Friendly
- State Texas
- 87 Strongly Landlord-Friendly · R+5
- County
- — inherits STATE
- City
- — inherits STATE
ZIP-level market 78645
- Home prices YoY
- -31.6%
- Rents YoY
- 3.0%
- Active inventory
- 1100
- Price-to-rent
- 3.2×
Monthly cashflow live
- Estimated rent
- $1,829 high interval (Pro) →
- Mortgage (P&I)
- −$367
- Tax from tax record
- −$119 /mo · $1,423/yr
- Insurance
- −$29
- HOA
- −$0
- Vacancy / Maint / Mgmt
- −$384
- Net cashflow
- $930
Break-even live
Sensitivity live
| Price | -10% $970 | -5% $950 | +0% $930 | +5% $911 | +10% $891 |
|---|---|---|---|---|---|
| Rent | -10% $786 | -5% $858 | +0% $930 | +5% $1,003 | +10% $1,075 |
| Rate | -1.0pp $966 | -0.5pp $948 | base $930 | +0.5pp $912 | +1.0pp $894 |
UW: 25.0% down · 7.5% · 30yr · 1.5% tax · 5.0% vac · 8.0% maint · 8.0% mgmt
Financing live
Cash to close
- Down payment
- $17,475
- Closing costs
- $2,097
- Reserves months
- —
- Total cash needed
- —
Loan-product check · same deal, 3 products live
Conventional
25% down · 7.5% · 30yr
- Down + closing
- —
- Monthly P&I
- —
- Monthly cashflow
- —
- DSCR
- —
- Eligible?
- —
Personal DTI + credit; lowest rate.
DSCR
20% down · 8.5% · 30yr
- Down + closing
- —
- Monthly P&I
- —
- Monthly cashflow
- —
- DSCR
- —
- Eligible?
- —
No personal income docs; deal must DSCR.
Hard money
10% down · 12.0% · 12mo
- Down + closing
- —
- Monthly P&I
- —
- Monthly cashflow
- —
- DSCR
- —
- Eligible?
- —
Short-term bridge; refi at stabilization.
Rent comps 6 comps
| Address | Beds | Baths | Sqft | Rent | $/sqft | DOM | Units | Dist |
|---|---|---|---|---|---|---|---|---|
| 21475 Coyote Trl Unit A Lago Vista, TX | 2.0 | 1.0 | 900 | $1,295 | $1.44 | 44d | 1 | 0.26mi |
| 21475 Coyote Trl #2 Lago Vista, TX | 2.0 | 1.0 | 896 | $1,095 | $1.22 | 25d | 1 | 0.26mi |
| 20703 Ridgeview Rd Lago Vista, TX | 3.0 | 2.0 | 1813 | $2,200 | $1.21 | 5d | 1 | 0.72mi |
| 22813 Agave Grove Dr Lago Vista, TX | 3.0 | 2.5 | 1638 | $1,925 | $1.18 | 5d | 1 | 0.99mi |
| 5916 Lago Vista Way Unit B-10 UP Lago Vista, TX | 2.0 | 2.0 | 1110 | $1,295 | $1.17 | 44d | 1 | 1.47mi |
| 5914 Lago Vista Way Unit C23 Lago Vista, TX | 2.0 | 2.0 | 1037 | $1,295 | $1.25 | 25d | 1 | 1.49mi |
Listing history 11 events
-
2026-05-19status Pending
-
2026-02-21price
-
2026-02-04Active
-
2020-01-30soldstatus
-
2006-04-07soldstatus
-
2006-04-07soldstatus
-
2001-11-08soldstatus
-
2001-10-26soldstatus
-
1985-04-03soldstatus
-
1984-01-27soldstatus
-
1983-06-30soldstatus
ⓘ Source: listings_history table (triggers on properties + properties_extension) + one-shot
backfill from property_details.listing_events for pre-trigger history.
Tax reassessment forecast TX · Resets to sale price
- Current annual tax
- $1,423 · $119/mo
- Projected year-2 tax
- $1,423 · $119/mo
- Expected delta
- $0/yr ($0/mo · 0.0%)
ⓘ Screening estimate from a state-policy table — verify with the county assessor before closing.
Climate risk First Street
- Flood 1/10 Low FEMA zone X (unshaded) · 0% chance over 30 yrs
- Wildfire 2/10 Low
- Heat 8/10 Severe 7 d/yr ≥107°F today · 24 d/yr by 30 yrs out
- Wind 6/10 Major 66% chance of damaging wind over 30 yrs
- Air quality 1/10 Low 0 unhealthy d/yr today · 0 by 30 yrs out
Nearby sold comps map
Loading sold comps map…
Walkable amenities ~0.75 mi
Loading nearby amenities…
Taxation est. · year 1
- Rental income
- $21,945
- − Mortgage interest
- −$3,915
- − Property taxes
- −$1,423
- − Insurance
- −$350
- − Repairs & maintenance
- −$1,756
- − Management
- −$1,756
- − Depreciation
- −$2,033
- Taxable income
- $10,712
- Est. tax owed @ 24.0%
- −$2,571
- After-tax cash flow
- $8,594/yr
For passive investors: Depreciation is non-cash, so a rental often shows a tax loss while cash-flowing — sheltering income. Rental losses are passive: they offset passive income freely, and up to $25,000/yr can offset ordinary (W-2) income if you actively participate and your MAGI is under $100k (phasing out to $0 by $150k); unused losses carry forward. On sale, claimed depreciation is recaptured at up to 25%, and gains may owe capital-gains tax (a 1031 exchange can defer both). Figures are a year-1 estimate at your 24.0% rate — not tax advice; consult a CPA.
Schools (NCES district)
- District
- Lago Vista ISD
- NCES district ID
- 4826400
- Math proficiency
- 33% ▼ -24.00%
- Reading proficiency
- 51% ▼ -11.00%
- Median HH income
- $73,671
- Composite
- 38.35/100
- National rank
- #4216
- State rank
- #269 of 826 in TX
Livability — Lago Vista
- Score
- 72/100
- State rank
- #275
- US rank
- #6393
Category grades
Schools grade is shown separately in the Schools card above.
Census & demographics
- Census place
- Lago Vista, TX
- County
- Travis County · 1,299,254 people
- City population
- 15,256
- Metro
- Austin-Round Rock-Georgetown, TX
- Population (ZIP)
- 15,256
- Household income
- $113,008
- Rent vs Own
- Severe rent burden
- 20.0
Population outlook (Travis County) Hauer SSP2
- Today (2025)
- 1,545,133 people
- By 2030
- 1,729,269 · +11.9%
- By 2040
- 2,097,596 · +35.8%
- By 2050
- 2,463,890 · +59.5%
- By 2075
- 3,249,374 · +110.3%
- By 2100
- 3,801,868 · +146.1%
Race, ethnicity, and origin ACS 2023
- Neighborhood character
- Predominantly White (73%)
- Race & ethnicity
- White 73% Hispanic / Latino 19% Two or more races 11% Black 2%
- Hispanic origin (detail)
- Mexican 15%
- Common ancestry
- Italian 7% Slovak 4% Lithuanian 4%
- Foreign-born
- 10% · Canada
- Languages at home
- 85% English-only · Spanish 12% Other Indo-European 1% German/W. Germanic 1%
Political lean MEDSL · Travis
- 2024 margin
- Solid D (+39.3) · D 68.8% · R 29.4% · Other 1.8%
- 2008→2024 swing
- +9.9pp toward D · 2008: 29.4pp · 2024: 39.3pp
- All cycles
- 2024: D+39.3 2020: D+45.0 2016: D+38.9 2012: D+23.9 2008: D+29.4
Not yet ingested
- Civics
- —
Market trends
- HPI YoY
- ▼ -98.02%
- Current HPI
- 211.9678
- Rent YoY
- ▲ 2.98%
- Metro
- Austin-Round Rock-Georgetown, TX
- State GDP YoY
- ▲ 3.95%
- F500 in state
- 110
Industry mix (Fortune 500 HQ in TX)
| Industry | F500 HQs | Revenue |
|---|---|---|
| Energy | 16 | $1,198B |
|
||
| Technology | 5 | $198B |
|
||
| Engineering / Construction | 4 | $72B |
|
||
| Energy Services | 3 | $60B |
|
||
| Utilities | 3 | $41B |
|
||
| Healthcare | 2 | $330B |
|
||
Property tax history
-0.3%/yrLatest (2026): $1,423 · -4.3% YoY. Source: county tax records.
Cash-flow waterfall
monthlySold comps — $/sqft
last 12 mo · ≤1 miLoading sold comps…