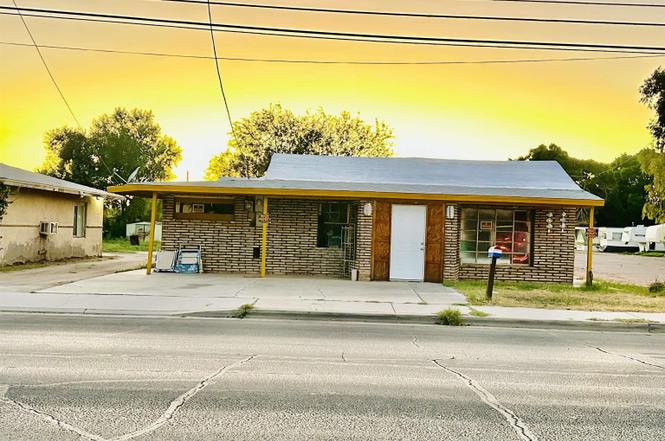
502 S Magnolia Ave · Yuma, AZ
Flood risk 1/10 · Minimal
- FEMA flood zone
- X (shaded)
- Chance of flooding over 30 yrs
- 0.0%
- Est. flood insurance / yr
- $507 – $1,088
Fire risk 2/10 · Minimal
- Est. fire insurance / yr
- $610 – $1,132
Heat risk 9/10 · Severe
- Hot days now (above 114°F)
- 7 days/yr
- Hot days in 30 yrs
- 20 days/yr
Wind risk 1/10 · Minimal
- Chance of severe wind over 30 yrs
- —
Air-quality risk 2/10 · Minimal
- Unhealthy air days now
- 2 days/yr
- Unhealthy air days in 30 yrs
- 2 days/yr
Risk factors via First Street. Map © Google.
Why this score? — see what drove the C- grade
The composite is a weighted blend of 9 inputs, each scored 0–100. Each bar is that input's sub-score; the figure is the points it added to the 100-point composite (weight × sub-score).
- Cash flow +17.2/30.0
- ARV discount +15.0/15.0
- DSCR +5.4/10.0
- Livability +3.6/5.0
- 1% rule +3.3/10.0
- Rent growth +3.0/5.0
- Condition / age +2.5/5.0
- Schools +1.3/10.0
- Appreciation +0.0/10.0
$199,900
🖨 Deal sheet (PDF) 📄 Offer letter ✓ Due diligence
Listing remarks MLS
Homeowners have not lived in the home for over 50 years. Investment opportunity in the heart of Yuma.
Key facts
- Rv access
- Storage units
- Corner lot
Tags
Property features AI
Finance
- HOA & community: Curbs; Sidewalks
Exterior
- Parking: RV access/parking
- Utilities: Public water; Public sewer
- Home design: Single family residence; Single-story
- Construction: Lot approximately 0.17 acres
- Exterior features: Patio; Paved road access
Interior
- Kitchen: Refrigerator
- Flooring: Carpet
- Bathrooms: 2 full bathrooms
- Heating & cooling: Central cooling
- Interior features: Refrigerator; Washer; Dryer; Carpet flooring; No fireplace
- Laundry & utility: Washer; Dryer
Neighborhood map
What this means for you Summary
Snapshot
- This is a 4-bed/3.0-bath single-family listed at $200k.
Deal economics
- At list price, monthly cash flow is $143 ($2k/yr) — positive.
- The deal already cash-flows at list — no discount required.
- To meet the 1% rule (rent ≥ 1% of price), the offer needs to be $167k (16.6% below list).
- Recommended offer: $167k (16.6% below list) — sets the bar for 1% rule.
- Cap rate 7.2% vs local median 3.9% in Yuma — top-decile yield for the area; either an underpriced asset or a hidden risk that comps aren't pricing in. Stress-test before assuming the spread holds.
Location & tenants
- Location reads 71/100 on livability (#30 in AZ) — a middle-class / working-renter tenant base. Strengths: cost of living A+, housing A+, health & safety A+; Watch: crime C-, employment D, commute F.
- Yuma Union High School District (4507) (urban): math 14% / reading 16% proficiency, ranked #212 of 249 in AZ (top 85%) — low school quality limits family demand, transient renter base, plan for 1-2y turnover.
- Zoned schools: Yuma High School (math 8% / reading 12%, grade F, #343 of 381 statewide, top 93%, 1,147 students, 80% FRL).
- Market conditions: Rents rising (+2.0%/yr); 263 active listings in the ZIP; 10 comparable units currently listed for rent nearby; rentals at typical pace (median 15d on market — plan ~3-4 weeks tenant-placement turnaround); 1,399 units permitted in Yuma County in 2024 (180 in 5+ unit buildings).
- This rent runs 35% of the median local income ($58k/yr) — at the standard rent-burdened threshold; future hikes will face affordability resistance.
Forward outlook
- Local home prices are declining (-3.0%/yr); year-one equity from $1k of loan paydown is wiped out by about $6k of value loss. Plan a longer hold.
- Yuma County population projected at +4% by 2050 — modest demand growth; plan on rents tracking national, not racing it.
Negotiation context
- It's been on market 263 days — a 12% lower offer ($176k) is reasonable based on typical stale-listing flexibility.
- 4 sale attempts with the ask held roughly flat each time — persistent listings suggest the price (not the market) is what's stuck; bring a comps-based counter.
- Current owner paid $110k; list at $200k implies a 81% gain — meaningful room to come down on a strong offer.
Risks & watch-outs
- Watch-outs: built in 1925 — expect roof / HVAC / electrical / plumbing capex.
- Climate carrying-cost: extreme-heat days projected 7→20/yr by 2055 (HVAC capex compounding) — expect insurance premiums to compound above CPI over the hold.
Questions for the listing agent
- It's been on market 263 days. Have you received any prior offers? Is the seller open to a 17% concession, seller financing, or rate buy-down credit?
- Built in 1925 — when were the roof, HVAC, electrical panel, plumbing, and water heater last replaced?
- Why hasn't it sold? Are there any deal-killer items the seller is aware of (foundation, flood, title, zoning, code violations)?
- Is there a deadline driving the sale (1031 exchange, divorce, estate, relocation)? That informs how much negotiation room exists.
- What's the average days-on-market for RENTAL listings here right now (not sales)? A rising rental-DOM trend means longer vacancies and softer asking-rent achievability than the comps imply.
- What's the recent tenant-quality profile in this submarket — average credit score on applications, eviction rate, late-payment / NSF rate, and stable-employment percentage? A property-management company in the area should have these aggregated.
- How much new for-sale + rental construction is in the pipeline within 1–3 miles? Heavy new supply typically softens prices + rents 12–24 months out; constrained supply supports both.
Investment metrics
- 1% rule
- 0.83% ✗
- Cap rate
- 7.15%
- Cash-on-cash
- 3.07%
- DSCR
- 1.14
- GRM
- 10.0
CMA / ARV
- ARV (on-the-fly)
- $259,896
- Comps found
- 12
Show comp detail 12 sales within ~0.75 mi
| Address | Dist | Beds/Ba | Sqft | Sold | Price | $/sf | Match |
|---|---|---|---|---|---|---|---|
| 680 S 20 Ave | 0.24mi | 3/2.0 (-1) | 1,770 (+6%) | 6mo | $190,000 | $107 | 64 |
| 169 S 22 Ave | 0.49mi | 4/2.0 | 1,600 (-4%) | 10mo | $249,900 | $156 | 58 |
| 321 S 23 Ave | 0.34mi | 4/2.0 | 1,518 (-9%) | 9mo | $255,000 | $168 | 58 |
| 520 S 9 Ave | 0.64mi | 4/2.0 | 1,718 (+3%) | 10mo | $240,000 | $140 | 52 |
| 316 S 23 Ave | 0.37mi | 4/2.0 | 1,810 (+9%) | 15mo | $273,000 | $151 | 52 |
| 835 S 10 Ave | 0.73mi | 3/2.0 (-1) | 1,680 (+1%) | 7mo | $272,000 | $162 | 49 |
| 575 S 10 Ave | 0.61mi | 3/2.0 (-1) | 1,687 (+1%) | 14mo | $299,900 | $178 | 48 |
| 2790 W 5 St | 0.71mi | 5/3.0 (+1) | 1,617 (-3%) | 13mo | $145,000 | $90 | 46 |
| 645 S 10 Ave | 0.63mi | 3/2.0 (-1) | 1,768 (+6%) | 6mo | $299,900 | $170 | 46 |
| 577 S 9 Ave | 0.69mi | 4/1.5 | 1,523 (-9%) | 2mo | $168,500 | $111 | 46 |
| 1243 W 2 St | 0.53mi | 3/2.0 (-1) | 1,910 (+15%) | 0mo | $285,000 | $149 | 42 |
| 608 S 8 Ave | 0.73mi | 3/2.0 (-1) | 1,436 (-14%) | 16mo | $250,000 | $174 | 20 |
Match score weights: distance 35% · size 25% · config 20% · recency 20%. Top-matched comps best support the ARV.
Projected returns pro-forma
-3.0% appreciation · 2.04% rent growth · sell at horizon
- IRR
- -12.5%
- Equity multiple
- 0.55×
- Total profit
- $-24,981
- Equity at exit
- $29,806
- IRR
- -4.8%
- Equity multiple
- 0.70×
- Total profit
- $-16,860
- Equity at exit
- $17,284
Cash invested: $55,972 (down + closing). Projections, not guarantees.
Landlord ↔ Tenant lean methodology
- Overall (STATE)
- 87 Strongly Landlord-Friendly
- State Arizona
- 87 Strongly Landlord-Friendly · R+3
- County
- — inherits STATE
- City
- — inherits STATE
ZIP-level market 85364
- Rents YoY
- 2.0%
- Active inventory
- 263
- Price-to-rent
- 10.0×
Monthly cashflow live
- Estimated rent
- $1,667 high interval (Pro) →
- Mortgage (P&I)
- −$1,048
- Tax from tax record
- −$42 /mo · $508/yr
- Insurance
- −$83
- HOA
- −$0
- Vacancy / Maint / Mgmt
- −$350
- Net cashflow
- $143
Break-even live
Sensitivity live
| Price | -10% $256 | -5% $200 | +0% $143 | +5% $86 | +10% $30 |
|---|---|---|---|---|---|
| Rent | -10% $11 | -5% $77 | +0% $143 | +5% $209 | +10% $275 |
| Rate | -1.0pp $244 | -0.5pp $194 | base $143 | +0.5pp $91 | +1.0pp $39 |
UW: 25.0% down · 7.5% · 30yr · 1.5% tax · 5.0% vac · 8.0% maint · 8.0% mgmt
Financing live
Cash to close
- Down payment
- $49,975
- Closing costs
- $5,997
- Reserves months
- —
- Total cash needed
- —
Loan-product check · same deal, 3 products live
Conventional
25% down · 7.5% · 30yr
- Down + closing
- —
- Monthly P&I
- —
- Monthly cashflow
- —
- DSCR
- —
- Eligible?
- —
Personal DTI + credit; lowest rate.
DSCR
20% down · 8.5% · 30yr
- Down + closing
- —
- Monthly P&I
- —
- Monthly cashflow
- —
- DSCR
- —
- Eligible?
- —
No personal income docs; deal must DSCR.
Hard money
10% down · 12.0% · 12mo
- Down + closing
- —
- Monthly P&I
- —
- Monthly cashflow
- —
- DSCR
- —
- Eligible?
- —
Short-term bridge; refi at stabilization.
Rent comps 10 comps
| Address | Beds | Baths | Sqft | Rent | $/sqft | DOM | Units | Dist |
|---|---|---|---|---|---|---|---|---|
| 314 S 21st Ave Yuma, AZ | 3.0 | 2.0 | 1172 | $1,600 | $1.37 | 15d | 1 | 0.28mi |
| 750 S 15th Ave Yuma, AZ | 2.0–3.0 | 2.0 | 1050 | $1,450 | $1.38 | 15d | 2 | 0.30mi |
| 1600 W 12th St Yuma, AZ | 1.0–3.0 | 1.0–2.0 | 779 | $1,400 | $1.80 | 15d | 32 | 0.76mi |
| 1265 S 13th Ave Yuma, AZ | 4.0 | 2.0 | 1301 | $1,800 | $1.38 | 15d | 1 | 1.02mi |
| 1102 S Mustang Ave Unit NA Yuma, AZ | 3.0 | 2.0 | 2100 | $1,650 | $0.79 | 23d | 1 | 1.05mi |
| 2605 W 12th Pl Yuma, AZ | 3.0 | 2.0 | 1227 | $1,495 | $1.22 | 15d | 1 | 1.05mi |
| 593 S 1st Ave Yuma, AZ | 3.0 | 2.0 | 1935 | $1,600 | $0.83 | 15d | 1 | 1.25mi |
| 1425 S 9th Ave Yuma, AZ | 3.0 | 2.0 | 1146 | $1,600 | $1.40 | 15d | 1 | 1.35mi |
| 1928 W 17th St Yuma, AZ | 3.0 | 2.0 | 1134 | $1,750 | $1.54 | 15d | 1 | 1.44mi |
| 3371 W 13th Pl Yuma, AZ | 4.0 | 2.0 | 1994 | $2,380 | $1.19 | 15d | 1 | 1.47mi |
Listing history 27 events
-
2026-06-21days on market $199,900 Active 263 DOM
-
2026-06-19days on market $199,900 Active 261 DOM
-
2026-06-18days on market $199,900 Active 260 DOM
-
2026-06-17days on market $199,900 Active 259 DOM
-
2026-06-16days on market $199,900 Active 258 DOM
-
2026-06-15days on market $199,900 Active 257 DOM
-
2026-06-14days on market $199,900 Active 255 DOM
-
2026-06-13days on market $199,900 Active 254 DOM
-
2026-06-10days on market $199,900 Active 252 DOM
-
2026-06-09days on market $199,900 Active 251 DOM
-
2026-06-08days on market $199,900 Active 250 DOM
-
2026-06-07days on market $199,900 Active 249 DOM
-
2026-06-05days on market $199,900 Active 246 DOM
-
2026-06-02days on market $199,900 Active 244 DOM
-
2026-06-01days on market $199,900 Active 243 DOM
-
2026-05-31days on market $199,900 Active 242 DOM
-
2026-05-30days on market $199,900 Active 241 DOM
-
2025-10-01$199,900 Active
-
2025-04-24soldstatus $110,500 Closed 101-char remark
Show marketing remark (101 chars)
Homeowners have not lived in the home for over 50 years. Investment opportunity in the heart of Yuma.
-
2025-04-24soldstatus $110,500
Show marketing remark (101 chars)
Homeowners have not lived in the home for over 50 years. Investment opportunity in the heart of Yuma.
-
2025-04-17status Pending 101-char remark
Show marketing remark (101 chars)
Homeowners have not lived in the home for over 50 years. Investment opportunity in the heart of Yuma.
-
2025-04-07price $139,999 101-char remark
Show marketing remark (101 chars)
Homeowners have not lived in the home for over 50 years. Investment opportunity in the heart of Yuma.
-
2025-04-01status Active 101-char remark
Show marketing remark (101 chars)
Homeowners have not lived in the home for over 50 years. Investment opportunity in the heart of Yuma.
-
2025-03-28historical Active Under Contract 101-char remark
Show marketing remark (101 chars)
Homeowners have not lived in the home for over 50 years. Investment opportunity in the heart of Yuma.
-
2025-02-13status Active 101-char remark
Show marketing remark (101 chars)
Homeowners have not lived in the home for over 50 years. Investment opportunity in the heart of Yuma.
-
2025-02-07historical Active Under Contract 101-char remark
Show marketing remark (101 chars)
Homeowners have not lived in the home for over 50 years. Investment opportunity in the heart of Yuma.
-
2025-02-04$175,000 Active 101-char remark
Show marketing remark (101 chars)
Homeowners have not lived in the home for over 50 years. Investment opportunity in the heart of Yuma.
ⓘ Source: listings_history table (triggers on properties + properties_extension) + one-shot
backfill from property_details.listing_events for pre-trigger history.
Tax reassessment forecast AZ · Resets to sale price
- Current annual tax
- $508 · $42/mo
- Projected year-2 tax
- $1,319 · $110/mo
- Expected delta
- +$811/yr (+$68/mo · 159.7%)
ⓘ Screening estimate from a state-policy table — verify with the county assessor before closing.
Climate risk First Street
- Flood 1/10 Low FEMA zone X (shaded) · 0% chance over 30 yrs
- Wildfire 2/10 Low
- Heat 9/10 Extreme 7 d/yr ≥114°F today · 20 d/yr by 30 yrs out
- Wind 1/10 Low
- Air quality 2/10 Low 2 unhealthy d/yr today · 2 by 30 yrs out
Nearby sold comps map
Loading sold comps map…
Walkable amenities ~0.75 mi
Loading nearby amenities…
Taxation est. · year 1
- Rental income
- $20,004
- − Mortgage interest
- −$11,198
- − Property taxes
- −$508
- − Insurance
- −$1,000
- − Repairs & maintenance
- −$1,600
- − Management
- −$1,600
- − Depreciation
- −$5,815
- Taxable loss
- −$1,717
- Est. tax savings @ 24.0%
- +$412
- After-tax cash flow
- $2,128/yr
For passive investors: Depreciation is non-cash, so a rental often shows a tax loss while cash-flowing — sheltering income. Rental losses are passive: they offset passive income freely, and up to $25,000/yr can offset ordinary (W-2) income if you actively participate and your MAGI is under $100k (phasing out to $0 by $150k); unused losses carry forward. On sale, claimed depreciation is recaptured at up to 25%, and gains may owe capital-gains tax (a 1031 exchange can defer both). Figures are a year-1 estimate at your 24.0% rate — not tax advice; consult a CPA.
Schools (NCES district)
- District
- Yuma Union High School District (4507)
- NCES district ID
- 0409630
- Math proficiency
- 14% ▼ -12.00%
- Reading proficiency
- 16% ▼ -10.00%
- Median HH income
- $40,512
- Composite
- 12.86/100
- National rank
- #9592
- State rank
- #212 of 249 in AZ
Livability — Yuma
- Score
- 71/100
- State rank
- #30
- US rank
- #6635
Category grades
Schools grade is shown separately in the Schools card above.
Census & demographics
- Census place
- Yuma, AZ
- County
- Yuma County · 149,809 people
- City population
- 149,809
- Metro
- Yuma, AZ
- Population (ZIP)
- 72,960
- Household income
- $57,874
- Rent vs Own
- Severe rent burden
- 2195.0
Population outlook (Yuma County) Hauer SSP2
- Today (2025)
- 211,633 people
- By 2030
- 214,114 · +1.2%
- By 2040
- 217,856 · +2.9%
- By 2050
- 220,276 · +4.1%
- By 2075
- 222,359 · +5.1%
- By 2100
- 198,880 · -6.0%
Race, ethnicity, and origin ACS 2023
- Neighborhood character
- Predominantly Hispanic (70%)
- Race & ethnicity
- Hispanic / Latino 70% Two or more races 29% White 24% Asian 2% Black 2% Native American 1%
- Hispanic origin (detail)
- Mexican 67%
- Common ancestry
- Portuguese 1% Lithuanian 1% Romanian 1%
- Foreign-born
- 22% · Canada
- Languages at home
- 48% English-only · Spanish 50% Tagalog/Filipino 1%
Political lean MEDSL · Yuma
- 2024 margin
- Strong R (+20.4) · D 39.3% · R 59.8%
- 2008→2024 swing
- -6.6pp toward R · 2008: -13.8pp · 2024: -20.4pp
- All cycles
- 2024: R+20.4 2020: R+6.2 2016: R+5.5 2012: R+16.1 2008: R+13.8
Not yet ingested
- Civics
- —
Market trends
- HPI YoY
- ▼ -197.00%
- Current HPI
- 220.8058
- Rent YoY
- ▲ 2.04%
- Metro
- Yuma, AZ
- State GDP YoY
- ▲ 4.54%
- F500 in state
- 20
Industry mix (Fortune 500 HQ in AZ)
| Industry | F500 HQs | Revenue |
|---|---|---|
| Technology | 2 | $13B |
|
||
| Mining / Metals | 1 | $23B |
|
||
| Environmental Services | 1 | $16B |
|
||
| Metals / Steel | 1 | $14B |
|
||
| Technology Distribution | 1 | $9B |
|
||
| Homebuilding | 1 | $8B |
|
||
Price history
+14.2% since first listed10 events — show timeline
- 2025-10-01 Listed $199,900 YAR
- 2025-04-24 Sold (Public Records) $110,500 Public Records
- 2025-04-24 Sold (MLS) $110,500 YAR
- 2025-04-17 Pending — YAR
- 2025-04-07 Price Changed $139,999 YAR
- 2025-04-01 Relisted — YAR
- 2025-03-28 Contingent — YAR
- 2025-02-13 Relisted — YAR
- 2025-02-07 Contingent — YAR
- 2025-02-04 Listed $175,000 YAR
Property tax history
+2.9%/yrLatest (2025): $508 · +3.6% YoY. Source: county tax records.
Cash-flow waterfall
monthlySold comps — $/sqft
last 12 mo · ≤1 miLoading sold comps…