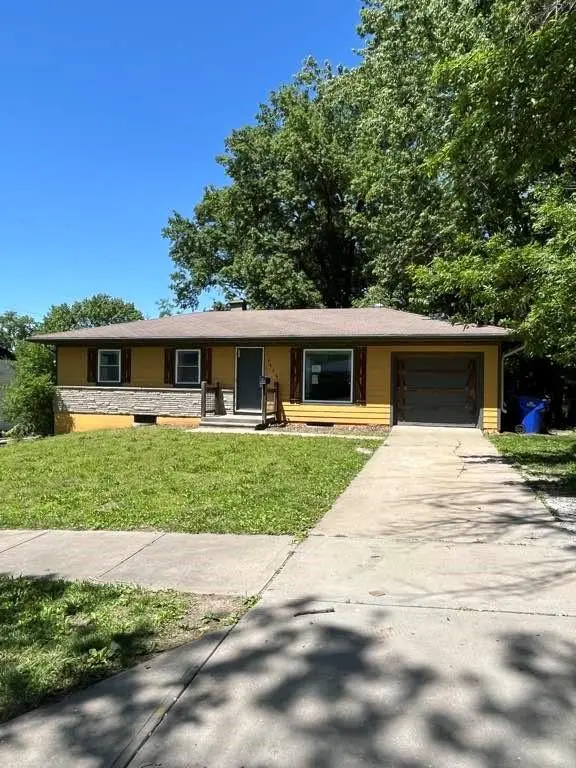
8958 E 54th St S · Raytown, MO
Flood risk 1/10 · Minimal
- FEMA flood zone
- X (unshaded)
- Chance of flooding over 30 yrs
- 0.0%
- Est. flood insurance / yr
- $473 – $860
Fire risk 1/10 · Minimal
- Est. fire insurance / yr
- $1,054 – $1,958
Heat risk 4/10 · Minor
- Hot days now (above 107°F)
- 7 days/yr
- Hot days in 30 yrs
- 17 days/yr
Wind risk 2/10 · Minimal
- Chance of severe wind over 30 yrs
- —
Air-quality risk 3/10 · Minor
- Unhealthy air days now
- 3 days/yr
- Unhealthy air days in 30 yrs
- 5 days/yr
Risk factors via First Street. Map © Google.
Why this score? — see what drove the C+ grade
The composite is a weighted blend of 9 inputs, each scored 0–100. Each bar is that input's sub-score; the figure is the points it added to the 100-point composite (weight × sub-score).
- Cash flow +22.1/30.0
- ARV discount +14.9/15.0
- DSCR +7.1/10.0
- 1% rule +5.8/10.0
- Livability +3.2/5.0
- Rent growth +2.8/5.0
- Condition / age +2.5/5.0
- Schools +1.8/10.0
- Appreciation +0.0/10.0
$129,900
🖨 Deal sheet 📄 Offer letter ✓ Due diligence
Listing remarks MLS
You want a new house. It doesn't get much closer than this. New carpet, kitchen with granite, light fixtures, paint, doors, furnace, and the list keeps going. Custom woodwork on exterior of home. Hardwoods just refinished. Basement has been sectioned off making it easy to finish if desired. This is not a quick rehabbed home. Owner has owned for over 20yrs. Lots of heart has been put in to the refinishing of this home. Kids can walk to school
Key facts
- Spacious yard
- Ample storage
- 0.34 acre lot
Tags
Property features AI
Finance
- Other: Inside city limits; Approximately 0.34-acre lot
- HOA & community: No association fees
Exterior
- Parking: Attached garage with garage door opener; 1-car garage
- Utilities: Public water; Public sewer; Cable available; Fiber available; High-speed internet available
- Home design: Single-family residence; Ranch floor plan; Residential property
- Construction: Board & batten siding; Frame construction; Composition roof; Has basement
- Exterior features: Shed on property; City lot; Paved road with public maintenance
Interior
- Kitchen: Dishwasher; Microwave; Refrigerator; Electric range
- Bedrooms: 3 bedrooms
- Flooring: Carpet
- Bathrooms: 2 full bathrooms
- Heating & cooling: Forced air heating; Electric cooling (central)
- Interior features: Ceiling fans; Custom cabinets
- Laundry & utility: Basement utility with sump pump; Garage entrance to basement; Walk-up basement access
Neighborhood map
What this means for you Summary
Snapshot
- This is a 3-bed/1.0-bath single-family listed at $130k.
Deal economics
- At list price, monthly cash flow is $209 ($3k/yr) — positive.
- The deal already cash-flows at list — no discount required.
- Meets the 1% rule at list price ($1k rent vs $130k).
- Recommended offer: $128k (1.5% below list) — sets the bar for market timing.
- Cap rate 8.2% vs local median 5.0% in Raytown — top-decile yield for the area; either an underpriced asset or a hidden risk that comps aren't pricing in. Stress-test before assuming the spread holds.
Location & tenants
- Location reads 65/100 on livability (#281 in MO) — a middle-class / working-renter tenant base. Strengths: cost of living A+, housing A+, health & safety B+; Watch: crime F, amenities F, commute F.
- Raytown C-2 (suburban): math 12% / reading 28% proficiency, ranked #302 of 324 in MO (top 93%) — low school quality limits family demand, transient renter base, plan for 1-2y turnover.
- Zoned schools: Laurel Hills Elem. (math 12% / reading 32%, grade F, #910 of 1,115 statewide, top 83%, 314 students, 71% FRL); Raytown Sr. High (math 7% / reading 29%, grade F, #482 of 521 statewide, top 92%, 1,365 students, 65% FRL).
- Market conditions: Rents rising (+1.3%/yr); 203 active listings in the ZIP; 16 comparable units currently listed for rent nearby; rentals leasing fast (median 13d on market — plan ~1-2 weeks tenant-placement turnaround); 4,002 units permitted in Jackson County in 2024 (2,271 in 5+ unit buildings).
Forward outlook
- Local home prices are declining (-3.0%/yr); year-one equity from $898 of loan paydown is wiped out by about $4k of value loss. Plan a longer hold.
- Jackson County population projected at +4% by 2050 — modest demand growth; plan on rents tracking national, not racing it.
Negotiation context
- It's been on market 21 days — a 2% lower offer ($128k) is reasonable based on typical stale-listing flexibility.
- 2 sale attempts since 10y ago with the ask held roughly flat each time — persistent listings suggest the price (not the market) is what's stuck; bring a comps-based counter.
Risks & watch-outs
- Watch-outs: built in 1956 — expect roof / HVAC / electrical / plumbing capex.
Questions for the listing agent
- Built in 1956 — when were the roof, HVAC, electrical panel, plumbing, and water heater last replaced?
- Is there a deadline driving the sale (1031 exchange, divorce, estate, relocation)? That informs how much negotiation room exists.
- Schools are D-rated, which usually means shorter tenancies and higher turnover. Who's the typical renter profile here, and what's been the actual vacancy rate?
- Crime grade is F in this area — have there been break-ins, vandalism, or insurance claims at this property in the last 3 years? What carrier currently insures it and at what premium?
- What's the average days-on-market for RENTAL listings here right now (not sales)? A rising rental-DOM trend means longer vacancies and softer asking-rent achievability than the comps imply.
- What's the recent tenant-quality profile in this submarket — average credit score on applications, eviction rate, late-payment / NSF rate, and stable-employment percentage? A property-management company in the area should have these aggregated.
- How much new for-sale + rental construction is in the pipeline within 1–3 miles? Heavy new supply typically softens prices + rents 12–24 months out; constrained supply supports both.
Investment metrics
- 1% rule
- 1.08% ✓
- Cap rate
- 8.22%
- Cash-on-cash
- 6.88%
- DSCR
- 1.31
- GRM
- 7.7
CMA / ARV
- ARV (median comp)
- $155,645
- List price
- $129,900
- Delta
- -16.54%
- Verdict
- UNDERPRICED
- Comps
- 20 within 1.0 mi
Show comp detail 12 sales within ~0.75 mi
| Address | Dist | Beds/Ba | Sqft | Sold | Price | $/sf | Match |
|---|---|---|---|---|---|---|---|
| 5317 Hunter St | 0.07mi | 3/1.0 | 912 (0%) | 9mo | $187,500 | $206 | 90 |
| 8806 E 55th St | 0.18mi | 3/1.0 | 846 (-7%) | 6mo | $118,000 | $139 | 74 |
| 8812 E 54th St | 0.17mi | 3/1.0 | 1,008 (+10%) | 4mo | $100,000 | $99 | 71 |
| 5605 Ditzler Ave | 0.37mi | 2/1.0 (-1) | 960 (+5%) | 2mo | $134,900 | $141 | 68 |
| 5529 Hunter St | 0.22mi | 3/1.0 | 1,005 (+10%) | 8mo | $139,900 | $139 | 67 |
| 5709 Elm Ave | 0.50mi | 2/1.0 (-1) | 880 (-4%) | 3mo | $159,900 | $182 | 63 |
| 5537 Hunter St | 0.24mi | 2/1.0 (-1) | 997 (+9%) | 8mo | $135,000 | $135 | 62 |
| 8804 E 59th Ter | 0.68mi | 3/1.0 | 864 (-5%) | 2mo | $184,900 | $214 | 58 |
| 5804 Manning Ave | 0.54mi | 3/1.5 | 984 (+8%) | 2mo | $187,000 | $190 | 58 |
| 5801 Elm Ave | 0.60mi | 3/1.0 | 1,044 (+14%) | 3mo | $184,900 | $177 | 45 |
| 5910 Kentucky Ave | 0.70mi | 3/2.0 | 1,008 (+10%) | 1mo | $100,000 | $99 | 45 |
| 8803 E 49th St | 0.66mi | 3/1.0 | 1,020 (+12%) | 8mo | $172,000 | $169 | 43 |
Match score weights: distance 35% · size 25% · config 20% · recency 20%. Top-matched comps best support the ARV.
Projected returns pro-forma
-3.0% appreciation · 1.34% rent growth · sell at horizon
- IRR
- -7.6%
- Equity multiple
- 0.72×
- Total profit
- $-10,049
- Equity at exit
- $19,369
- IRR
- -0.3%
- Equity multiple
- 0.98×
- Total profit
- $-715
- Equity at exit
- $11,231
Cash invested: $36,372 (down + closing). Projections, not guarantees.
Landlord ↔ Tenant lean methodology
- Overall (STATE)
- 81 Strongly Landlord-Friendly
- State Missouri
- 81 Strongly Landlord-Friendly · R+10
- County
- — inherits STATE
- City
- — inherits STATE
ZIP-level market 64133
- Rents YoY
- 1.3%
- Active inventory
- 203
- Price-to-rent
- 7.7×
Monthly cashflow live
- Estimated rent
- $1,407 high interval (Pro) →
- Mortgage (P&I)
- −$681
- Tax from tax record
- −$167 /mo · $2,008/yr
- Insurance
- −$54
- HOA
- −$0
- Vacancy / Maint / Mgmt
- −$295
- Net cashflow
- $209
Break-even live
UW: 25.0% down · 7.5% · 30yr · 1.5% tax · 5.0% vac · 8.0% maint · 8.0% mgmt
Financing live
Cash to close
- Down payment
- $32,475
- Closing costs
- $3,897
- Reserves months
- —
- Total cash needed
- —
Loan-product check · same deal, 3 products live
Conventional
25% down · 7.5% · 30yr
- Down + closing
- —
- Monthly P&I
- —
- Monthly cashflow
- —
- DSCR
- —
- Eligible?
- —
Personal DTI + credit; lowest rate.
DSCR
20% down · 8.5% · 30yr
- Down + closing
- —
- Monthly P&I
- —
- Monthly cashflow
- —
- DSCR
- —
- Eligible?
- —
No personal income docs; deal must DSCR.
Hard money
10% down · 12.0% · 12mo
- Down + closing
- —
- Monthly P&I
- —
- Monthly cashflow
- —
- DSCR
- —
- Eligible?
- —
Short-term bridge; refi at stabilization.
Rent comps 16 comps
| Address | Beds | Baths | Sqft | Rent | $/sqft | DOM | Units | Dist |
|---|---|---|---|---|---|---|---|---|
| 5312 Hunter St Raytown, MO | 3.0 | 1.5 | 912 | $1,450 | $1.59 | 3d | 1 | 0.12mi |
| 5312 Hunter St Raytown, MO | 3.0 | 1.5 | 912 | $1,450 | $1.59 | 2d | 1 | 0.12mi |
| 5126 Booth Ave Kansas City, MO | 2.0 | 1.0 | 950 | $1,149 | $1.21 | 12d | 1 | 0.57mi |
| 8855 E 59th St Raytown, MO | 3.0 | 1.5 | 864 | $1,396 | $1.62 | 43d | 1 | 0.62mi |
| 10005 E 53rd St Raytown, MO | 3.0 | 1.0 | 700 | $1,250 | $1.79 | 3d | 1 | 0.81mi |
| 10005 E 53rd St Raytown, MO | 3.0 | 1.0 | 700 | $1,250 | $1.79 | 2d | 1 | 0.81mi |
| 5943 Raytown Rd Unit F Raytown, MO | 2.0 | 1.0 | 750 | $1,150 | $1.53 | 43d | 1 | 1.09mi |
| 9805 E 61st St Raytown, MO | 1.0–2.0 | 1.0 | 758 | $924 | $1.22 | 2d | 39 | 1.12mi |
| 7601 Sni a Bar Ter Kansas City, MO | 2.0 | 1.0 | 827 | $1,099 | $1.33 | 43d | 1 | 1.17mi |
| 7615 E 49th St Kansas City, MO | 2.0 | 1.0 | 888 | $1,095 | $1.23 | 43d | 1 | 1.18mi |
| 10621 E 56th St Raytown, MO | 2.0 | 1.0 | 768 | $1,340 | $1.74 | 3d | 1 | 1.21mi |
| 10309 E 61st St Raytown, MO | 1.0–2.0 | 1.0 | 695 | $1,100 | $1.58 | 1d | 2 | 1.34mi |
| 4934 Appleton Ave Kansas City, MO | 3.0 | 2.0 | 1000 | $1,395 | $1.40 | 16d | 1 | 1.36mi |
| 7611 E 47th Ter Kansas City, MO | 3.0 | 1.0 | 840 | $1,276 | $1.52 | 7d | 1 | 1.36mi |
| 4730 Richmond Ave Kansas City, MO | 3.0 | 1.0 | 821 | $1,395 | $1.70 | 43d | 1 | 1.39mi |
| 10318 E 63rd St Raytown, MO | 1.0–2.0 | 1.0–1.5 | 785 | $1,200 | $1.53 | 23d | 2 | 1.45mi |
Listing history 11 events
-
2026-06-07statusdays on market $129,900 Pending 21 DOM
-
2026-06-03days on market $129,900 Active 19 DOM
-
2026-06-02days on market $129,900 Active 18 DOM
-
2026-06-01days on market $129,900 Active 17 DOM
-
2026-05-31days on market $129,900 Active 16 DOM
-
2026-05-15$129,900 Active 1106-char remark
-
2016-08-02soldstatus
-
2016-07-29soldstatus Sold 445-char remark
Show marketing remark (445 chars)
You want a new house. It doesn't get much closer than this. New carpet, kitchen with granite, light fixtures, paint, doors, furnace, and the list keeps going. Custom woodwork on exterior of home. Hardwoods just refinished. Basement has been sectioned off making it easy to finish if desired. This is not a quick rehabbed home. Owner has owned for over 20yrs. Lots of heart has been put in to the refinishing of this home. Kids can walk to school
-
2016-06-04historical Contingent - Accepting Backup Offers 445-char remark
Show marketing remark (445 chars)
You want a new house. It doesn't get much closer than this. New carpet, kitchen with granite, light fixtures, paint, doors, furnace, and the list keeps going. Custom woodwork on exterior of home. Hardwoods just refinished. Basement has been sectioned off making it easy to finish if desired. This is not a quick rehabbed home. Owner has owned for over 20yrs. Lots of heart has been put in to the refinishing of this home. Kids can walk to school
-
2016-05-05$100,000 Active 445-char remark
Show marketing remark (445 chars)
You want a new house. It doesn't get much closer than this. New carpet, kitchen with granite, light fixtures, paint, doors, furnace, and the list keeps going. Custom woodwork on exterior of home. Hardwoods just refinished. Basement has been sectioned off making it easy to finish if desired. This is not a quick rehabbed home. Owner has owned for over 20yrs. Lots of heart has been put in to the refinishing of this home. Kids can walk to school
-
1995-02-14soldstatus
ⓘ Source: listings_history table (triggers on properties + properties_extension) + one-shot
backfill from property_details.listing_events for pre-trigger history.
Tax reassessment forecast MO · Resets to sale price
- Current annual tax
- $2,008 · $167/mo
- Projected year-2 tax
- $2,008 · $167/mo
- Expected delta
- $0/yr ($0/mo · 0.0%)
ⓘ Screening estimate from a state-policy table — verify with the county assessor before closing.
Climate risk First Street
- Flood 1/10 Low FEMA zone X (unshaded) · 0% chance over 30 yrs
- Wildfire 1/10 Low
- Heat 4/10 Moderate 7 d/yr ≥107°F today · 17 d/yr by 30 yrs out
- Wind 2/10 Low
- Air quality 3/10 Moderate 3 unhealthy d/yr today · 5 by 30 yrs out
Nearby sold comps map
Loading sold comps map…
Walkable amenities ~0.75 mi
Loading nearby amenities…
Taxation est. · year 1
- Rental income
- $16,880
- − Mortgage interest
- −$7,276
- − Property taxes
- −$2,008
- − Insurance
- −$650
- − Repairs & maintenance
- −$1,350
- − Management
- −$1,350
- − Depreciation
- −$3,779
- Taxable income
- $467
- Est. tax owed @ 24.0%
- −$112
- After-tax cash flow
- $2,392/yr
For passive investors: Depreciation is non-cash, so a rental often shows a tax loss while cash-flowing — sheltering income. Rental losses are passive: they offset passive income freely, and up to $25,000/yr can offset ordinary (W-2) income if you actively participate and your MAGI is under $100k (phasing out to $0 by $150k); unused losses carry forward. On sale, claimed depreciation is recaptured at up to 25%, and gains may owe capital-gains tax (a 1031 exchange can defer both). Figures are a year-1 estimate at your 24.0% rate — not tax advice; consult a CPA.
Schools (NCES district)
- District
- Raytown C-2
- NCES district ID
- 2926070
- Math proficiency
- 12% ▼ -11.00%
- Reading proficiency
- 28% ▼ -9.00%
- Median HH income
- $47,215
- Composite
- 17.59/100
- National rank
- #9039
- State rank
- #302 of 324 in MO
Livability — Raytown
- Score
- 65/100
- State rank
- #281
- US rank
- #13079
Category grades
Schools grade is shown separately in the Schools card above.
Census & demographics
- Census place
- Raytown, MO
- County
- Jackson County · 687,798 people
- City population
- 60,054
- Metro
- Kansas City, MO-KS
- Population (ZIP)
- 36,249
- Household income
- $67,750
- Rent vs Own
- Severe rent burden
- 1173.0
Population outlook (Jackson County) Hauer SSP2
- Today (2025)
- 719,589 people
- By 2030
- 731,456 · +1.6%
- By 2040
- 746,689 · +3.8%
- By 2050
- 749,289 · +4.1%
- By 2075
- 736,227 · +2.3%
- By 2100
- 668,210 · -7.1%
Race, ethnicity, and origin ACS 2023
- Neighborhood character
- Diverse neighborhood (Simpson 0.64)
- Race & ethnicity
- White 46% Black 37% Hispanic / Latino 12% Two or more races 9%
- Hispanic origin (detail)
- Mexican 10%
- Common ancestry
- Italian 7% Slovak 1% Lithuanian 1%
- Foreign-born
- 5% · Canada
- Languages at home
- 90% English-only · Spanish 7% French/Haitian/Cajun 1%
Political lean MEDSL · Jackson
- 2024 margin
- D (+19.3) · D 58.9% · R 39.5% · Other 1.6%
- 2008→2024 swing
- -6.1pp toward R · 2008: 25.4pp · 2024: 19.3pp
- All cycles
- 2024: D+19.3 2020: D+22.0 2016: D+16.6 2012: D+19.0 2008: D+25.4
Not yet ingested
- Civics
- —
Market trends
- HPI YoY
- ▼ -155.40%
- Current HPI
- 263.6915
- Rent YoY
- ▲ 1.34%
- Metro
- Kansas City, MO-KS
- State GDP YoY
- ▲ 1.84%
- F500 in state
- 20
Industry mix (Fortune 500 HQ in MO)
| Industry | F500 HQs | Revenue |
|---|---|---|
| Healthcare | 1 | $163B |
|
||
| Insurance | 1 | $21B |
|
||
| Industrial Technology | 1 | $17B |
|
||
| Retail | 1 | $16B |
|
||
| Industrial Distribution | 1 | $10B |
|
||
| Utilities | 1 | $9B |
|
||
Price history
+29.9% since first listed7 events — show timeline
- 2026-06-05 Pending — Heartland MLS as Distributed by MLS Grid
- 2026-05-15 Listed $129,900 Heartland MLS as Distributed by MLS Grid
- 2016-08-02 Sold (Public Records) — Public Records
- 2016-07-29 Sold (MLS) — Heartland MLS as Distributed by MLS Grid
- 2016-06-04 Contingent — Heartland MLS as Distributed by MLS Grid
- 2016-05-05 Listed $100,000 Heartland MLS as Distributed by MLS Grid
- 1995-02-14 Sold (Public Records) — Public Records
Property tax history
+4.3%/yrLatest (2025): $2,008 · +12.1% YoY. Source: county tax records.
Cash-flow waterfall
monthlySold comps — $/sqft
last 12 mo · ≤1 miLoading sold comps…