 5-Plex
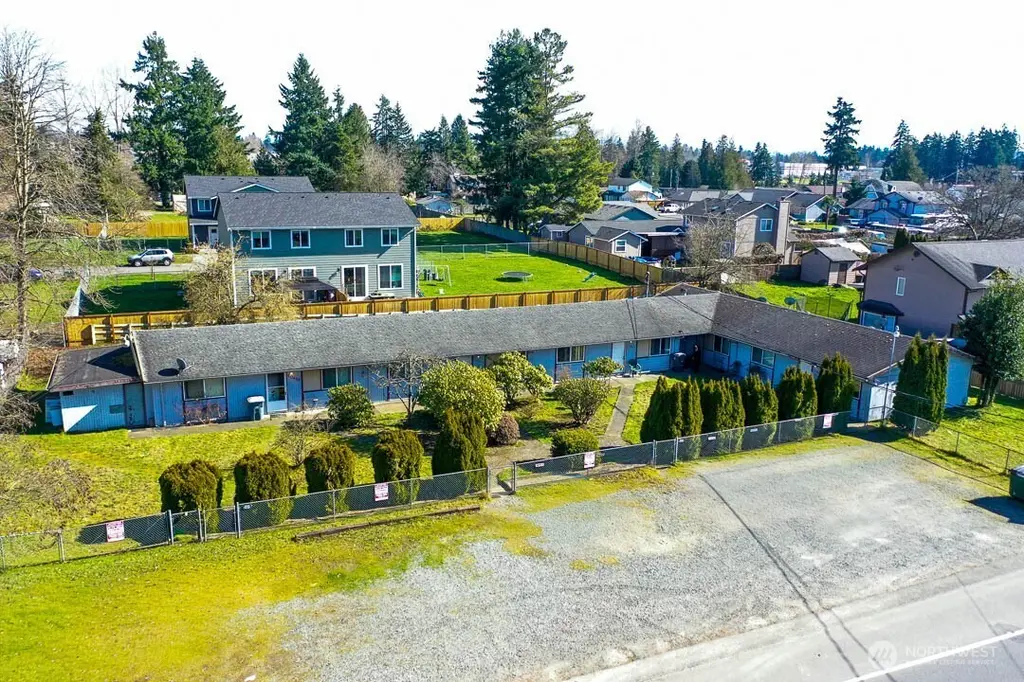
10415 10423 Golden Given Rd E · Midland, WA
Flood risk 1/10 · Minimal
- FEMA flood zone
- X (unshaded)
- Chance of flooding over 30 yrs
- 0.0%
- Est. flood insurance / yr
- $507 – $1,088
Fire risk 1/10 · Minimal
- Est. fire insurance / yr
- $604 – $1,122
Heat risk 3/10 · Minor
- Hot days now (above 87°F)
- 7 days/yr
- Hot days in 30 yrs
- 14 days/yr
Wind risk 1/10 · Minimal
- Chance of severe wind over 30 yrs
- —
Air-quality risk 7/10 · Major
- Unhealthy air days now
- 10 days/yr
- Unhealthy air days in 30 yrs
- 12 days/yr
Risk factors via First Street. Map © Google.
Why this score? — see what drove the C+ grade
The composite is a weighted blend of 9 inputs, each scored 0–100. Each bar is that input's sub-score; the figure is the points it added to the 100-point composite (weight × sub-score).
- Cash flow +25.3/30.0
- DSCR +8.3/10.0
- ARV discount +8.0/15.0
- 1% rule +6.6/10.0
- Schools +3.9/10.0
- Livability +3.6/5.0
- Rent growth +3.0/5.0
- Condition / age +2.2/5.0
- Appreciation +0.0/10.0
$799,997
🖨 Deal sheet (PDF) 📄 Offer letter ✓ Due diligence
Multi-family units
County records classify this as Multi-Family (5+ Unit). Listing-text estimate: 5 units. confirmed
5+ unit building — per-unit beds/baths from public records are typically unavailable; the breakdown below (if shown) is an estimate from the listing text.
Listing remarks
Opportunity to acquire a 5-plex in Tacoma’s Midland neighborhood, offering strong income and straightforward operations. The property consists of five 2-bedroom, 1-bath units, each approximately 700 square feet, providing a consistent unit mix with steady rental demand for multi-bedroom housing. The asset currently generates $56,469 in annual Net Operating Income, reflecting a 7.06% cap rate, presenting investors with immediate cash flow from day one. With the same layout across all units, the property allows for simplified management and leasing. Located in Tacoma’s Midland area, the property benefits from proximity to major commuter routes, shopping centers, and everyday ameni
Key facts
- Midland neighborhood
- Multifamily property
- Strong income
Tags
Neighborhood map
What this means for you Summary
Snapshot
- This is a 5 × 2-bed/1-bath units multifamily listed at $800k. Condition is rated fair.
Deal economics
- At list price, monthly cash flow is $2k ($22k/yr) — positive. Per door: $364/mo.
- The deal already cash-flows at list — no discount required.
- Meets the 1% rule at list price ($9k rent vs $800k).
- Recommended offer: $728k (9.0% below list) — sets the bar for market timing.
- Cap rate 9.0% vs local median 3.2% in Midland — top-decile yield for the area; either an underpriced asset or a hidden risk that comps aren't pricing in. Stress-test before assuming the spread holds.
Location & tenants
- Location reads 72/100 on livability (#208 in WA) — a middle-class / working-renter tenant base. Strengths: housing A+, health & safety A+; Watch: crime D, schools F, amenities F.
- Franklin Pierce School District (suburban): math 35% / reading 51% proficiency, ranked #197 of 291 in WA (top 68%) — families likely to look elsewhere, expect single-tenant / working-renter base with shorter leases.
- Market conditions: Rents rising (+2.0%/yr); 234 active listings in the ZIP; solid renter incomes; 3,209 units permitted in Pierce County in 2024 (1,269 in 5+ unit buildings).
- At $9,301/mo this rent would consume 121% of the median local household income ($93k/yr) (locally 1085% of renters already pay >50% of income on rent) — very limited rent-growth headroom before tenants either downsize or default.
Forward outlook
- Local home prices are declining (-3.0%/yr); year-one equity from $6k of loan paydown is wiped out by about $24k of value loss. Plan a longer hold.
- Pierce County population projected at +26% by 2050 — long-run rental-demand tailwind backs the buy-and-hold thesis.
Negotiation context
- It's been on market 91 days — a 9% lower offer ($728k) is reasonable based on typical stale-listing flexibility.
- 3 sale attempts since 11y ago; this cycle's ask has dropped $99k (11%) from the opening price — seller is motivated, your offer sets the floor, not the list.
- Current owner paid $350k; list at $800k implies a 129% gain — meaningful room to come down on a strong offer.
Questions for the listing agent
- It's been on market 91 days. Have you received any prior offers? Is the seller open to a 9% concession, seller financing, or rate buy-down credit?
- Can we see the unit-by-unit rent roll, current vacancy, and any below-market leases? What's the average tenancy length?
- What capital expenditures (roof, boiler, parking lot, exteriors) have been made in the last 5 years, and what's planned in the next 2?
- Have any recent inspections been done? Can we get a copy of the seller's disclosures and any deferred-maintenance estimates?
- Built in 1962 — when were the roof, HVAC, electrical panel, plumbing, and water heater last replaced?
- Why hasn't it sold? Are there any deal-killer items the seller is aware of (foundation, flood, title, zoning, code violations)?
- Is there a deadline driving the sale (1031 exchange, divorce, estate, relocation)? That informs how much negotiation room exists.
- Schools are F-rated, which usually means shorter tenancies and higher turnover. Who's the typical renter profile here, and what's been the actual vacancy rate?
- Crime grade is D in this area — have there been break-ins, vandalism, or insurance claims at this property in the last 3 years? What carrier currently insures it and at what premium?
- What's the average days-on-market for RENTAL listings here right now (not sales)? A rising rental-DOM trend means longer vacancies and softer asking-rent achievability than the comps imply.
- What's the recent tenant-quality profile in this submarket — average credit score on applications, eviction rate, late-payment / NSF rate, and stable-employment percentage? A property-management company in the area should have these aggregated.
- How much new apartment / multifamily construction is in the pipeline within 1–3 miles? Heavy new supply (>2% of stock underway) typically softens rents 12–24 months out; light construction supports rent growth.
Investment metrics
- 1% rule
- 1.16% ✓
- Cap rate
- 9.02%
- Cash-on-cash
- 9.75%
- DSCR
- 1.43
- GRM
- 7.2
CMA / ARV
- ARV (median comp)
- $809,045
- List price
- $799,997
- Delta
- -1.12%
- Verdict
- FAIR
- Comps
- 5 within 1.0 mi
Projected returns pro-forma
-3.0% appreciation · 2.05% rent growth · sell at horizon
- IRR
- -2.7%
- Equity multiple
- 0.90×
- Total profit
- $-22,436
- Equity at exit
- $119,282
- IRR
- 5.9%
- Equity multiple
- 1.42×
- Total profit
- $94,773
- Equity at exit
- $69,169
Cash invested: $223,999 (down + closing). Projections, not guarantees.
Landlord ↔ Tenant lean methodology
- Overall (STATE)
- 28 Tenant-Leaning
- State Washington
- 28 Tenant-Leaning · D+8
- County
- — inherits STATE
- City
- — inherits STATE
ZIP-level market 98445
- Rents YoY
- 2.0%
- Active inventory
- 234
- Price-to-rent
- 35.8×
Monthly cashflow live
- Estimated rent
- $9,301 high interval (Pro) →
- Mortgage (P&I)
- −$4,195
- Tax est. 1.5%
- −$1,000 /mo · $12,000/yr
- Insurance
- −$333
- HOA
- −$0
- Vacancy / Maint / Mgmt
- −$1,953
- Net cashflow
- $1,819
Break-even live
Sensitivity live
| Price | -10% $2,372 | -5% $2,096 | +0% $1,819 | +5% $1,543 | +10% $1,266 |
|---|---|---|---|---|---|
| Rent | -10% $1,084 | -5% $1,452 | +0% $1,819 | +5% $2,187 | +10% $2,554 |
| Rate | -1.0pp $2,222 | -0.5pp $2,023 | base $1,819 | +0.5pp $1,612 | +1.0pp $1,401 |
5-unit breakdown (identical units grouped — click to expand)
| Units | Beds | Baths | Est. rent |
|---|---|---|---|
| 5× units | 2 | 1 | $9,300 |
| #1 | 2 | 1 | $1,860 |
| #2 | 2 | 1 | $1,860 |
| #3 | 2 | 1 | $1,860 |
| #4 | 2 | 1 | $1,860 |
| #5 | 2 | 1 | $1,860 |
| Total (5 units) | $9,301 | ||
UW: 25.0% down · 7.5% · 30yr · 1.5% tax · 5.0% vac · 8.0% maint · 8.0% mgmt
Financing live
Cash to close
- Down payment
- $199,999
- Closing costs
- $24,000
- Reserves months
- —
- Total cash needed
- —
Loan-product check · same deal, 3 products live
Conventional
25% down · 7.5% · 30yr
- Down + closing
- —
- Monthly P&I
- —
- Monthly cashflow
- —
- DSCR
- —
- Eligible?
- —
Personal DTI + credit; lowest rate.
DSCR
20% down · 8.5% · 30yr
- Down + closing
- —
- Monthly P&I
- —
- Monthly cashflow
- —
- DSCR
- —
- Eligible?
- —
No personal income docs; deal must DSCR.
Hard money
10% down · 12.0% · 12mo
- Down + closing
- —
- Monthly P&I
- —
- Monthly cashflow
- —
- DSCR
- —
- Eligible?
- —
Short-term bridge; refi at stabilization.
Listing history 23 events
-
2026-06-18days on market $799,997 Active 91 DOM
-
2026-06-17price $799,997 Active 90 DOM
-
2026-06-17days on market $849,998 Active 90 DOM
-
2026-06-16days on market $849,998 Active 89 DOM
-
2026-06-15days on market $849,998 Active 88 DOM
-
2026-06-13days on market $849,998 Active 86 DOM
-
2026-06-13days on market $849,998 Active 85 DOM
-
2026-06-09days on market $849,998 Active 82 DOM
-
2026-06-08days on market $849,998 Active 81 DOM
-
2026-06-07days on market $849,998 Active 80 DOM
-
2026-06-04days on market $849,998 Active 77 DOM
-
2026-06-03days on market $849,998 Active 76 DOM
-
2026-06-02days on market $849,998 Active 75 DOM
-
2026-06-01days on market $849,998 Active 74 DOM
-
2026-05-31days on market $849,998 Active 73 DOM
-
2026-05-14status Active
-
2026-05-14price $849,998
-
2026-04-30status Pending
-
2026-03-05$899,000 Active
-
2015-08-14soldstatus $349,950 Sold
-
2015-05-28status Pending Feasibility
-
2015-05-18price $349,950
-
2015-03-23$375,000 Active
ⓘ Source: listings_history table (triggers on properties + properties_extension) + one-shot
backfill from property_details.listing_events for pre-trigger history.
Climate risk First Street
- Flood 1/10 Low FEMA zone X (unshaded) · 0% chance over 30 yrs
- Wildfire 1/10 Low
- Heat 3/10 Moderate 7 d/yr ≥87°F today · 14 d/yr by 30 yrs out
- Wind 1/10 Low
- Air quality 7/10 Severe 10 unhealthy d/yr today · 12 by 30 yrs out
Nearby sold comps map
Loading sold comps map…
Walkable amenities ~0.75 mi
Loading nearby amenities…
Taxation est. · year 1
- Rental income
- $111,612
- − Mortgage interest
- −$44,812
- − Property taxes
- −$12,000
- − Insurance
- −$4,000
- − Repairs & maintenance
- −$8,929
- − Management
- −$8,929
- − Depreciation
- −$23,273
- Taxable income
- $9,669
- Est. tax owed @ 24.0%
- −$2,321
- After-tax cash flow
- $19,510/yr
For passive investors: Depreciation is non-cash, so a rental often shows a tax loss while cash-flowing — sheltering income. Rental losses are passive: they offset passive income freely, and up to $25,000/yr can offset ordinary (W-2) income if you actively participate and your MAGI is under $100k (phasing out to $0 by $150k); unused losses carry forward. On sale, claimed depreciation is recaptured at up to 25%, and gains may owe capital-gains tax (a 1031 exchange can defer both). Figures are a year-1 estimate at your 24.0% rate — not tax advice; consult a CPA.
Condition & rehab AI · 10 photos
This 5-plex in Midland, Tacoma is in fair condition with moderate repairs needed. Upgrading the kitchen and bathrooms, along with fresh paint and landscaping, would significantly increase its value.
Repairs flagged
- Major kitchen cabinets — severely outdated and in poor condition
- Major bathroom fixtures — dated and in poor condition
- Moderate exterior paint — some discoloration and peeling
- Major flooring — dated and worn
- Moderate interior paint — some discoloration and peeling
- Moderate windows — frames appear worn
Value-add opportunities
- Both kitchen renovation — modernizing the kitchen would significantly increase both resale and rental value
- Both bathroom updates — modernizing bathrooms would increase both resale and rental value
- Both exterior paint — fresh paint would improve curb appeal and increase both resale and rental value
- Both landscaping — trimming and improving landscaping would increase both resale and rental value
Renovation cost estimate screening
| Repair item | Severity | Est. cost |
|---|---|---|
| kitchen cabinets · severely outdated and in poor condition | Major | $15,000–50,000 |
| bathroom fixtures · dated and in poor condition | Major | $15,000–50,000 |
| exterior paint · some discoloration and peeling | Moderate | $3,000–15,000 |
| flooring · dated and worn | Major | $15,000–50,000 |
| interior paint · some discoloration and peeling | Moderate | $3,000–15,000 |
| windows · frames appear worn | Moderate | $3,000–15,000 |
| Total estimated repair cost · 6 items | $54,000–195,000 |
Value-add ROI direction
- Both kitchen renovation — modernizing the kitchen would significantly increase both resale and rental value ↑
- Both bathroom updates — modernizing bathrooms would increase both resale and rental value ↑
- Both exterior paint — fresh paint would improve curb appeal and increase both resale and rental value ↑
- Both landscaping — trimming and improving landscaping would increase both resale and rental value ↑
ⓘ Cost ranges are severity-bucket heuristics (US national rule-of-thumb). Get contractor quotes + a written scope before underwriting a rehab budget.
Schools (NCES district)
- District
- Franklin Pierce School District
- NCES district ID
- 5302940
- Math proficiency
- 35% ▬ 0.00%
- Reading proficiency
- 51% ▲ 2.00%
- Median HH income
- $49,240
- Composite
- 39.18/100
- National rank
- #8227
- State rank
- #197 of 291 in WA
Livability — Midland
- Score
- 72/100
- State rank
- #208
- US rank
- #5731
Category grades
Schools grade is shown separately in the Schools card above.
Census & demographics
- Census place
- Midland, WA
- County
- Pierce County · 788,257 people
- Metro
- Seattle-Tacoma-Bellevue, WA
- Population (ZIP)
- 33,684
- Household income
- $92,520
- Rent vs Own
- Severe rent burden
- 1085.0
Population outlook (Pierce County) Hauer SSP2
- Today (2025)
- 956,648 people
- By 2030
- 1,010,862 · +5.7%
- By 2040
- 1,113,170 · +16.4%
- By 2050
- 1,206,524 · +26.1%
- By 2075
- 1,436,425 · +50.2%
- By 2100
- 1,563,654 · +63.5%
Race, ethnicity, and origin ACS 2023
- Neighborhood character
- Diverse neighborhood (Simpson 0.69)
- Race & ethnicity
- White 53% Two or more races 17% Hispanic / Latino 14% Black 10% Asian 6% Native American 4% Pacific Islander 3%
- Hispanic origin (detail)
- Mexican 10%
- Common ancestry
- Portuguese 3% Lithuanian 2% Italian 2%
- Foreign-born
- 12% · Canada, South Korea, Vietnam
- Languages at home
- 81% English-only · Spanish 8% Other Asian/Pacific 3% Russian/Polish/Slavic 2%
Political lean MEDSL · Pierce
- 2024 margin
- D (+10.8) · D 53.9% · R 43.1% · Other 3.0%
- 2008→2024 swing
- -1.4pp toward R · 2008: 12.2pp · 2024: 10.8pp
- All cycles
- 2024: D+10.8 2020: D+11.2 2016: D+7.5 2012: D+11.0 2008: D+12.2
Not yet ingested
- Civics
- —
Market trends
- HPI YoY
- ▼ -471.23%
- Current HPI
- 316.202
- Rent YoY
- ▲ 2.05%
- Metro
- Seattle-Tacoma-Bellevue, WA
- State GDP YoY
- ▲ 4.65%
- F500 in state
- 22
Industry mix (Fortune 500 HQ in WA)
| Industry | F500 HQs | Revenue |
|---|---|---|
| Retail | 2 | $269B |
|
||
| Technology / Retail | 1 | $638B |
|
||
| Technology | 1 | $245B |
|
||
| Telecommunications | 1 | $38B |
|
||
| Food / Beverage | 1 | $36B |
|
||
| Automotive / Trucks | 1 | $34B |
|
||
Price history
+126.7% since first listed8 events — show timeline
- 2026-05-14 Relisted — NWMLS as Distributed by MLS Grid
- 2026-05-14 Price Changed $849,998 NWMLS as Distributed by MLS Grid
- 2026-04-30 Pending — NWMLS as Distributed by MLS Grid
- 2026-03-05 Listed $899,000 NWMLS as Distributed by MLS Grid
- 2015-08-14 Sold (MLS) $349,950 NWMLS as Distributed by MLS Grid
- 2015-05-28 Pending — NWMLS as Distributed by MLS Grid
- 2015-05-18 Price Changed $349,950 NWMLS as Distributed by MLS Grid
- 2015-03-23 Listed $375,000 NWMLS as Distributed by MLS Grid
Cash-flow waterfall
monthlySold comps — $/sqft
last 12 mo · ≤1 miLoading sold comps…