738 Cleaver Farms Rd · Middletown, DE
Flood risk No data
- FEMA flood zone
- —
- Chance of flooding over 30 yrs
- —
- Est. flood insurance / yr
- —
Fire risk No data
- Est. fire insurance / yr
- —
Heat risk No data
- Hot days now (above threshold)
- —
- Hot days in 30 yrs
- —
Wind risk No data
- Chance of severe wind over 30 yrs
- —
Air-quality risk No data
- Unhealthy air days now
- —
- Unhealthy air days in 30 yrs
- —
Risk factors via First Street. Map © Google.
Why this score? — see what drove the C+ grade
The composite is a weighted blend of 9 inputs, each scored 0–100. Each bar is that input's sub-score; the figure is the points it added to the 100-point composite (weight × sub-score).
- Cash flow +30.0/30.0
- 1% rule +10.0/10.0
- DSCR +10.0/10.0
- Schools +4.2/10.0
- Livability +3.6/5.0
- Rent growth +2.8/5.0
- Condition / age +2.5/5.0
- ARV discount +1.9/15.0
- Appreciation +0.0/10.0
$89,900
🖨 Deal sheet 📄 Offer letter ✓ Due diligence
Listing remarks
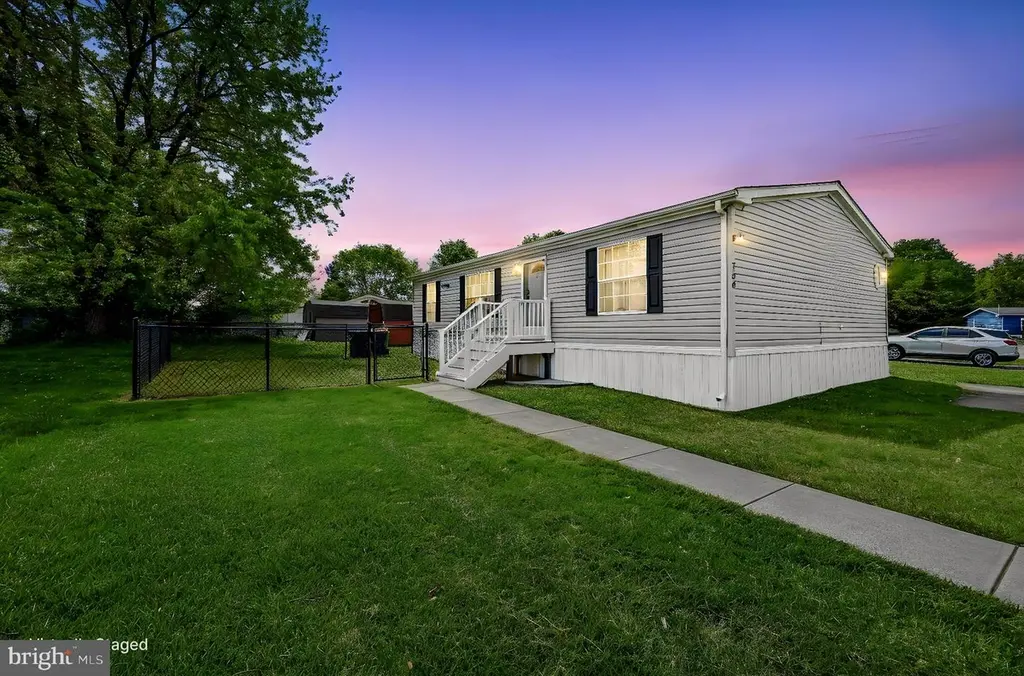
Welcome home to 738 Cleaver Farms Rd! This affordable manufactured home in the community of Village Brook is available for its new owner. This home is located in the Appoquinimink School District right outside the heart of Middletown. Featuring 3 bedrooms and 2 full baths this home offers functional space. Outside the home, there are two driveways big enough for 4 cars, vinyl siding, new skirting going around the home, updated stairs and landings with composite decking, and a brand new roof in 2026. Inside the home, there is a hardwood floored living room, a spacious kitchen, a laundry room, and main bedroom that features its own full bathroom. The bathroom has a stall shower and a large so
Key facts
- 4 parking spots
- Built 2006
- Listed 10 days
Property features AI
Finance
- Other: Above-grade finished area approximately 1,080 (estimated)
- HOA & community: Monthly land lease/HOA fee of $838; Land lease has about 1 year remaining; Property manager present
Exterior
- Parking: Driveway parking (4 spaces); Total of 4 garage and parking spaces
- Utilities: Public water; Public sewer; Electric service
- Home design: Manufactured home; Estimated year built; Land lease ownership
- Construction: Vinyl siding; Architectural shingle roof; Redman make; Approximately 27 ft by 40 ft (manufactured home dimensions)
- Exterior features: Partially fenced yard with chain link fencing; Located in Village Brook
Interior
- Bedrooms: Three bedrooms on the main level
- Flooring: Hardwood; Vinyl; Carpet
- Bathrooms: Two full bathrooms on the main level
- Heating & cooling: Forced air heating; Propane (metered) heating fuel; Central air conditioning; Electric hot water
- Interior features: Estimated living area; No basement
- Laundry & utility: Main floor laundry
Neighborhood map
What this means for you Summary
Snapshot
- This is a 3-bed/2.0-bath other listed at $90k.
Deal economics
- At list price, monthly cash flow is $704 ($8k/yr) — positive.
- The deal already cash-flows at list — no discount required.
- Meets the 1% rule at list price ($3k rent vs $90k).
- Cap rate 15.7% vs local median 3.0% in Middletown — top-decile yield for the area; either an underpriced asset or a hidden risk that comps aren't pricing in. Stress-test before assuming the spread holds.
Location & tenants
- Location reads 71/100 on livability (#17 in DE) — a middle-class / working-renter tenant base. Strengths: employment A+, housing A+, crime A-; Watch: cost of living C-, commute F.
- Appoquinimink School District (rural): math 37% / reading 52% proficiency, ranked #6 of 26 in DE (top 23%) — families likely to look elsewhere, expect single-tenant / working-renter base with shorter leases; only 18% free/reduced lunch — higher-income household profile.
- Market conditions: Rents rising (+1.1%/yr); 451 active listings in the ZIP; high-income renter base; 1,367 units permitted in New Castle County in 2024 (201 in 5+ unit buildings).
Forward outlook
- Local home prices are declining (-3.0%/yr); year-one equity from $622 of loan paydown is wiped out by about $3k of value loss. Plan a longer hold.
- New Castle County population projected at +9% by 2050 — modest demand growth; plan on rents tracking national, not racing it.
- At projected returns (-3.0% appreciation + 1.1% rent growth), your $25k cash investment doubles in ~4 years — after that, you're playing with house money.
Negotiation context
- Only 10 days on market — expect competitive offers; lowballing is unlikely to land.
Risks & watch-outs
- Watch-outs: HOA is 32% of rent.
Questions for the listing agent
- What does the HOA fee cover, when was the last increase, and are there any pending special assessments or reserve-fund shortfalls?
- Is there a deadline driving the sale (1031 exchange, divorce, estate, relocation)? That informs how much negotiation room exists.
- Schools are B-rated — typically a magnet for longer-tenancy family renters. What's the average tenant stay here, and is there a school-zone premium baked into asking?
- What's the average days-on-market for RENTAL listings here right now (not sales)? A rising rental-DOM trend means longer vacancies and softer asking-rent achievability than the comps imply.
- What's the recent tenant-quality profile in this submarket — average credit score on applications, eviction rate, late-payment / NSF rate, and stable-employment percentage? A property-management company in the area should have these aggregated.
- How much new for-sale + rental construction is in the pipeline within 1–3 miles? Heavy new supply typically softens prices + rents 12–24 months out; constrained supply supports both.
Investment metrics
- 1% rule
- 2.94% ✓
- Cap rate
- 15.69%
- Cash-on-cash
- 33.57%
- DSCR
- 2.49
- GRM
- 2.8
CMA / ARV
- ARV (median comp)
- $80,000
- List price
- $89,900
- Delta
- 12.38%
- Verdict
- OVERPRICED
- Comps
- 19 within 1.0 mi
Projected returns pro-forma
-3.0% appreciation · 1.07% rent growth · sell at horizon
- IRR
- 25.7%
- Equity multiple
- 2.02×
- Total profit
- $25,746
- Equity at exit
- $13,404
- IRR
- 31.6%
- Equity multiple
- 3.48×
- Total profit
- $62,330
- Equity at exit
- $7,773
Cash invested: $25,172 (down + closing). Projections, not guarantees.
Landlord ↔ Tenant lean methodology
- Overall (STATE)
- 70 Landlord-Friendly
- State Delaware
- 70 Landlord-Friendly · D+7
- County
- — inherits STATE
- City
- — inherits STATE
ZIP-level market 19709
- Home prices YoY
- -21.4%
- Rents YoY
- 1.1%
- Active inventory
- 451
- Price-to-rent
- 2.8×
Monthly cashflow live
- Estimated rent
- $2,648 medium interval (Pro) →
- Mortgage (P&I)
- −$471
- Tax from tax record
- −$41 /mo · $486/yr
- Insurance
- −$37
- HOA
- −$838
- Vacancy / Maint / Mgmt
- −$556
- Net cashflow
- $704
Break-even live
UW: 25.0% down · 7.5% · 30yr · 1.5% tax · 5.0% vac · 8.0% maint · 8.0% mgmt
Financing live
Cash to close
- Down payment
- $22,475
- Closing costs
- $2,697
- Reserves months
- —
- Total cash needed
- —
Loan-product check · same deal, 3 products live
Conventional
25% down · 7.5% · 30yr
- Down + closing
- —
- Monthly P&I
- —
- Monthly cashflow
- —
- DSCR
- —
- Eligible?
- —
Personal DTI + credit; lowest rate.
DSCR
20% down · 8.5% · 30yr
- Down + closing
- —
- Monthly P&I
- —
- Monthly cashflow
- —
- DSCR
- —
- Eligible?
- —
No personal income docs; deal must DSCR.
Hard money
10% down · 12.0% · 12mo
- Down + closing
- —
- Monthly P&I
- —
- Monthly cashflow
- —
- DSCR
- —
- Eligible?
- —
Short-term bridge; refi at stabilization.
HOA detail
- Monthly dues
- $838 · $10,056/yr
Listing history 3 events
-
2026-05-17status Pending 925-char remark
-
2026-05-07$89,900 Active 925-char remark
-
2026-05-04historical $89,900 925-char remark
ⓘ Source: listings_history table (triggers on properties + properties_extension) + one-shot
backfill from property_details.listing_events for pre-trigger history.
Tax reassessment forecast DE · Partial reset (capped growth)
- Current annual tax
- $486 · $41/mo
- Projected year-2 tax
- $504 · $42/mo
- Expected delta
- +$18/yr (+$1/mo · 3.6%)
ⓘ Screening estimate from a state-policy table — verify with the county assessor before closing.
Nearby sold comps map
Loading sold comps map…
Walkable amenities ~0.75 mi
Loading nearby amenities…
Taxation est. · year 1
- Rental income
- $31,771
- − Mortgage interest
- −$5,036
- − Property taxes
- −$486
- − Insurance
- −$450
- − Repairs & maintenance
- −$2,542
- − Management
- −$2,542
- − HOA
- −$10,056
- − Depreciation
- −$2,615
- Taxable income
- $8,045
- Est. tax owed @ 24.0%
- −$1,931
- After-tax cash flow
- $6,519/yr
For passive investors: Depreciation is non-cash, so a rental often shows a tax loss while cash-flowing — sheltering income. Rental losses are passive: they offset passive income freely, and up to $25,000/yr can offset ordinary (W-2) income if you actively participate and your MAGI is under $100k (phasing out to $0 by $150k); unused losses carry forward. On sale, claimed depreciation is recaptured at up to 25%, and gains may owe capital-gains tax (a 1031 exchange can defer both). Figures are a year-1 estimate at your 24.0% rate — not tax advice; consult a CPA.
Schools (NCES district)
- District
- Appoquinimink School District
- NCES district ID
- 1000080
- Math proficiency
- 37% ▼ -13.00%
- Reading proficiency
- 52% ▼ -13.00%
- Median HH income
- $93,397
- Composite
- 42.32/100
- National rank
- #3256
- State rank
- #6 of 26 in DE
Livability — Middletown
- Score
- 71/100
- State rank
- #17
- US rank
- #6446
Category grades
Schools grade is shown separately in the Schools card above.
Census & demographics
- Census place
- Middletown, DE
- County
- New Castle County · 483,412 people
- City population
- 53,234
- Metro
- Philadelphia-Camden-Wilmington, PA-NJ-DE-MD
- Population (ZIP)
- 53,234
- Household income
- $132,956
- Rent vs Own
- Severe rent burden
- 268.0
Population outlook (New Castle County) Hauer SSP2
- Today (2025)
- 594,686 people
- By 2030
- 609,164 · +2.4%
- By 2040
- 632,154 · +6.3%
- By 2050
- 649,068 · +9.1%
- By 2075
- 687,771 · +15.7%
- By 2100
- 694,961 · +16.9%
Race, ethnicity, and origin ACS 2023
- Neighborhood character
- Diverse neighborhood (Simpson 0.59)
- Race & ethnicity
- White 59% Black 23% Asian 7% Two or more races 6% Hispanic / Latino 6%
- Hispanic origin (detail)
- Mexican 1% Puerto Rican 3%
- Common ancestry
- Romanian 5% Slovak 1% Iranian 1%
- Foreign-born
- 11% · Canada, China
- Languages at home
- 87% English-only · Other Indo-European 4% Spanish 3% French/Haitian/Cajun 1%
Political lean MEDSL · New Castle
- 2024 margin
- Solid D (+32.6) · D 65.5% · R 32.9% · Other 1.6%
- 2008→2024 swing
- -8.1pp toward R · 2008: 40.6pp · 2024: 32.6pp
- All cycles
- 2024: D+32.6 2020: D+37.1 2016: D+29.6 2012: D+34.1 2008: D+40.6
Not yet ingested
- Civics
- —
Market trends
- HPI YoY
- ▼ -86.40%
- Current HPI
- 317.1386
- Rent YoY
- ▲ 1.07%
- Metro
- Philadelphia-Camden-Wilmington, PA-NJ-DE-MD
- State GDP YoY
- —
- F500 in state
- 0
Price history
-3.2% since first listed4 events — show timeline
- 2026-05-28 Sold (MLS) $87,000 BRIGHT MLS
- 2026-05-17 Pending — BRIGHT MLS
- 2026-05-07 Listed $89,900 BRIGHT MLS
- 2026-05-04 Coming Soon $89,900 BRIGHT MLS
Property tax history
+3.5%/yrLatest (2024): $486 · +16.9% YoY. Source: county tax records.
Cash-flow waterfall
monthlySold comps — $/sqft
last 12 mo · ≤1 miLoading sold comps…