5026 Fitzwater Dr · Spring, TX
Flood risk 1/10 · Minimal
- FEMA flood zone
- X (unshaded)
- Chance of flooding over 30 yrs
- 0.0%
- Est. flood insurance / yr
- $507 – $1,088
Fire risk 2/10 · Minimal
- Est. fire insurance / yr
- $1,222 – $2,270
Heat risk 9/10 · Severe
- Hot days now (above 110°F)
- 7 days/yr
- Hot days in 30 yrs
- 25 days/yr
Wind risk 9/10 · Severe
- Chance of severe wind over 30 yrs
- 99.0%
Air-quality risk 3/10 · Minor
- Unhealthy air days now
- 3 days/yr
- Unhealthy air days in 30 yrs
- 3 days/yr
Risk factors via First Street. Map © Google.
Why this score? — see what drove the D- grade
The composite is a weighted blend of 9 inputs, each scored 0–100. Each bar is that input's sub-score; the figure is the points it added to the 100-point composite (weight × sub-score).
- Cash flow +11.4/30.0
- ARV discount +9.9/15.0
- 1% rule +5.0/10.0
- DSCR +3.3/10.0
- Livability +3.3/5.0
- Condition / age +2.5/5.0
- Rent growth +2.4/5.0
- Schools +2.0/10.0
- Appreciation +0.0/10.0
$229,000
🖨 Deal sheet 📄 Offer letter ✓ Due diligence
Listing remarks
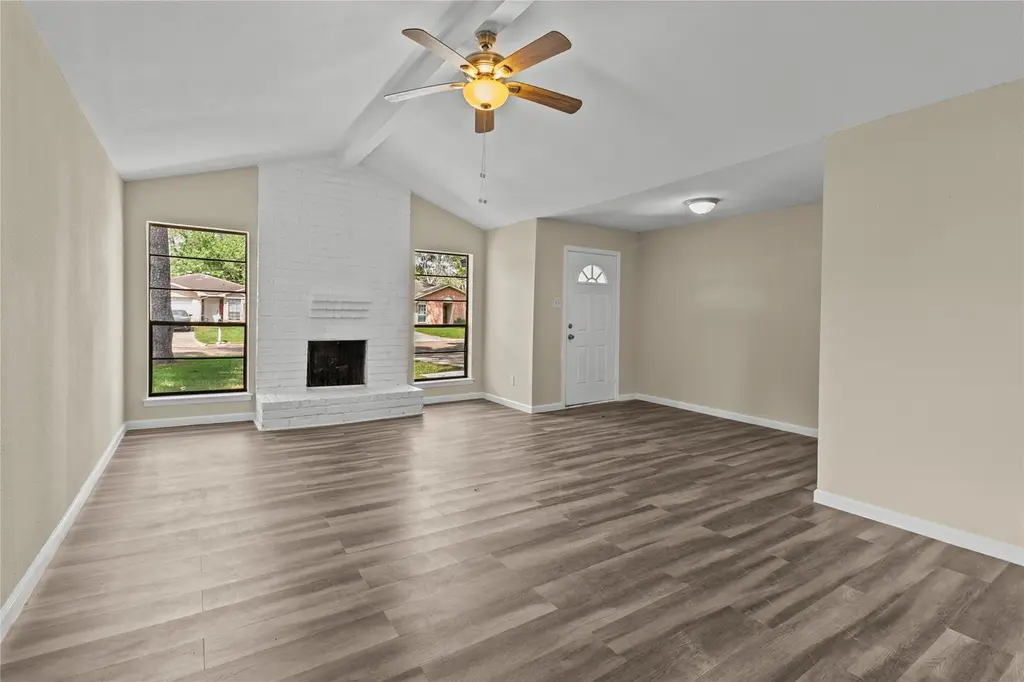
Experience this beautiful property in Fairfax Village near Treaschwig Rd & Cypresswood. Just minutes away from the scenic Spring Creek Greenway and Mercer Botanic Gardens. This home boasts recent interior and exterior paint updates, creating a fresh and modern feel. The open living space features high ceilings, ideal for both relaxing and entertaining. Enjoy the added benefit of vinyl flooring, perfect for those seeking a hypoallergenic living environment.
Key facts
- Vinyl flooring
- High ceilings
- 6,050 sq ft lot
Tags
Property features AI
Finance
- Financial info: Lease considered
- HOA & community: HOA: Fairfax Village; HOA fee $450 annually; Community curbs
Exterior
- Parking: Attached 2-car garage; Driveway
- Security: Smoke detectors
- Utilities: Public water; Public sewer
- Home design: Residential property; Built in 1980; Slab foundation; Composition roof; Concrete road access
- Construction: Brick and cement siding construction
- Exterior features: Back yard fencing; Fence; Subdivision lot
Interior
- Kitchen: Dishwasher; Electric oven; Electric range; Free-standing range; Built-in microwave; Garbage disposal; Oven
- Bedrooms: Primary bedroom — First floor, about 16x12; Bedroom — First floor, about 12x12; Bedroom — First floor, about 12x11
- Flooring: Plank flooring; Vinyl flooring
- Bathrooms: Two full bathrooms; Primary bathroom — First floor, about 8x5
- Heating & cooling: Central heating (electric); Central air conditioning (electric)
- Interior features: Granite counters; High ceilings; Kitchen and family room combined; Pantry; Tub with shower; Ceiling fans; Kitchen and dining combined; Open living/dining area; Programmable thermostat; Gas fireplace (one)
- Laundry & utility: Washer hookup; Electric dryer hookup; Utility room (other level)
Neighborhood map
What this means for you Summary
Snapshot
- This is a 3-bed/2.0-bath single-family listed at $229k.
Deal economics
- At list price, monthly cash flow is $-80 ($-958/yr) — negative.
- To cash-flow at today's rent, offer at most $215k (6.2% below list).
- Meets the 1% rule at list price ($2k rent vs $229k).
- Recommended offer: $215k (6.2% below list) — sets the bar for cash-flow.
- Cap rate 5.9% vs local median 4.5% in Spring — top-decile yield for the area; either an underpriced asset or a hidden risk that comps aren't pricing in. Stress-test before assuming the spread holds.
Location & tenants
- Location reads 66/100 on livability (#635 in TX) — a middle-class / working-renter tenant base. Strengths: cost of living A+, housing A+, employment B; Watch: crime D, amenities F, commute F.
- Spring ISD (suburban): math 19% / reading 26% proficiency, ranked #730 of 826 in TX (top 88%) — low school quality limits family demand, transient renter base, plan for 1-2y turnover; 66% free/reduced lunch — lower-income household profile, screen leases tightly.
- Zoned schools: Mildred Jenkins El (math 17% / reading 30%, grade F, #3,247 of 4,322 statewide, top 76%, 623 students, 90% FRL); Dueitt Middle (math 12% / reading 23%, grade F, #1,507 of 1,662 statewide, top 91%, 773 students, 84% FRL); Spring H S (math 12% / reading 21%, grade F, #1,497 of 1,632 statewide, top 92%, 2,760 students, 72% FRL) — zoned schools average 82% FRL vs 66% district-wide (16 pts higher); higher-poverty schools than district average — tighter screening recommended.
- Market conditions: Rents soft (-0.3%/yr); 595 active listings in the ZIP; solid renter incomes; 29,883 units permitted in Harris County in 2024 (8,621 in 5+ unit buildings).
- This rent runs 31% of the median local income ($89k/yr) — at the standard rent-burdened threshold; future hikes will face affordability resistance.
Forward outlook
- Local home prices are declining (-3.0%/yr); year-one equity from $2k of loan paydown is wiped out by about $7k of value loss. Plan a longer hold.
- Harris County population projected at +47% by 2050 — long-run rental-demand tailwind backs the buy-and-hold thesis.
Negotiation context
- It's been on market 15 days — a 2% lower offer ($226k) is reasonable based on typical stale-listing flexibility.
- 11 sale attempts since 22y ago; this cycle's ask is 9857% above the opening price — seller raised mid-cycle; expect resistance to lowballs.
Risks & watch-outs
- Watch-outs: property tax is 2.9% of price.
- Climate carrying-cost: severe wind risk, 99% chance of damaging wind over 30y; extreme-heat days projected 7→25/yr by 2055 (HVAC capex compounding) — expect insurance premiums to compound above CPI over the hold.
Questions for the listing agent
- What do current leases actually rent for vs. the listed asking? Can we see a recent rent roll and the last 12 months of T-12 income?
- Property tax is high relative to price — has the assessment been appealed recently, and will the sale trigger a re-assessment?
- What does the HOA fee cover, when was the last increase, and are there any pending special assessments or reserve-fund shortfalls?
- Is there a deadline driving the sale (1031 exchange, divorce, estate, relocation)? That informs how much negotiation room exists.
- Crime grade is D in this area — have there been break-ins, vandalism, or insurance claims at this property in the last 3 years? What carrier currently insures it and at what premium?
- The area grade is low — what's the realistic commute time and amenity access for the typical tenant pool here? Any planned neighborhood developments (good or bad) we should know about?
- What's the average days-on-market for RENTAL listings here right now (not sales)? A rising rental-DOM trend means longer vacancies and softer asking-rent achievability than the comps imply.
- What's the recent tenant-quality profile in this submarket — average credit score on applications, eviction rate, late-payment / NSF rate, and stable-employment percentage? A property-management company in the area should have these aggregated.
- How much new for-sale + rental construction is in the pipeline within 1–3 miles? Heavy new supply typically softens prices + rents 12–24 months out; constrained supply supports both.
Investment metrics
- 1% rule
- 1.00% ✓
- Cap rate
- 5.87%
- Cash-on-cash
- -1.49%
- DSCR
- 0.93
- GRM
- 8.3
CMA / ARV
- ARV (median comp)
- $241,854
- List price
- $229,000
- Delta
- -2.83%
- Verdict
- FAIR
- Comps
- 20 within 2.0 mi
Show comp detail 7 sales within ~0.75 mi
| Address | Dist | Beds/Ba | Sqft | Sold | Price | $/sf | Match |
|---|---|---|---|---|---|---|---|
| 23114 Goodfellow Dr | 0.05mi | 3/2.0 | 1,541 (-2%) | 7mo | $210,000 | $136 | 88 |
| 23142 Calico Corners Ln | 0.16mi | 3/2.0 | 1,599 (+1%) | 19mo | $179,000 | $112 | 75 |
| 5030 Monteith Dr | 0.06mi | 3/2.0 | 1,653 (+5%) | 22mo | $180,000 | $109 | 71 |
| 23202 Goodfellow Dr | 0.05mi | 4/2.5 (+1) | 1,798 (+14%) | 14mo | $250,000 | $139 | 56 |
| 23110 Ludgate Dr | 0.52mi | 3/2.0 | 1,474 (-7%) | 13mo | $220,000 | $149 | 54 |
| 4822 S Fairfax Village Cir | 0.43mi | 4/2.5 (+1) | 1,809 (+14%) | 2mo | $220,000 | $122 | 47 |
| 4555 Algernon Dr | 0.51mi | 3/2.0 | 1,360 (-14%) | 16mo | $205,000 | $151 | 39 |
Match score weights: distance 35% · size 25% · config 20% · recency 20%. Top-matched comps best support the ARV.
Projected returns pro-forma
-3.0% appreciation · 0.0% rent growth · sell at horizon
- IRR
- -22.8%
- Equity multiple
- 0.24×
- Total profit
- $-48,689
- Equity at exit
- $34,145
- IRR
- -30.7%
- Equity multiple
- -0.15×
- Total profit
- $-74,001
- Equity at exit
- $19,800
Cash invested: $64,120 (down + closing). Projections, not guarantees.
Landlord ↔ Tenant lean methodology
- Overall (STATE)
- 87 Strongly Landlord-Friendly
- State Texas
- 87 Strongly Landlord-Friendly · R+5
- County
- — inherits STATE
- City
- — inherits STATE
ZIP-level market 77373
- Rents YoY
- -0.3%
- Active inventory
- 595
- Price-to-rent
- 8.3×
Monthly cashflow live
- Estimated rent
- $2,293 medium interval (Pro) →
- Mortgage (P&I)
- −$1,201
- Tax from tax record
- −$557 /mo · $6,681/yr
- Insurance
- −$95
- HOA
- −$38
- Vacancy / Maint / Mgmt
- −$481
- Net cashflow
- $-80
Break-even live
UW: 25.0% down · 7.5% · 30yr · 1.5% tax · 5.0% vac · 8.0% maint · 8.0% mgmt
Financing live
Cash to close
- Down payment
- $57,250
- Closing costs
- $6,870
- Reserves months
- —
- Total cash needed
- —
Loan-product check · same deal, 3 products live
Conventional
25% down · 7.5% · 30yr
- Down + closing
- —
- Monthly P&I
- —
- Monthly cashflow
- —
- DSCR
- —
- Eligible?
- —
Personal DTI + credit; lowest rate.
DSCR
20% down · 8.5% · 30yr
- Down + closing
- —
- Monthly P&I
- —
- Monthly cashflow
- —
- DSCR
- —
- Eligible?
- —
No personal income docs; deal must DSCR.
Hard money
10% down · 12.0% · 12mo
- Down + closing
- —
- Monthly P&I
- —
- Monthly cashflow
- —
- DSCR
- —
- Eligible?
- —
Short-term bridge; refi at stabilization.
HOA detail
- Monthly dues
- $38 · $456/yr
Listing history 40 events
-
2026-06-18days on market $229,000 Active 15 DOM
-
2026-06-17days on market $229,000 Active 14 DOM
-
2026-06-16days on market $229,000 Active 13 DOM
-
2026-06-15days on market $229,000 Active 12 DOM
-
2026-06-13days on market $229,000 Active 10 DOM
-
2026-06-13days on market $229,000 Active 9 DOM
-
2026-06-09days on market $229,000 Active 6 DOM
-
2026-06-08days on market $229,000 Active 5 DOM
-
2026-06-07days on market $229,000 Active 4 DOM
-
2026-06-04pricedays on market $229,000 Active 1 DOM
-
2026-06-03days on market $235,000 Active 60 DOM
-
2026-06-02days on market $235,000 Active 59 DOM
-
2026-06-01days on market $235,000 Active 58 DOM
-
2026-05-31days on market $235,000 Active 57 DOM
-
2026-05-12price $1,900
-
2026-05-11price $239,000 464-char remark
-
2026-04-04$2,000
-
2026-04-04$247,000 Active 464-char remark
-
2026-02-13historical
-
2026-01-21$235,000 Active
-
2024-09-17historical
-
2024-09-02status Active
-
2024-08-31historical
-
2024-06-17price $227,900
-
2024-04-16price $234,900
-
2024-03-21price $239,000
-
2024-03-04$246,000 Active
-
2022-05-10soldstatus
-
2022-05-06soldstatus Sold
-
2022-04-27status Pending
-
2022-03-23status Pending, Continue to Show
-
2022-03-04price $1,980
-
2022-03-03status Active
-
2022-02-28status Option Pending
-
2022-02-04$219,000 Active
-
2016-10-28soldstatus
-
2005-10-05historical
-
2005-08-29$91,900
-
2004-07-12historical
-
2004-06-16$89,900
ⓘ Source: listings_history table (triggers on properties + properties_extension) + one-shot
backfill from property_details.listing_events for pre-trigger history.
Tax reassessment forecast TX · Resets to sale price
- Current annual tax
- $6,681 · $557/mo
- Projected year-2 tax
- $6,681 · $557/mo
- Expected delta
- $0/yr ($0/mo · 0.0%)
ⓘ Screening estimate from a state-policy table — verify with the county assessor before closing.
Climate risk First Street
- Flood 1/10 Low FEMA zone X (unshaded) · 0% chance over 30 yrs
- Wildfire 2/10 Low
- Heat 9/10 Extreme 7 d/yr ≥110°F today · 25 d/yr by 30 yrs out
- Wind 9/10 Extreme 99% chance of damaging wind over 30 yrs
- Air quality 3/10 Moderate 3 unhealthy d/yr today · 3 by 30 yrs out
Nearby sold comps map
Loading sold comps map…
Walkable amenities ~0.75 mi
Loading nearby amenities…
Taxation est. · year 1
- Rental income
- $27,511
- − Mortgage interest
- −$12,828
- − Property taxes
- −$6,681
- − Insurance
- −$1,145
- − Repairs & maintenance
- −$2,201
- − Management
- −$2,201
- − HOA
- −$456
- − Depreciation
- −$6,662
- Taxable loss
- −$4,661
- Est. tax savings @ 24.0%
- +$1,119
- After-tax cash flow
- $160/yr
For passive investors: Depreciation is non-cash, so a rental often shows a tax loss while cash-flowing — sheltering income. Rental losses are passive: they offset passive income freely, and up to $25,000/yr can offset ordinary (W-2) income if you actively participate and your MAGI is under $100k (phasing out to $0 by $150k); unused losses carry forward. On sale, claimed depreciation is recaptured at up to 25%, and gains may owe capital-gains tax (a 1031 exchange can defer both). Figures are a year-1 estimate at your 24.0% rate — not tax advice; consult a CPA.
Schools (NCES district)
- District
- Spring ISD
- NCES district ID
- 4841220
- Math proficiency
- 19% ▼ -13.00%
- Reading proficiency
- 26% ▼ -6.00%
- Median HH income
- $51,584
- Composite
- 20.12/100
- National rank
- #8643
- State rank
- #730 of 826 in TX
Livability — Spring
- Score
- 66/100
- State rank
- #635
- US rank
- #12101
Category grades
Schools grade is shown separately in the Schools card above.
Census & demographics
- Census place
- Spring, TX
- County
- Harris County · 4,702,590 people
- City population
- 430,529
- Metro
- Houston-The Woodlands-Sugar Land, TX
- Population (ZIP)
- 69,739
- Household income
- $88,617
- Rent vs Own
- Severe rent burden
- 1050.0
Population outlook (Harris County) Hauer SSP2
- Today (2025)
- 5,571,493 people
- By 2030
- 6,089,821 · +9.3%
- By 2040
- 7,142,806 · +28.2%
- By 2050
- 8,185,864 · +46.9%
- By 2075
- 10,574,329 · +89.8%
- By 2100
- 12,109,958 · +117.4%
Race, ethnicity, and origin ACS 2023
- Neighborhood character
- Diverse neighborhood (Simpson 0.69)
- Race & ethnicity
- Hispanic / Latino 40% White 30% Black 23% Two or more races 22% Asian 3%
- Hispanic origin (detail)
- Mexican 27% Puerto Rican 2% Cuban 2% Dominican 2%
- Common ancestry
- Lithuanian 2% Italian 1% Slovak 1%
- Foreign-born
- 17% · Canada, Jamaica, Vietnam
- Languages at home
- 64% English-only · Spanish 32% Vietnamese 1% Other Indo-European 1%
Political lean MEDSL · Harris
- 2024 margin
- Lean D (+5.5) · D 52.0% · R 46.4% · Other 1.6%
- 2008→2024 swing
- +3.9pp toward D · 2008: 1.6pp · 2024: 5.5pp
- All cycles
- 2024: D+5.5 2020: D+13.3 2016: D+12.4 2012: D+0.1 2008: D+1.6
Not yet ingested
- Civics
- —
Market trends
- HPI YoY
- ▼ -142.98%
- Current HPI
- 251.7231
- Rent YoY
- ▼ -0.30%
- Metro
- Houston-The Woodlands-Sugar Land, TX
- State GDP YoY
- ▲ 3.95%
- F500 in state
- 110
Industry mix (Fortune 500 HQ in TX)
| Industry | F500 HQs | Revenue |
|---|---|---|
| Energy | 16 | $1,198B |
|
||
| Technology | 5 | $198B |
|
||
| Engineering / Construction | 4 | $72B |
|
||
| Energy Services | 3 | $60B |
|
||
| Utilities | 3 | $41B |
|
||
| Healthcare | 2 | $330B |
|
||
Price history
-97.4% since first listed31 events — show timeline
- 2026-06-05 Listed for Rent $2,300 HARMLS
- 2026-06-04 Rental Removed $1,900 HARMLS
- 2026-06-03 Listed $229,000 HARMLS
- 2026-06-03 Listing Removed — HARMLS
- 2026-05-28 Price Changed $235,000 HARMLS
- 2026-05-12 Price Changed $1,900 HARMLS
- 2026-05-11 Price Changed $239,000 HARMLS
- 2026-04-04 Listed for Rent $2,000 HARMLS
- 2026-04-04 Listed $247,000 HARMLS
- 2026-02-13 Listing Removed — HARMLS
- 2026-01-21 Listed $235,000 HARMLS
- 2024-09-17 Listing Removed — HARMLS
- 2024-09-02 Relisted — HARMLS
- 2024-08-31 Listing Removed — HARMLS
- 2024-06-17 Price Changed $227,900 HARMLS
- 2024-04-16 Price Changed $234,900 HARMLS
- 2024-03-21 Price Changed $239,000 HARMLS
- 2024-03-04 Listed $246,000 HARMLS
- 2022-05-10 Sold (Public Records) — Public Records
- 2022-05-06 Sold (MLS) — HARMLS
- 2022-04-27 Pending — HARMLS
- 2022-03-23 Pending — HARMLS
- 2022-03-04 Price Changed $1,980 RENT.
- 2022-03-03 Relisted — HARMLS
- 2022-02-28 Pending — HARMLS
- 2022-02-04 Listed $219,000 HARMLS
- 2016-10-28 Sold (Public Records) — Public Records
- 2005-10-05 Listing Removed — HARMLS
- 2005-08-29 Listed $91,900 HARMLS
- 2004-07-12 Listing Removed — HARMLS
- 2004-06-16 Listed $89,900 HARMLS
Property tax history
+6.6%/yrLatest (2025): $6,681 · -3.5% YoY. Source: county tax records.
Cash-flow waterfall
monthlySold comps — $/sqft
last 12 mo · ≤1 miLoading sold comps…