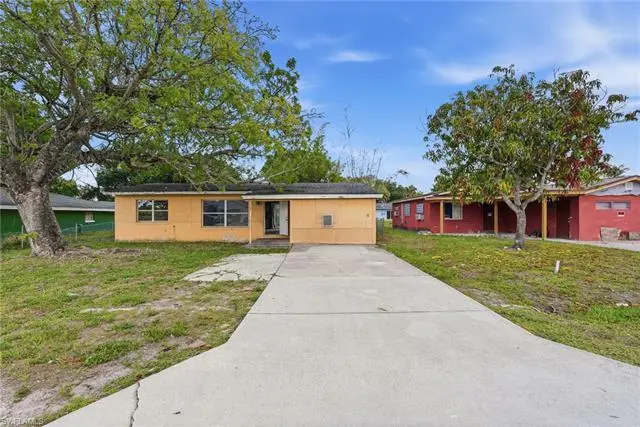
1507 Bert Dr · Fort Myers, FL
Flood risk 2/10 · Minimal
- FEMA flood zone
- X (unshaded)
- Chance of flooding over 30 yrs
- 0.05%
- Est. flood insurance / yr
- $507 – $1,088
Fire risk 3/10 · Minor
- Est. fire insurance / yr
- $947 – $1,759
Heat risk 10/10 · Severe
- Hot days now (above 107°F)
- 7 days/yr
- Hot days in 30 yrs
- 30 days/yr
Wind risk 10/10 · Severe
- Chance of severe wind over 30 yrs
- 99.0%
Air-quality risk 2/10 · Minimal
- Unhealthy air days now
- 1 days/yr
- Unhealthy air days in 30 yrs
- 1 days/yr
Risk factors via First Street. Map © Google.
Why this score? — see what drove the B- grade
The composite is a weighted blend of 9 inputs, each scored 0–100. Each bar is that input's sub-score; the figure is the points it added to the 100-point composite (weight × sub-score).
- Cash flow +30.0/30.0
- 1% rule +10.0/10.0
- DSCR +10.0/10.0
- ARV discount +5.0/15.0
- Livability +4.3/5.0
- Schools +4.1/10.0
- Condition / age +2.5/5.0
- Rent growth +1.4/5.0
- Appreciation +0.0/10.0
$99,000
🖨 Deal sheet (PDF) 📄 Offer letter ✓ Due diligence
Listing remarks MLS
This home was completely remodled 2 years ago with brand new kitchen, baths, lots of tile, replumbed, updated electric, new central hvac, new windows and more. House has been rented for $775. Vacant now and easy to rent. Great investment or affordable home. Owners selling to disolve partnership and have priced it for a quick sale. Hurry this one won't last.
Key facts
- 7,318 sq ft lot
- Garage
- Built 1962
Property features AI
Finance
- Other: Property type: Residential; Subdivision/Development: Bellevue Addition; Lot dimensions approximately 61 x 120 (developer brochure); Lot acres: 0.168; Zoning: RS-7; Single unit on property; single-floor building
- HOA & community: No HOA maintenance or amenities; Non-gated community
Exterior
- Utilities: Water assessment paid; Septic sewer
- Home design: Single family residence; 1 story (ranch); Rear exposure facing west
- Construction: Built in 1962
- Exterior features: Shingle roof; Windows: see remarks; Regular lot
Interior
- Bedrooms: 3 bedrooms
- Flooring: Vinyl flooring
- Bathrooms: 2 full bathrooms; Master bathroom with shower only
- Heating & cooling: Central electric heat; Central electric cooling
- Interior features: Unfurnished; See remarks for additional interior details
Neighborhood map
What this means for you Summary
Snapshot
- This is a 3-bed/1.0-bath single-family listed at $99k.
Deal economics
- At list price, monthly cash flow is $511 ($6k/yr) — positive.
- The deal already cash-flows at list — no discount required.
- Meets the 1% rule at list price ($2k rent vs $99k).
- Cap rate 12.5% vs local median 3.0% in Fort Myers — top-decile yield for the area; either an underpriced asset or a hidden risk that comps aren't pricing in. Stress-test before assuming the spread holds.
Location & tenants
- Location reads 86/100 on livability (#14 in FL, #383 nationally) — a professional / high-income tenant draw. Strengths: amenities A+, commute A+, housing A+.
- Lee (suburban): math 47% / reading 50% proficiency, ranked #42 of 73 in FL (top 58%) — families likely to look elsewhere, expect single-tenant / working-renter base with shorter leases.
- Market conditions: Rents falling (-4.3%/yr); 267 active listings in the ZIP; 40 comparable units currently listed for rent nearby; rentals at typical pace (median 22d on market — plan ~3-4 weeks tenant-placement turnaround); 15,411 units permitted in Lee County in 2024 (4,686 in 5+ unit buildings).
- This rent runs 37% of the median local income ($53k/yr) — at the standard rent-burdened threshold; future hikes will face affordability resistance.
Forward outlook
- Local home prices are declining (-3.0%/yr); year-one equity from $684 of loan paydown is wiped out by about $3k of value loss. Plan a longer hold.
- Lee County population projected at +44% by 2050 — long-run rental-demand tailwind backs the buy-and-hold thesis.
- At projected returns (-3.0% appreciation + 0.0% rent growth), your $28k cash investment doubles in ~7 years — after that, you're playing with house money.
Negotiation context
- Only 12 days on market — expect competitive offers; lowballing is unlikely to land.
- 3 sale attempts since 12y ago with the ask held roughly flat each time — persistent listings suggest the price (not the market) is what's stuck; bring a comps-based counter.
Risks & watch-outs
- Watch-outs: property tax is 2.6% of price.
- Climate carrying-cost: severe wind risk, 99% chance of damaging wind over 30y; extreme-heat days projected 7→30/yr by 2055 (HVAC capex compounding) — expect insurance premiums to compound above CPI over the hold.
Questions for the listing agent
- Built in 1962 — when were the roof, HVAC, electrical panel, plumbing, and water heater last replaced?
- Property tax is high relative to price — has the assessment been appealed recently, and will the sale trigger a re-assessment?
- Is there a deadline driving the sale (1031 exchange, divorce, estate, relocation)? That informs how much negotiation room exists.
- What's the average days-on-market for RENTAL listings here right now (not sales)? A rising rental-DOM trend means longer vacancies and softer asking-rent achievability than the comps imply.
- What's the recent tenant-quality profile in this submarket — average credit score on applications, eviction rate, late-payment / NSF rate, and stable-employment percentage? A property-management company in the area should have these aggregated.
- How much new for-sale + rental construction is in the pipeline within 1–3 miles? Heavy new supply typically softens prices + rents 12–24 months out; constrained supply supports both.
Investment metrics
- 1% rule
- 1.65% ✓
- Cap rate
- 12.48%
- Cash-on-cash
- 22.11%
- DSCR
- 1.98
- GRM
- 5.1
CMA / ARV
- ARV (on-the-fly)
- $93,852
- Comps found
- 3
Show comp detail 3 sales within ~0.75 mi
| Address | Dist | Beds/Ba | Sqft | Sold | Price | $/sf | Match |
|---|---|---|---|---|---|---|---|
| 1366 Brookhill Dr | 0.29mi | 3/2.0 | 1,092 (-8%) | 10mo | $65,000 | $60 | 60 |
| 3730 Belmont St | 0.52mi | 3/1.0 | 1,152 (-3%) | 23mo | $185,000 | $161 | 52 |
| 3803 Pearl St | 0.52mi | 2/1.0 (-1) | 1,054 (-11%) | 10mo | $83,000 | $79 | 44 |
Match score weights: distance 35% · size 25% · config 20% · recency 20%. Top-matched comps best support the ARV.
Projected returns pro-forma
-3.0% appreciation · 0.0% rent growth · sell at horizon
- IRR
- 11.2%
- Equity multiple
- 1.43×
- Total profit
- $11,789
- Equity at exit
- $14,761
- IRR
- 17.4%
- Equity multiple
- 2.23×
- Total profit
- $34,007
- Equity at exit
- $8,560
Cash invested: $27,720 (down + closing). Projections, not guarantees.
Landlord ↔ Tenant lean methodology
- Overall (STATE)
- 87 Strongly Landlord-Friendly
- State Florida
- 87 Strongly Landlord-Friendly · R+3
- County
- — inherits STATE
- City
- — inherits STATE
ZIP-level market 33916
- Home prices YoY
- -28.2%
- Rents YoY
- -4.3%
- Active inventory
- 267
- Price-to-rent
- 5.1×
Monthly cashflow live
- Estimated rent
- $1,632 high interval (Pro) →
- Mortgage (P&I)
- −$519
- Tax from tax record
- −$218 /mo · $2,617/yr
- Insurance
- −$41
- HOA
- −$0
- Vacancy / Maint / Mgmt
- −$343
- Net cashflow
- $511
Break-even live
Sensitivity live
| Price | -10% $567 | -5% $539 | +0% $511 | +5% $483 | +10% $455 |
|---|---|---|---|---|---|
| Rent | -10% $382 | -5% $446 | +0% $511 | +5% $575 | +10% $640 |
| Rate | -1.0pp $561 | -0.5pp $536 | base $511 | +0.5pp $485 | +1.0pp $459 |
UW: 25.0% down · 7.5% · 30yr · 1.5% tax · 5.0% vac · 8.0% maint · 8.0% mgmt
Financing live
Cash to close
- Down payment
- $24,750
- Closing costs
- $2,970
- Reserves months
- —
- Total cash needed
- —
Loan-product check · same deal, 3 products live
Conventional
25% down · 7.5% · 30yr
- Down + closing
- —
- Monthly P&I
- —
- Monthly cashflow
- —
- DSCR
- —
- Eligible?
- —
Personal DTI + credit; lowest rate.
DSCR
20% down · 8.5% · 30yr
- Down + closing
- —
- Monthly P&I
- —
- Monthly cashflow
- —
- DSCR
- —
- Eligible?
- —
No personal income docs; deal must DSCR.
Hard money
10% down · 12.0% · 12mo
- Down + closing
- —
- Monthly P&I
- —
- Monthly cashflow
- —
- DSCR
- —
- Eligible?
- —
Short-term bridge; refi at stabilization.
Rent comps 40 comps
| Address | Beds | Baths | Sqft | Rent | $/sqft | DOM | Units | Dist |
|---|---|---|---|---|---|---|---|---|
| 216 Maria St Fort Myers, FL | 3.0 | 1.0 | 864 | $1,600 | $1.85 | 24d | 1 | 0.24mi |
| 221 Maria St Unit 225 Fort Myers, FL | 2.0 | 1.0 | 720 | $1,095 | $1.52 | 24d | 1 | 0.28mi |
| 227 Maria St Fort Myers, FL | 2.0 | 1.0 | 720 | $1,095 | $1.52 | 24d | 1 | 0.29mi |
| 1759 Aquarius Ct Fort Myers, FL | 2.0 | 1.0 | 800 | $1,400 | $1.75 | 15d | 1 | 0.33mi |
| 1759 Aquarius Ct Fort Myers, FL | 2.0 | 1.0 | 800 | $1,400 | $1.75 | 4d | 1 | 0.33mi |
| 3323 Michigan Ave Fort Myers, FL | 3.0 | 2.0 | 1029 | $1,600 | $1.55 | 22d | 1 | 0.38mi |
| 1775 Glenway Ct Fort Myers, FL | 4.0 | 2.0 | 1367 | $2,600 | $1.90 | 24d | 1 | 0.42mi |
| 1150 Polk St Fort Myers, FL | 2.0 | 1.0 | 819 | $2,000 | $2.44 | 24d | 1 | 0.46mi |
| 3616 Pearl St Unit 4 Fort Myers, FL | 2.0 | 1.5 | 980 | $925 | $0.94 | 22d | 1 | 0.46mi |
| 3666 Pearl St Fort Myers, FL | 2.0 | 1.0 | 1100 | $1,400 | $1.27 | 24d | 1 | 0.46mi |
| 3616 Pearl St Unit 1 Fort Myers, FL | 3.0 | 2.0 | 1200 | $1,175 | $0.98 | 4d | 1 | 0.46mi |
| 3771 Belmont St Apt A Fort Myers, FL | 2.0 | 1.0 | 800 | $1,195 | $1.49 | 24d | 1 | 0.56mi |
| 3758 Lora St Unit 4 Fort Myers, FL | 2.0 | 1.0 | 800 | $1,025 | $1.28 | 22d | 1 | 0.58mi |
| 3920 Lora St Fort Myers, FL | 2.0 | 1.0 | 800 | $1,150 | $1.44 | 12d | 1 | 0.65mi |
| 322 Louise Ave Fort Myers, FL | 2.0 | 1.0 | 765 | $1,100 | $1.44 | 20d | 1 | 0.65mi |
| 322 Louise Ave Fort Myers, FL | 2.0 | 1.0 | 765 | $1,100 | $1.44 | 4d | 1 | 0.65mi |
| 2103 French St Fort Myers, FL | 3.0 | 2.0 | 1100 | $1,800 | $1.64 | 3d | 1 | 0.74mi |
| 2103 French St Unit 2 Fort Myers, FL | 3.0 | 2.0 | 1100 | $1,800 | $1.64 | 24d | 1 | 0.74mi |
| 2103 French St Fort Myers, FL | 3.0 | 2.0 | 1100 | $1,900 | $1.73 | 24d | 1 | 0.74mi |
| 2103 French St Fort Myers, FL | 3.0 | 2.0 | 1100 | $1,800 | $1.64 | 2d | 1 | 0.74mi |
| 3216 Dale St Fort Myers, FL | 2.0 | 1.0 | 886 | $1,650 | $1.86 | 4d | 1 | 0.74mi |
| 2132 Barker Blvd Fort Myers, FL | 4.0 | 2.0 | 1367 | $2,600 | $1.90 | 24d | 1 | 0.74mi |
| 1270 Allen St Unit B Fort Myers, FL | 3.0 | 2.0 | 1085 | $1,700 | $1.57 | 24d | 1 | 0.77mi |
| 2188 Barker Blvd Fort Myers, FL | 4.0 | 2.0 | 1367 | $2,600 | $1.90 | 24d | 1 | 0.81mi |
| 2197 Davis Ct Fort Myers, FL | 4.0 | 2.0 | 1257 | $2,450 | $1.95 | 4d | 1 | 0.83mi |
| 3339 Edgewood Ave Fort Myers, FL | 2.0 | 1.0 | 860 | $1,300 | $1.51 | 17d | 1 | 0.84mi |
| 3339 Edgewood Ave Fort Myers, FL | 2.0 | 1.0 | 860 | $1,300 | $1.51 | 4d | 1 | 0.84mi |
| 3233 Edgewood Ave Fort Myers, FL | 2.0 | 1.0 | 950 | $1,595 | $1.68 | 22d | 1 | 0.84mi |
| 8 Roanoke Dr Fort Myers, FL | 3.0 | 2.0 | 1056 | $1,495 | $1.42 | 22d | 1 | 0.85mi |
| 815 Freemont St Fort Myers, FL | 2.0 | 1.0 | 850 | $1,250 | $1.47 | 24d | 1 | 0.88mi |
| 3555 Seminole Ave Fort Myers, FL | 2.0 | 1.0 | 775 | $1,000 | $1.29 | 24d | 1 | 0.88mi |
| 3160 E Riverside Dr #3 Fort Myers, FL | 2.0 | 1.0 | 825 | $1,050 | $1.27 | 15d | 1 | 0.89mi |
| 3160 E Riverside Dr Unit 6 Fort Myers, FL | 2.0 | 1.0 | 825 | $1,050 | $1.27 | 24d | 1 | 0.90mi |
| 838 Van Buren St Fort Myers, FL | 2.0 | 2.0 | 800 | $1,275 | $1.59 | 12d | 1 | 0.93mi |
| 2225 Carver Ave Fort Myers, FL | 3.0 | 2.0 | 1193 | $2,200 | $1.84 | 24d | 1 | 0.93mi |
| 4051 Regata Way Fort Myers, FL | 1.0–3.0 | 1.0–2.0 | 987 | $2,021 | $2.05 | 3d | 34 | 0.94mi |
| 3165 E Riverside Dr Fort Myers, FL | 2.0 | 1.0–2.0 | 925 | $1,250 | $1.35 | 2d | 1 | 0.94mi |
| 3040 Douglas Ave Unit 3042 Fort Myers, FL | 2.0 | 1.0 | 800 | $1,150 | $1.44 | 4d | 1 | 0.98mi |
| 3744 Estelle Ave Fort Myers, FL | 2.0 | 1.0 | 725 | $999 | $1.38 | 24d | 1 | 0.98mi |
| 3000 Oasis Grand Blvd #3006 Fort Myers, FL | 2.0 | 2.0 | 1008 | $3,500 | $3.47 | 24d | 1 | 0.99mi |
Listing history 21 events
-
2026-06-02statusdays on market $99,000 Pending 12 DOM
-
2026-06-01days on market $99,000 Active 11 DOM
-
2026-05-31days on market $99,000 Active 10 DOM
-
2026-05-21$99,000 Active
-
2026-03-29historical $1,540
-
2026-03-24$1,540
-
2018-08-15soldstatus $9,430,058
-
2015-03-02price $74,900 360-char remark
Show marketing remark (293 chars)
There are multiple offers on this property. Please submit the attached multiple offer form with your highest and best offer by 5:00 PM 6-17-11. Perfect for the Handyman! Needs A/C, Carpet and paint. Close to schools, shopping and Fort Myers Historical District. Good investment property. .
-
2015-03-02price $11,000 293-char remark
Show marketing remark (293 chars)
There are multiple offers on this property. Please submit the attached multiple offer form with your highest and best offer by 5:00 PM 6-17-11. Perfect for the Handyman! Needs A/C, Carpet and paint. Close to schools, shopping and Fort Myers Historical District. Good investment property. .
-
2014-05-14soldstatus $47,000
-
2014-04-25price $49,900
-
2014-04-25soldstatus $47,000
-
2014-03-19$47,000
-
2011-08-29soldstatus $24,000
-
2011-08-24price $24,900
-
2011-07-13soldstatus $16,000 293-char remark
Show marketing remark (293 chars)
There are multiple offers on this property. Please submit the attached multiple offer form with your highest and best offer by 5:00 PM 6-17-11. Perfect for the Handyman! Needs A/C, Carpet and paint. Close to schools, shopping and Fort Myers Historical District. Good investment property. .
-
2005-10-07soldstatus $95,000
-
2005-09-27soldstatus $95,000 360-char remark
Show marketing remark (360 chars)
This home was completely remodled 2 years ago with brand new kitchen, baths, lots of tile, replumbed, updated electric, new central hvac, new windows and more. House has been rented for $775. Vacant now and easy to rent. Great investment or affordable home. Owners selling to disolve partnership and have priced it for a quick sale. Hurry this one won't last.
-
2003-01-21soldstatus $75,000
-
1999-04-19soldstatus $9,000
-
1999-04-19soldstatus $9,000
ⓘ Source: listings_history table (triggers on properties + properties_extension) + one-shot
backfill from property_details.listing_events for pre-trigger history.
Tax reassessment forecast FL · Resets to sale price
- Current annual tax
- $2,617 · $218/mo
- Projected year-2 tax
- $2,617 · $218/mo
- Expected delta
- $0/yr ($0/mo · 0.0%)
ⓘ Screening estimate from a state-policy table — verify with the county assessor before closing.
Climate risk First Street
- Flood 2/10 Low FEMA zone X (unshaded) · 5% chance over 30 yrs
- Wildfire 3/10 Moderate
- Heat 10/10 Extreme 7 d/yr ≥107°F today · 30 d/yr by 30 yrs out
- Wind 10/10 Extreme 99% chance of damaging wind over 30 yrs
- Air quality 2/10 Low 1 unhealthy d/yr today · 1 by 30 yrs out
Nearby sold comps map
Loading sold comps map…
Walkable amenities ~0.75 mi
Loading nearby amenities…
Taxation est. · year 1
- Rental income
- $19,583
- − Mortgage interest
- −$5,546
- − Property taxes
- −$2,617
- − Insurance
- −$495
- − Repairs & maintenance
- −$1,567
- − Management
- −$1,567
- − Depreciation
- −$2,880
- Taxable income
- $4,913
- Est. tax owed @ 24.0%
- −$1,179
- After-tax cash flow
- $4,950/yr
For passive investors: Depreciation is non-cash, so a rental often shows a tax loss while cash-flowing — sheltering income. Rental losses are passive: they offset passive income freely, and up to $25,000/yr can offset ordinary (W-2) income if you actively participate and your MAGI is under $100k (phasing out to $0 by $150k); unused losses carry forward. On sale, claimed depreciation is recaptured at up to 25%, and gains may owe capital-gains tax (a 1031 exchange can defer both). Figures are a year-1 estimate at your 24.0% rate — not tax advice; consult a CPA.
Schools (NCES district)
- District
- Lee
- NCES district ID
- 1201080
- Math proficiency
- 47% ▼ -11.00%
- Reading proficiency
- 50% ▼ -4.00%
- Median HH income
- $49,518
- Composite
- 41.49/100
- National rank
- #3458
- State rank
- #42 of 73 in FL
Livability — Fort Myers
- Score
- 86/100
- State rank
- #14
- US rank
- #383
Category grades
Schools grade is shown separately in the Schools card above.
Census & demographics
- Census place
- Fort Myers, FL
- County
- Lee County · 788,662 people
- City population
- 278,598
- Metro
- Cape Coral-Fort Myers, FL
- Population (ZIP)
- 27,943
- Household income
- $52,586
- Rent vs Own
- Severe rent burden
- 2324.0
Population outlook (Lee County) Hauer SSP2
- Today (2025)
- 871,946 people
- By 2030
- 955,468 · +9.6%
- By 2040
- 1,113,587 · +27.7%
- By 2050
- 1,256,891 · +44.1%
- By 2075
- 1,560,270 · +78.9%
- By 2100
- 1,726,848 · +98.0%
Race, ethnicity, and origin ACS 2023
- Neighborhood character
- Highly diverse neighborhood (Simpson 0.71)
- Race & ethnicity
- Black 34% Hispanic / Latino 30% White 28% Two or more races 21% Asian 2%
- Hispanic origin (detail)
- Mexican 5% Puerto Rican 6% Cuban 7% Dominican 1%
- Common ancestry
- Estonian 3% Hispanic 1% Romanian 1%
- Foreign-born
- 22% · Canada, Vietnam, China
- Languages at home
- 69% English-only · Spanish 24% Other Indo-European 4% French/Haitian/Cajun 1%
Political lean MEDSL · Lee
- 2024 margin
- Strong R (+28.4) · D 35.5% · R 63.9%
- 2008→2024 swing
- -18.0pp toward R · 2008: -10.4pp · 2024: -28.4pp
- All cycles
- 2024: R+28.4 2020: R+19.2 2016: R+20.4 2012: R+16.6 2008: R+10.4
Not yet ingested
- Civics
- —
Market trends
- HPI YoY
- ▼ -95.73%
- Current HPI
- 243.2657
- Rent YoY
- ▼ -4.30%
- Metro
- Cape Coral-Fort Myers, FL
- State GDP YoY
- ▲ 3.28%
- F500 in state
- 36
Industry mix (Fortune 500 HQ in FL)
| Industry | F500 HQs | Revenue |
|---|---|---|
| Industrial Technology | 2 | $29B |
|
||
| Insurance | 2 | $17B |
|
||
| Retail | 1 | $60B |
|
||
| Technology Distribution | 1 | $58B |
|
||
| Homebuilding | 1 | $35B |
|
||
| Technology Manufacturing | 1 | $35B |
|
||
Price history
+1000.0% since first listed18 events — show timeline
- 2026-05-21 Listed $99,000 NAPLESMLS
- 2026-03-29 Rental Removed $1,540 RENTPROGRESS
- 2026-03-24 Listed for Rent $1,540 RENTPROGRESS
- 2018-08-15 Sold (Public Records) $9,430,058 Public Records
- 2015-03-02 Price Changed $74,900 FORTMLS
- 2015-03-02 Price Changed $11,000 FORTMLS
- 2014-05-14 Sold (Public Records) $47,000 Public Records
- 2014-04-25 Sold (MLS) $47,000 FORTMLS
- 2014-04-25 Price Changed $49,900 FORTMLS
- 2014-03-19 Listed $47,000 FORTMLS
- 2011-08-29 Sold (MLS) $24,000 FORTMLS
- 2011-08-24 Price Changed $24,900 FORTMLS
- 2011-07-13 Sold (MLS) $16,000 FORTMLS
- 2005-10-07 Sold (Public Records) $95,000 Public Records
- 2005-09-27 Sold (MLS) $95,000 FORTMLS
- 2003-01-21 Sold (Public Records) $75,000 Public Records
- 1999-04-19 Sold (Public Records) $9,000 Public Records
- 1999-04-19 Sold (Public Records) $9,000 Public Records
Property tax history
+10.7%/yrLatest (2025): $2,617 · +4.1% YoY. Source: county tax records.
Cash-flow waterfall
monthlySold comps — $/sqft
last 12 mo · ≤1 miLoading sold comps…