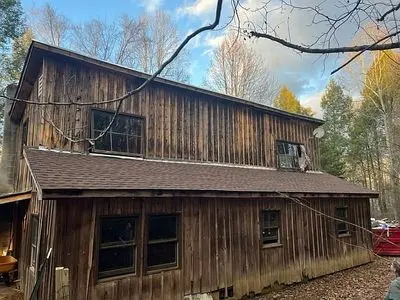
96 Rebel Dr · Hot Springs, NC
Flood risk 1/10 · Minimal
- FEMA flood zone
- X (unshaded)
- Chance of flooding over 30 yrs
- 0.0%
- Est. flood insurance / yr
- $507 – $1,088
Fire risk 6/10 · Moderate
- Est. fire insurance / yr
- $906 – $1,684
Heat risk 5/10 · Moderate
- Hot days now (above 99°F)
- 8 days/yr
- Hot days in 30 yrs
- 23 days/yr
Wind risk 2/10 · Minimal
- Chance of severe wind over 30 yrs
- —
Air-quality risk 3/10 · Minor
- Unhealthy air days now
- 2 days/yr
- Unhealthy air days in 30 yrs
- 2 days/yr
Risk factors via First Street. Map © Google.
Why this score? — see what drove the C+ grade
The composite is a weighted blend of 9 inputs, each scored 0–100. Each bar is that input's sub-score; the figure is the points it added to the 100-point composite (weight × sub-score).
- Cash flow +23.6/30.0
- DSCR +7.6/10.0
- ARV discount +7.5/15.0
- Appreciation +5.2/10.0
- 1% rule +5.0/10.0
- Schools +4.5/10.0
- Livability +3.3/5.0
- Rent growth +2.5/5.0
- Condition / age +2.5/5.0
$125,600
🖨 Deal sheet 📄 Offer letter ✓ Due diligence
Listing remarks
Rustic Mountain Homestead Renovation Opportunity! WORK IN PROGRESS. New Roof December 2025. Bring your vision & acirc; & euro; & rdquo; this property has the bones and setting to become something truly special. It is the definition of a work in progress and is being SOLD AS-IS. Joists/flooring/siding all needs to be replaced, many structural things in progress. We have put a lot of elbow-grease in it and much more will be required. The house requires construction, renovation, finishing and repairs. Private, wooded setting with a peaceful, off-the-beaten-path feel. Two story layout with upper living space/potential master bedroom that could easily be renovated with high ceiling
Key facts
- Existing chimney
- Dedicated balcony
- New roof
Tags
Neighborhood map
What this means for you Summary
Snapshot
- This is a 3-bed/1.0-bath single-family listed at $126k.
Deal economics
- At list price, monthly cash flow is $237 ($3k/yr) — positive.
- The deal already cash-flows at list — no discount required.
- To meet the 1% rule (rent ≥ 1% of price), the offer needs to be $125k (0.4% below list).
- Recommended offer: $124k (1.5% below list) — sets the bar for market timing.
- Cap rate 8.6% vs local median 0.6% in Hot Springs — top-decile yield for the area; either an underpriced asset or a hidden risk that comps aren't pricing in. Stress-test before assuming the spread holds.
Location & tenants
- Location reads 66/100 on livability (#288 in NC) — a middle-class / working-renter tenant base. Strengths: cost of living A+, health & safety A+, housing A-; Watch: schools D+, crime D, amenities F.
- Madison County Schools (rural): math 51% / reading 56% proficiency, ranked #55 of 178 in NC (top 31%) — acceptable for families but not a draw, mixed tenant base, ~2y average lease.
- Market conditions: 41 active listings in the ZIP; 209 units permitted in Madison County in 2024 (5 in 5+ unit buildings).
Forward outlook
- In year one you build about $1k of equity ($868 loan paydown + $615 appreciation (0.5% local appreciation)).
- At projected returns (0.5% appreciation + 3.0% rent growth), your $35k cash investment doubles in ~7 years — after that, you're playing with house money.
Negotiation context
- It's been on market 24 days — a 2% lower offer ($124k) is reasonable based on typical stale-listing flexibility.
Risks & watch-outs
- Climate carrying-cost: major wildfire risk; extreme-heat days projected 8→23/yr by 2055 (HVAC capex compounding) — expect insurance premiums to compound above CPI over the hold.
Questions for the listing agent
- Is there a deadline driving the sale (1031 exchange, divorce, estate, relocation)? That informs how much negotiation room exists.
- Schools are D-rated, which usually means shorter tenancies and higher turnover. Who's the typical renter profile here, and what's been the actual vacancy rate?
- Crime grade is D in this area — have there been break-ins, vandalism, or insurance claims at this property in the last 3 years? What carrier currently insures it and at what premium?
- What's the average days-on-market for RENTAL listings here right now (not sales)? A rising rental-DOM trend means longer vacancies and softer asking-rent achievability than the comps imply.
- What's the recent tenant-quality profile in this submarket — average credit score on applications, eviction rate, late-payment / NSF rate, and stable-employment percentage? A property-management company in the area should have these aggregated.
- How much new for-sale + rental construction is in the pipeline within 1–3 miles? Heavy new supply typically softens prices + rents 12–24 months out; constrained supply supports both.
Investment metrics
- 1% rule
- 1.00% ✗
- Cap rate
- 8.55%
- Cash-on-cash
- 8.08%
- DSCR
- 1.36
- GRM
- 8.4
CMA / ARV
No comps found within radius.
Projected returns pro-forma
0.49% appreciation · 3.0% rent growth · sell at horizon
- IRR
- 8.2%
- Equity multiple
- 1.41×
- Total profit
- $14,265
- Equity at exit
- $39,573
- IRR
- 12.7%
- Equity multiple
- 2.46×
- Total profit
- $51,463
- Equity at exit
- $50,122
Cash invested: $35,168 (down + closing). Projections, not guarantees.
Landlord ↔ Tenant lean methodology
- Overall (STATE)
- 85 Strongly Landlord-Friendly
- State North Carolina
- 85 Strongly Landlord-Friendly · R+3
- County
- — inherits STATE
- City
- — inherits STATE
ZIP-level market 28743
- Home prices YoY
- 0.3%
- Active inventory
- 41
- Price-to-rent
- 8.4×
Monthly cashflow live
- Estimated rent
- $1,251 medium interval (Pro) →
- Mortgage (P&I)
- −$659
- Tax from tax record
- −$40 /mo · $483/yr
- Insurance
- −$52
- HOA
- −$0
- Vacancy / Maint / Mgmt
- −$263
- Net cashflow
- $237
Break-even live
UW: 25.0% down · 7.5% · 30yr · 1.5% tax · 5.0% vac · 8.0% maint · 8.0% mgmt
Financing live
Cash to close
- Down payment
- $31,400
- Closing costs
- $3,768
- Reserves months
- —
- Total cash needed
- —
Loan-product check · same deal, 3 products live
Conventional
25% down · 7.5% · 30yr
- Down + closing
- —
- Monthly P&I
- —
- Monthly cashflow
- —
- DSCR
- —
- Eligible?
- —
Personal DTI + credit; lowest rate.
DSCR
20% down · 8.5% · 30yr
- Down + closing
- —
- Monthly P&I
- —
- Monthly cashflow
- —
- DSCR
- —
- Eligible?
- —
No personal income docs; deal must DSCR.
Hard money
10% down · 12.0% · 12mo
- Down + closing
- —
- Monthly P&I
- —
- Monthly cashflow
- —
- DSCR
- —
- Eligible?
- —
Short-term bridge; refi at stabilization.
Listing history 16 events
-
2026-06-19days on market $125,600 Active 24 DOM
-
2026-06-18days on market $125,600 Active 23 DOM
-
2026-06-17days on market $125,600 Active 22 DOM
-
2026-06-16days on market $125,600 Active 21 DOM
-
2026-06-15days on market $125,600 Active 20 DOM
-
2026-06-14days on market $125,600 Active 18 DOM
-
2026-06-12days on market $125,600 Active 17 DOM
-
2026-06-09days on market $125,600 Active 14 DOM
-
2026-06-08days on market $125,600 Active 13 DOM
-
2026-06-07days on market $125,600 Active 12 DOM
-
2026-06-03days on market $125,600 Active 8 DOM
-
2026-06-02days on market $125,600 Active 7 DOM
-
2026-06-01days on market $125,600 Active 6 DOM
-
2026-05-31days on market $125,600 Active 5 DOM
-
2026-05-30days on market $125,600 Active 4 DOM
-
2026-05-26$125,600 Active
ⓘ Source: listings_history table (triggers on properties + properties_extension) + one-shot
backfill from property_details.listing_events for pre-trigger history.
Tax reassessment forecast NC · Resets to sale price
- Current annual tax
- $483 · $40/mo
- Projected year-2 tax
- $1,030 · $86/mo
- Expected delta
- +$547/yr (+$46/mo · 113.2%)
ⓘ Screening estimate from a state-policy table — verify with the county assessor before closing.
Climate risk First Street
- Flood 1/10 Low FEMA zone X (unshaded) · 0% chance over 30 yrs
- Wildfire 6/10 Major
- Heat 5/10 Major 8 d/yr ≥99°F today · 23 d/yr by 30 yrs out
- Wind 2/10 Low
- Air quality 3/10 Moderate 2 unhealthy d/yr today · 2 by 30 yrs out
Nearby sold comps map
Loading sold comps map…
Walkable amenities ~0.75 mi
Loading nearby amenities…
Taxation est. · year 1
- Rental income
- $15,007
- − Mortgage interest
- −$7,036
- − Property taxes
- −$483
- − Insurance
- −$628
- − Repairs & maintenance
- −$1,201
- − Management
- −$1,201
- − Depreciation
- −$3,654
- Taxable income
- $805
- Est. tax owed @ 24.0%
- −$193
- After-tax cash flow
- $2,647/yr
For passive investors: Depreciation is non-cash, so a rental often shows a tax loss while cash-flowing — sheltering income. Rental losses are passive: they offset passive income freely, and up to $25,000/yr can offset ordinary (W-2) income if you actively participate and your MAGI is under $100k (phasing out to $0 by $150k); unused losses carry forward. On sale, claimed depreciation is recaptured at up to 25%, and gains may owe capital-gains tax (a 1031 exchange can defer both). Figures are a year-1 estimate at your 24.0% rate — not tax advice; consult a CPA.
Schools (NCES district)
- District
- Madison County Schools
- NCES district ID
- 3702820
- Math proficiency
- 51% ▲ 3.00%
- Reading proficiency
- 56% ▲ 4.00%
- Median HH income
- $39,050
- Composite
- 44.62/100
- National rank
- #2774
- State rank
- #55 of 178 in NC
Livability — Hot Springs
- Score
- 66/100
- State rank
- #288
- US rank
- #12286
Category grades
Schools grade is shown separately in the Schools card above.
Census & demographics
- Population (ZIP)
- 2,374
Population outlook (Madison County) Hauer SSP2
- Today (2025)
- 21,646 people
- By 2030
- 21,839 · +0.9%
- By 2040
- 22,031 · +1.8%
- By 2050
- 22,050 · +1.9%
- By 2075
- 22,327 · +3.1%
- By 2100
- 21,365 · -1.3%
Race, ethnicity, and origin ACS 2023
- Neighborhood character
- Predominantly White (97%)
- Race & ethnicity
- White 97% Two or more races 2% Black 1%
- Common ancestry
- Slovak 5% Romanian 2% Lithuanian 2%
- Languages at home
- 99% English-only · German/W. Germanic 1%
Political lean MEDSL · Madison
- 2024 margin
- Strong R (+23.5) · D 37.5% · R 61.0% · Other 1.4%
- 2008→2024 swing
- -21.9pp toward R · 2008: -1.6pp · 2024: -23.5pp
- All cycles
- 2024: R+23.5 2020: R+23.5 2016: R+25.9 2012: R+9.1 2008: R+1.6
Not yet ingested
- Civics
- —
Market trends
- HPI YoY
- ▲ 0.49%
- Current HPI
- 181.599
- Rent YoY
- —
- Metro
- —
- State GDP YoY
- ▲ 3.28%
- F500 in state
- 26
Industry mix (Fortune 500 HQ in NC)
| Industry | F500 HQs | Revenue |
|---|---|---|
| Financial Services | 2 | $213B |
|
||
| Retail | 2 | $95B |
|
||
| Industrial Conglomerate | 1 | $38B |
|
||
| Metals / Steel | 1 | $35B |
|
||
| Utilities | 1 | $30B |
|
||
| Industrial Machinery | 1 | $19B |
|
||
Price history
1 event — show timeline
- 2026-05-26 Listed $125,600 FSBO.com
Property tax history
+0.0%/yrLatest (2018): $483 · +0.0% YoY. Source: county tax records.
Cash-flow waterfall
monthlySold comps — $/sqft
last 12 mo · ≤1 miLoading sold comps…