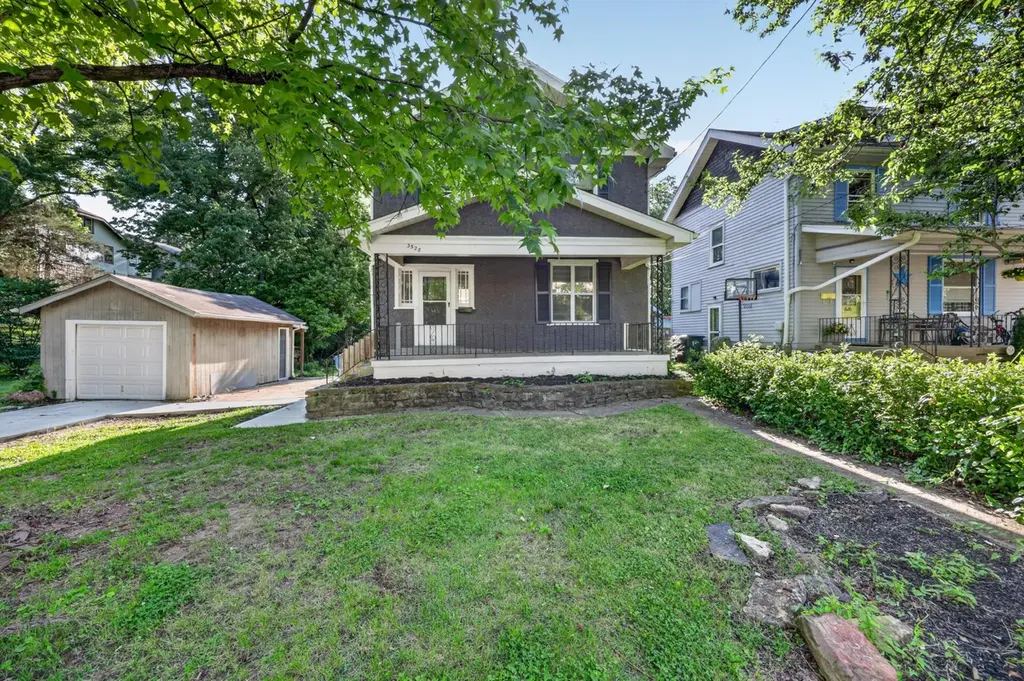
3528 Park Dr · Covington, KY
Flood risk 2/10 · Minimal
- FEMA flood zone
- X (unshaded)
- Chance of flooding over 30 yrs
- 0.06%
- Est. flood insurance / yr
- $507 – $1,088
Fire risk 1/10 · Minimal
- Est. fire insurance / yr
- $839 – $1,559
Heat risk 4/10 · Minor
- Hot days now (above 102°F)
- 7 days/yr
- Hot days in 30 yrs
- 19 days/yr
Wind risk 2/10 · Minimal
- Chance of severe wind over 30 yrs
- 1.0%
Air-quality risk 3/10 · Minor
- Unhealthy air days now
- 2 days/yr
- Unhealthy air days in 30 yrs
- 3 days/yr
Risk factors via First Street. Map © Google.
Why this score? — see what drove the C- grade
The composite is a weighted blend of 9 inputs, each scored 0–100. Each bar is that input's sub-score; the figure is the points it added to the 100-point composite (weight × sub-score).
- Cash flow +15.9/30.0
- ARV discount +15.0/15.0
- DSCR +4.9/10.0
- Livability +4.3/5.0
- 1% rule +4.2/10.0
- Rent growth +2.5/5.0
- Condition / age +2.5/5.0
- Schools +1.5/10.0
- Appreciation +0.0/10.0
$174,900
🖨 Deal sheet (PDF) 📄 Offer letter ✓ Due diligence
Listing remarks MLS
This home is a little gem! Sitting on a cul-de-sac street, it comes with a great country backyard. The home does need some TLC, but the bones are good. Very charming and private! This home is a short sale transaction so all offers will be submitted to PennyMac. Home is being sold As Is, Where Is.
Key facts
- Covered front porch
- Private deck
- Detached garage
Tags
Property features AI
Exterior
- Parking: Driveway; On-street parking
- Utilities: Public water service; Public sewer service; Natural gas available
- Home design: Single family residence; Two levels
- Construction: Built in 1920; Stucco exterior; Block and stone foundation
- Exterior features: Lot approximately 0.29 acres; Public water; Public sewer; Natural gas available; Sewer available; Water available
Interior
- Kitchen: Electric range; Microwave; Refrigerator
- Bedrooms: Primary bedroom (approx. 11 x 11); Bedroom 2 (approx. 11 x 9); Bedroom 3 (approx. 11 x 8)
- Bathrooms: 1 full bathroom; 1 half bathroom; Primary bath (listed)
- Interior features: Wood-burning fireplace; Central air conditioning; Forced air heating
Neighborhood map
What this means for you Summary
Snapshot
- This is a 3-bed/1.0-bath single-family listed at $175k.
Deal economics
- At list price, monthly cash flow is $84 ($1k/yr) — positive.
- The deal already cash-flows at list — no discount required.
- To meet the 1% rule (rent ≥ 1% of price), the offer needs to be $161k (7.8% below list).
- Recommended offer: $161k (7.8% below list) — sets the bar for 1% rule.
- Cap rate 6.9% vs local median 5.3% in Covington — meaningfully above typical; check what's discounted (condition, days-on-market, listing class) to confirm the premium yield is real.
Location & tenants
- Location reads 86/100 on livability (#40 in KY, #376 nationally) — a professional / high-income tenant draw. Strengths: amenities A+, commute A+, cost of living A+; Watch: employment D+.
- Covington Independent (suburban): math 10% / reading 27% proficiency, ranked #162 of 165 in KY (top 98%) — low school quality limits family demand, transient renter base, plan for 1-2y turnover; 78% free/reduced lunch — lower-income household profile, screen leases tightly.
- Zoned schools: Latonia Elementary School (math 12% / reading 32%, grade F, #525 of 676 statewide, top 82%, 285 students, 87% FRL); Holmes Middle School (math 8% / reading 26%, grade F, #211 of 217 statewide, top 97%, 656 students, 84% FRL); Holmes High School (math 12% / reading 17%, grade F, #227 of 254 statewide, top 89%, 878 students, 80% FRL).
- Market conditions: 161 active listings in the ZIP; 9 comparable units currently listed for rent nearby; rentals leasing fast (median 10d on market — plan ~1-2 weeks tenant-placement turnaround); 699 units permitted in Kenton County in 2024 (287 in 5+ unit buildings).
Forward outlook
- Local home prices are declining (-3.0%/yr); year-one equity from $1k of loan paydown is wiped out by about $5k of value loss. Plan a longer hold.
- Kenton County population projected at +5% by 2050 — modest demand growth; plan on rents tracking national, not racing it.
Negotiation context
- It's been on market 16 days — a 2% lower offer ($172k) is reasonable based on typical stale-listing flexibility.
- 3 sale attempts since 8y ago with the ask held roughly flat each time — persistent listings suggest the price (not the market) is what's stuck; bring a comps-based counter.
- Current owner paid $130k; 35% above their basis — modest negotiation headroom, anchor on the comps not their cost.
Risks & watch-outs
- Watch-outs: built in 1920 — expect roof / HVAC / electrical / plumbing capex.
Questions for the listing agent
- Built in 1920 — when were the roof, HVAC, electrical panel, plumbing, and water heater last replaced?
- Is there a deadline driving the sale (1031 exchange, divorce, estate, relocation)? That informs how much negotiation room exists.
- What's the average days-on-market for RENTAL listings here right now (not sales)? A rising rental-DOM trend means longer vacancies and softer asking-rent achievability than the comps imply.
- What's the recent tenant-quality profile in this submarket — average credit score on applications, eviction rate, late-payment / NSF rate, and stable-employment percentage? A property-management company in the area should have these aggregated.
- How much new for-sale + rental construction is in the pipeline within 1–3 miles? Heavy new supply typically softens prices + rents 12–24 months out; constrained supply supports both.
Investment metrics
- 1% rule
- 0.92% ✗
- Cap rate
- 6.87%
- Cash-on-cash
- 2.06%
- DSCR
- 1.09
- GRM
- 9.0
CMA / ARV
- ARV (on-the-fly)
- $223,600
- Comps found
- 12
Show comp detail 12 sales within ~0.75 mi
| Address | Dist | Beds/Ba | Sqft | Sold | Price | $/sf | Match |
|---|---|---|---|---|---|---|---|
| 3706 Glenn Ave | 0.17mi | 2/1.0 (-1) | 1,326 (+2%) | 2mo | $217,500 | $164 | 82 |
| 3704 Huntington Ave | 0.20mi | 3/2.0 | 1,212 (-7%) | 0mo | $220,000 | $182 | 75 |
| 205 E 38th St | 0.33mi | 2/1.5 (-1) | 1,347 (+4%) | 3mo | $231,500 | $172 | 69 |
| 8 W 30th St | 0.54mi | 3/1.0 | 1,348 (+4%) | 3mo | $77,600 | $58 | 66 |
| 9 Madison Ct | 0.69mi | 3/2.0 | 1,297 (-0%) | 2mo | $230,000 | $177 | 61 |
| 25 W 28th St | 0.61mi | 3/1.5 | 1,234 (-5%) | 2mo | $266,000 | $216 | 60 |
| 4415 Huntington Ave | 0.73mi | 3/1.0 | 1,400 (+8%) | 3mo | $217,500 | $155 | 51 |
| 21 W 31st St | 0.52mi | 2/1.5 (-1) | 1,144 (-12%) | 1mo | $90,000 | $79 | 48 |
| 3920 Church St | 0.50mi | 2/1.0 (-1) | 1,123 (-14%) | 2mo | $232,000 | $207 | 48 |
| 30 W 28th St | 0.64mi | 3/2.0 | 1,157 (-11%) | 1mo | $200,000 | $173 | 47 |
| 3098 Beech Ave | 0.70mi | 2/1.0 (-1) | 1,142 (-12%) | 3mo | $195,000 | $171 | 40 |
| 4347 Vermont Ave | 0.66mi | 2/2.0 (-1) | 1,108 (-15%) | 0mo | $105,000 | $95 | 36 |
Match score weights: distance 35% · size 25% · config 20% · recency 20%. Top-matched comps best support the ARV.
Projected returns pro-forma
-3.0% appreciation · 3.0% rent growth · sell at horizon
- IRR
- -13.0%
- Equity multiple
- 0.53×
- Total profit
- $-22,962
- Equity at exit
- $26,078
- IRR
- -4.0%
- Equity multiple
- 0.73×
- Total profit
- $-13,033
- Equity at exit
- $15,122
Cash invested: $48,972 (down + closing). Projections, not guarantees.
Landlord ↔ Tenant lean methodology
- Overall (STATE)
- 83 Strongly Landlord-Friendly
- State Kentucky
- 83 Strongly Landlord-Friendly · R+16
- County
- — inherits STATE
- City
- — inherits STATE
ZIP-level market 41015
- Active inventory
- 161
- Price-to-rent
- 9.0×
Monthly cashflow live
- Estimated rent
- $1,612 high interval (Pro) →
- Mortgage (P&I)
- −$917
- Tax from tax record
- −$199 /mo · $2,393/yr
- Insurance
- −$73
- HOA
- −$0
- Vacancy / Maint / Mgmt
- −$339
- Net cashflow
- $84
Break-even live
Sensitivity live
| Price | -10% $183 | -5% $134 | +0% $84 | +5% $35 | +10% $-15 |
|---|---|---|---|---|---|
| Rent | -10% $-43 | -5% $21 | +0% $84 | +5% $148 | +10% $212 |
| Rate | -1.0pp $172 | -0.5pp $129 | base $84 | +0.5pp $39 | +1.0pp $-7 |
UW: 25.0% down · 7.5% · 30yr · 1.5% tax · 5.0% vac · 8.0% maint · 8.0% mgmt
Financing live
Cash to close
- Down payment
- $43,725
- Closing costs
- $5,247
- Reserves months
- —
- Total cash needed
- —
Loan-product check · same deal, 3 products live
Conventional
25% down · 7.5% · 30yr
- Down + closing
- —
- Monthly P&I
- —
- Monthly cashflow
- —
- DSCR
- —
- Eligible?
- —
Personal DTI + credit; lowest rate.
DSCR
20% down · 8.5% · 30yr
- Down + closing
- —
- Monthly P&I
- —
- Monthly cashflow
- —
- DSCR
- —
- Eligible?
- —
No personal income docs; deal must DSCR.
Hard money
10% down · 12.0% · 12mo
- Down + closing
- —
- Monthly P&I
- —
- Monthly cashflow
- —
- DSCR
- —
- Eligible?
- —
Short-term bridge; refi at stabilization.
Rent comps 9 comps
| Address | Beds | Baths | Sqft | Rent | $/sqft | DOM | Units | Dist |
|---|---|---|---|---|---|---|---|---|
| 3918 Glenn Ave Unit 1 Covington, KY | 2.0 | 1.0 | 1350 | $1,449 | $1.07 | 22d | 1 | 0.36mi |
| 120 Vista Point Dr Wilder, KY | 1.0–2.0 | 1.0–2.0 | 854 | $1,184 | $1.39 | 4d | 2 | 0.76mi |
| 400 Lakeview Dr #5 Wilder, KY | 2.0 | 2.0 | 1100 | $1,495 | $1.36 | 4d | 1 | 0.77mi |
| 24 Woodland Hills Dr #11 Southgate, KY | 2.0 | 2.0 | 950 | $1,445 | $1.52 | 9d | 1 | 1.06mi |
| 1700 Aspen Pines Dr Wilder, KY | 1.0–3.0 | 1.0–2.5 | 1420 | $2,365 | $1.67 | 3d | 14 | 1.13mi |
| 2307 Center St Covington, KY | 3.0 | 1.5 | 1216 | $1,950 | $1.60 | 9d | 1 | 1.15mi |
| 512 Wallace Ave Unit 512/18 Covington, KY | 2.0 | 2.0 | 900 | $1,299 | $1.44 | 9d | 1 | 1.15mi |
| 2030 Mackoy St Covington, KY | 3.0 | 1.5 | 1598 | $1,779 | $1.11 | 6d | 1 | 1.24mi |
| 1927 Scott St Apt 1 Covington, KY | 3.0 | 2.0 | 1865 | $2,100 | $1.13 | 21d | 1 | 1.35mi |
Listing history 9 events
-
2026-06-21days on market $174,900 Active 16 DOM
-
2026-06-18days on market $174,900 Active 13 DOM
-
2026-06-17days on market $174,900 Active 12 DOM
-
2026-06-16days on market $174,900 Active 11 DOM
-
2026-06-15days on market $174,900 Active 10 DOM
-
2026-06-09days on market $174,900 Active 4 DOM
-
2026-06-08days on market $174,900 Active 3 DOM
-
2026-06-07remarks 669-char remark
-
2026-06-07$174,900 Active 2 DOM
ⓘ Source: listings_history table (triggers on properties + properties_extension) + one-shot
backfill from property_details.listing_events for pre-trigger history.
Tax reassessment forecast KY · Resets to sale price
- Current annual tax
- $2,393 · $199/mo
- Projected year-2 tax
- $2,393 · $199/mo
- Expected delta
- $0/yr ($0/mo · 0.0%)
ⓘ Screening estimate from a state-policy table — verify with the county assessor before closing.
Climate risk First Street
- Flood 2/10 Low FEMA zone X (unshaded) · 6% chance over 30 yrs
- Wildfire 1/10 Low
- Heat 4/10 Moderate 7 d/yr ≥102°F today · 19 d/yr by 30 yrs out
- Wind 2/10 Low 100% chance of damaging wind over 30 yrs
- Air quality 3/10 Moderate 2 unhealthy d/yr today · 3 by 30 yrs out
Nearby sold comps map
Loading sold comps map…
Walkable amenities ~0.75 mi
Loading nearby amenities…
Taxation est. · year 1
- Rental income
- $19,348
- − Mortgage interest
- −$9,797
- − Property taxes
- −$2,393
- − Insurance
- −$874
- − Repairs & maintenance
- −$1,548
- − Management
- −$1,548
- − Depreciation
- −$5,088
- Taxable loss
- −$1,900
- Est. tax savings @ 24.0%
- +$456
- After-tax cash flow
- $1,467/yr
For passive investors: Depreciation is non-cash, so a rental often shows a tax loss while cash-flowing — sheltering income. Rental losses are passive: they offset passive income freely, and up to $25,000/yr can offset ordinary (W-2) income if you actively participate and your MAGI is under $100k (phasing out to $0 by $150k); unused losses carry forward. On sale, claimed depreciation is recaptured at up to 25%, and gains may owe capital-gains tax (a 1031 exchange can defer both). Figures are a year-1 estimate at your 24.0% rate — not tax advice; consult a CPA.
Schools (NCES district)
- District
- Covington Independent
- NCES district ID
- 2101350
- Math proficiency
- 10% ▼ -20.00%
- Reading proficiency
- 27% ▼ -14.00%
- Median HH income
- $33,681
- Composite
- 15.04/100
- National rank
- #9353
- State rank
- #162 of 165 in KY
Livability — Covington
- Score
- 86/100
- State rank
- #40
- US rank
- #376
Category grades
Schools grade is shown separately in the Schools card above.
Census & demographics
- Census place
- Covington, KY
- City population
- 34,373
- Population (ZIP)
- 20,396
Population outlook (Kenton County) Hauer SSP2
- Today (2025)
- 174,205 people
- By 2030
- 177,897 · +2.1%
- By 2040
- 182,671 · +4.9%
- By 2050
- 183,543 · +5.4%
- By 2075
- 178,977 · +2.7%
- By 2100
- 159,920 · -8.2%
Race, ethnicity, and origin ACS 2023
- Neighborhood character
- Predominantly White (90%)
- Race & ethnicity
- White 90% Two or more races 6% Black 3% Hispanic / Latino 2%
- Common ancestry
- Lithuanian 2% Romanian 2% Slovak 2%
- Foreign-born
- 2% · Canada
- Languages at home
- 97% English-only · Arabic 1% French/Haitian/Cajun 1%
Political lean MEDSL · Kenton
- 2024 margin
- Strong R (+21.7) · D 38.2% · R 59.9% · Other 1.9%
- 2008→2024 swing
- -0.9pp no change · 2008: -20.9pp · 2024: -21.7pp
- All cycles
- 2024: R+21.7 2020: R+19.3 2016: R+26.1 2012: R+24.3 2008: R+20.9
Not yet ingested
- Civics
- —
Market trends
- HPI YoY
- ▼ -110.37%
- Current HPI
- 203.7263
- Rent YoY
- —
- Metro
- —
- State GDP YoY
- ▲ 1.81%
- F500 in state
- 4
Industry mix (Fortune 500 HQ in KY)
| Industry | F500 HQs | Revenue |
|---|---|---|
| Healthcare | 1 | $118B |
|
||
| Food / Beverage | 1 | $7B |
|
||
Price history
+34.6% since first listed11 events — show timeline
- 2026-06-05 Listed $174,900 NKMLS
- 2021-11-19 Sold (Public Records) $130,000 Public Records
- 2021-11-10 Sold (MLS) $130,000 NKMLS
- 2021-07-27 Pending — NKMLS
- 2021-07-26 Price Changed $130,000 NKMLS
- 2021-07-22 Price Changed $129,900 NKMLS
- 2021-07-20 Listed $139,900 NKMLS
- 2018-04-23 Sold (Public Records) $125,000 Public Records
- 2018-04-20 Sold (MLS) $125,000 NKMLS
- 2018-02-14 Sold (Public Records) $45,000 Public Records
- 2018-02-09 Listed $129,900 NKMLS
Property tax history
+10.1%/yrLatest (2025): $2,393 · -9.1% YoY. Source: county tax records.
Cash-flow waterfall
monthlySold comps — $/sqft
last 12 mo · ≤1 miLoading sold comps…