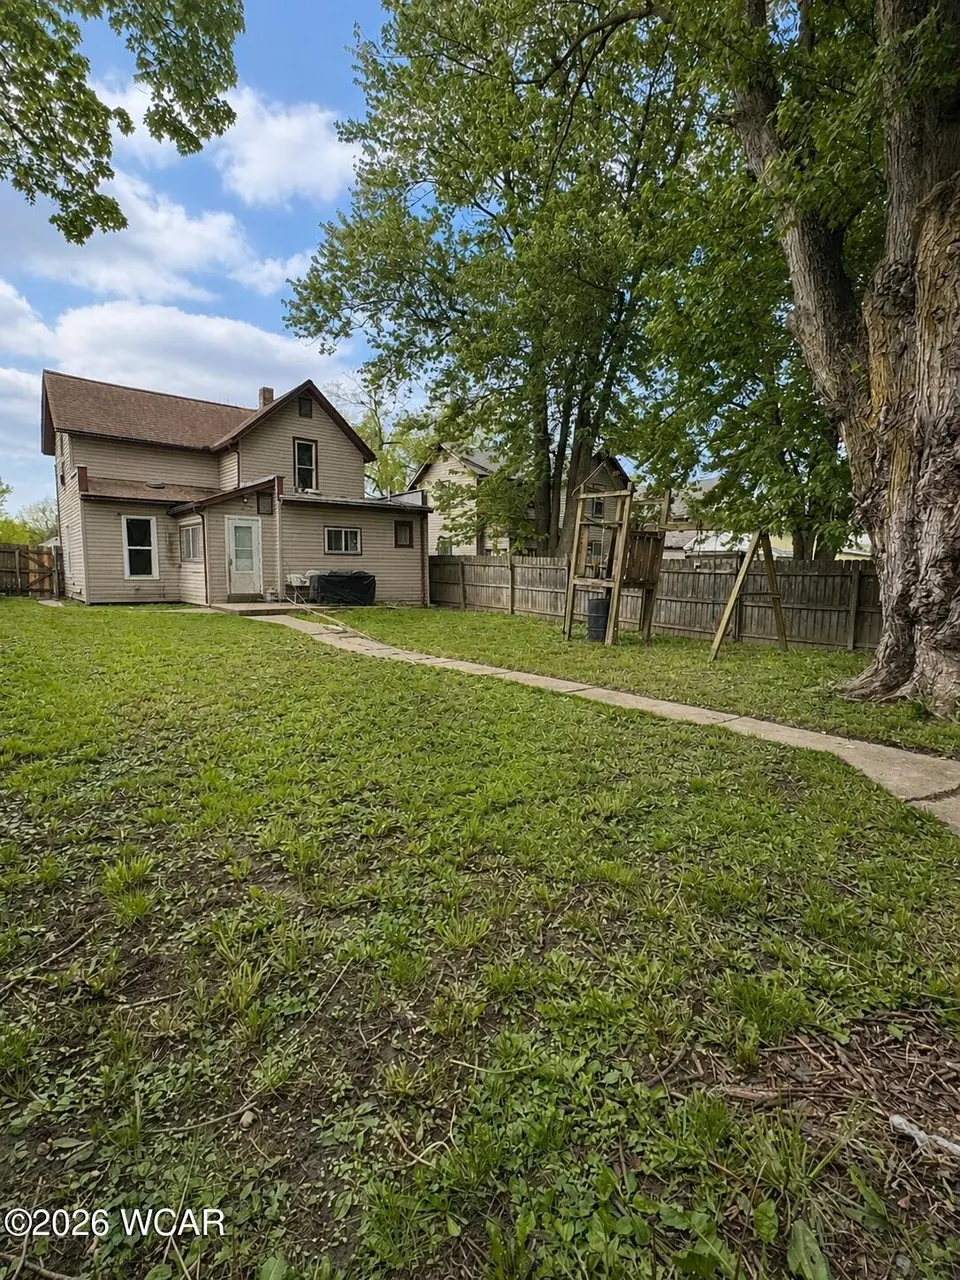
562 Wood St · Marion, OH
Flood risk 1/10 · Minimal
- FEMA flood zone
- X (unshaded)
- Chance of flooding over 30 yrs
- 0.0%
- Est. flood insurance / yr
- $507 – $1,088
Fire risk 1/10 · Minimal
- Est. fire insurance / yr
- $713 – $1,323
Heat risk 3/10 · Minor
- Hot days now (above 100°F)
- 7 days/yr
- Hot days in 30 yrs
- 18 days/yr
Wind risk 2/10 · Minimal
- Chance of severe wind over 30 yrs
- —
Air-quality risk 2/10 · Minimal
- Unhealthy air days now
- 1 days/yr
- Unhealthy air days in 30 yrs
- 1 days/yr
Risk factors via First Street. Map © Google.
Why this score? — see what drove the B- grade
The composite is a weighted blend of 9 inputs, each scored 0–100. Each bar is that input's sub-score; the figure is the points it added to the 100-point composite (weight × sub-score).
- Cash flow +30.0/30.0
- 1% rule +10.0/10.0
- DSCR +10.0/10.0
- ARV discount +6.6/15.0
- Livability +3.2/5.0
- Rent growth +2.5/5.0
- Condition / age +2.5/5.0
- Schools +2.2/10.0
- Appreciation +0.0/10.0
$78,000
🖨 Deal sheet 📄 Offer letter ✓ Due diligence
Listing remarks
Motivated sellers, and tons of updates complete!! Currently configured as a 2 bedroom, 1.5 bath home, with a spacious third room on the main level that offers excellent potential for a third bedroom, or bonus space - ideal for maximizing space and your investment. Additionally, this home features 200-amp electrical upgrade, extensive rewiring, and professionally reframed and levelled flooring with durable luxury vinyl plank throughout main living areas. Recessed lighting with custom 'theater mode', multiple dedicated circuits, and full kitchen pre-wiring add flexibility and value. One upstairs bedroom is fully finished, while remaining spaced are prepped. Newer water heater and addition
Key facts
- Custom theater mode
- Spacious third room
- Recessed lighting
Tags
Property features AI
Exterior
- Parking: Detached garage; 2 garage spaces; Parking pad
- Utilities: Public water; Public sewer
- Home design: Single-family residence; Residential property
- Exterior features: Residential zoning
Interior
- Bathrooms: 1 full bathroom; 1 half bathroom
- Interior features: 9 total rooms; Central air; Natural gas heating
Neighborhood map
What this means for you Summary
Snapshot
- This is a 2-bed/1.0-bath single-family listed at $78k.
Deal economics
- At list price, monthly cash flow is $526 ($6k/yr) — positive.
- The deal already cash-flows at list — no discount required.
- Meets the 1% rule at list price ($1k rent vs $78k).
- Recommended offer: $76k (3.0% below list) — sets the bar for market timing.
- Cap rate 14.4% vs local median 6.9% in Marion — top-decile yield for the area; either an underpriced asset or a hidden risk that comps aren't pricing in. Stress-test before assuming the spread holds.
Location & tenants
- Location reads 65/100 on livability (#704 in OH) — a middle-class / working-renter tenant base. Strengths: cost of living A+, housing A+; Watch: schools D+, crime D+, amenities F.
- Marion City (town): math 22% / reading 31% proficiency, ranked #600 of 656 in OH (top 92%) — low school quality limits family demand, transient renter base, plan for 1-2y turnover; 67% free/reduced lunch — lower-income household profile, screen leases tightly.
- Market conditions: 210 active listings in the ZIP; 53 units permitted in Marion County in 2024 (0 in 5+ unit buildings).
Forward outlook
- Local home prices are declining (-3.0%/yr); year-one equity from $539 of loan paydown is wiped out by about $2k of value loss. Plan a longer hold.
- Marion County population projected at -18% by 2050 — secular population decline; favor cash flow + early exit over multi-decade hold.
- At projected returns (-3.0% appreciation + 3.0% rent growth), your $22k cash investment doubles in ~5 years — after that, you're playing with house money.
Negotiation context
- It's been on market 47 days — a 3% lower offer ($76k) is reasonable based on typical stale-listing flexibility.
Risks & watch-outs
- Watch-outs: built in 1900 — expect roof / HVAC / electrical / plumbing capex.
Questions for the listing agent
- It's been on market 47 days. Have you received any prior offers? Is the seller open to a 3% concession, seller financing, or rate buy-down credit?
- Built in 1900 — when were the roof, HVAC, electrical panel, plumbing, and water heater last replaced?
- Is there a deadline driving the sale (1031 exchange, divorce, estate, relocation)? That informs how much negotiation room exists.
- Schools are D-rated, which usually means shorter tenancies and higher turnover. Who's the typical renter profile here, and what's been the actual vacancy rate?
- Crime grade is D in this area — have there been break-ins, vandalism, or insurance claims at this property in the last 3 years? What carrier currently insures it and at what premium?
- What's the average days-on-market for RENTAL listings here right now (not sales)? A rising rental-DOM trend means longer vacancies and softer asking-rent achievability than the comps imply.
- What's the recent tenant-quality profile in this submarket — average credit score on applications, eviction rate, late-payment / NSF rate, and stable-employment percentage? A property-management company in the area should have these aggregated.
- How much new for-sale + rental construction is in the pipeline within 1–3 miles? Heavy new supply typically softens prices + rents 12–24 months out; constrained supply supports both.
Investment metrics
- 1% rule
- 1.67% ✓
- Cap rate
- 14.38%
- Cash-on-cash
- 28.88%
- DSCR
- 2.29
- GRM
- 5.0
CMA / ARV
- ARV (median comp)
- $76,450
- List price
- $78,000
- Delta
- 2.03%
- Verdict
- FAIR
- Comps
- 20 within 1.0 mi
Show comp detail 12 sales within ~0.75 mi
| Address | Dist | Beds/Ba | Sqft | Sold | Price | $/sf | Match |
|---|---|---|---|---|---|---|---|
| 447 Olney Ave | 0.18mi | 3/1.0 (+1) | 1,464 (-1%) | 3mo | $175,900 | $120 | 82 |
| 426 Bellefontaine Ave | 0.37mi | 3/1.5 (+1) | 1,510 (+2%) | 4mo | $95,000 | $63 | 69 |
| 564 Uncapher Ave | 0.33mi | 3/1.0 (+1) | 1,358 (-8%) | 0mo | $155,000 | $114 | 66 |
| 602 Uncapher Ave | 0.37mi | 2/1.5 | 1,340 (-9%) | 3mo | $145,000 | $108 | 62 |
| 618 Blaine Ave | 0.43mi | 3/1.0 (+1) | 1,376 (-7%) | 3mo | $101,000 | $73 | 61 |
| 373 W Church St | 0.39mi | 3/1.5 (+1) | 1,354 (-8%) | 1mo | $84,000 | $62 | 60 |
| 314 Windsor St | 0.34mi | 3/1.0 (+1) | 1,323 (-10%) | 4mo | $120,000 | $91 | 58 |
| 210 Leader St | 0.59mi | 3/3.0 (+1) | 1,495 (+1%) | 1mo | $35,000 | $23 | 57 |
| 618 Irey Ave | 0.72mi | 3/1.0 (+1) | 1,426 (-4%) | 0mo | $125,000 | $88 | 55 |
| 340 Marion Ave | 0.56mi | 3/1.0 (+1) | 1,609 (+9%) | 2mo | $178,350 | $111 | 52 |
| 780 Sheridan Rd | 0.73mi | 3/1.0 (+1) | 1,388 (-6%) | 2mo | $90,000 | $65 | 49 |
| 552 Cherry St | 0.46mi | 3/1.0 (+1) | 1,686 (+14%) | 3mo | $140,000 | $83 | 48 |
Match score weights: distance 35% · size 25% · config 20% · recency 20%. Top-matched comps best support the ARV.
Projected returns pro-forma
-3.0% appreciation · 3.0% rent growth · sell at horizon
- IRR
- 23.2%
- Equity multiple
- 1.95×
- Total profit
- $20,834
- Equity at exit
- $11,630
- IRR
- 31.2%
- Equity multiple
- 3.80×
- Total profit
- $61,234
- Equity at exit
- $6,744
Cash invested: $21,840 (down + closing). Projections, not guarantees.
Landlord ↔ Tenant lean methodology
- Overall (STATE)
- 73 Landlord-Friendly
- State Ohio
- 73 Landlord-Friendly · R+6
- County
- — inherits STATE
- City
- — inherits STATE
ZIP-level market 43302
- Home prices YoY
- -33.9%
- Active inventory
- 210
- Price-to-rent
- 5.0×
Monthly cashflow live
- Estimated rent
- $1,299 medium interval (Pro) →
- Mortgage (P&I)
- −$409
- Tax from tax record
- −$59 /mo · $709/yr
- Insurance
- −$32
- HOA
- −$0
- Vacancy / Maint / Mgmt
- −$273
- Net cashflow
- $526
Break-even live
UW: 25.0% down · 7.5% · 30yr · 1.5% tax · 5.0% vac · 8.0% maint · 8.0% mgmt
Financing live
Cash to close
- Down payment
- $19,500
- Closing costs
- $2,340
- Reserves months
- —
- Total cash needed
- —
Loan-product check · same deal, 3 products live
Conventional
25% down · 7.5% · 30yr
- Down + closing
- —
- Monthly P&I
- —
- Monthly cashflow
- —
- DSCR
- —
- Eligible?
- —
Personal DTI + credit; lowest rate.
DSCR
20% down · 8.5% · 30yr
- Down + closing
- —
- Monthly P&I
- —
- Monthly cashflow
- —
- DSCR
- —
- Eligible?
- —
No personal income docs; deal must DSCR.
Hard money
10% down · 12.0% · 12mo
- Down + closing
- —
- Monthly P&I
- —
- Monthly cashflow
- —
- DSCR
- —
- Eligible?
- —
Short-term bridge; refi at stabilization.
Listing history 18 events
-
2026-06-19days on market $78,000 Active 47 DOM
-
2026-06-18days on market $78,000 Active 46 DOM
-
2026-06-17days on market $78,000 Active 45 DOM
-
2026-06-16days on market $78,000 Active 44 DOM
-
2026-06-15days on market $78,000 Active 43 DOM
-
2026-06-14days on market $78,000 Active 41 DOM
-
2026-06-12days on market $78,000 Active 40 DOM
-
2026-06-09days on market $78,000 Active 37 DOM
-
2026-06-08days on market $78,000 Active 36 DOM
-
2026-06-07days on market $78,000 Active 35 DOM
-
2026-06-05days on market $78,000 Active 32 DOM
-
2026-06-03days on market $78,000 Active 31 DOM
-
2026-06-02days on market $78,000 Active 30 DOM
-
2026-06-01days on market $78,000 Active 29 DOM
-
2026-05-31days on market $78,000 Active 28 DOM
-
2026-05-30days on market $78,000 Active 27 DOM
-
2026-05-10price $80,000 906-char remark
-
2026-05-03$95,000 Active 906-char remark
ⓘ Source: listings_history table (triggers on properties + properties_extension) + one-shot
backfill from property_details.listing_events for pre-trigger history.
Tax reassessment forecast OH · Partial reset (capped growth)
- Current annual tax
- $709 · $59/mo
- Projected year-2 tax
- $963 · $80/mo
- Expected delta
- +$254/yr (+$21/mo · 35.8%)
ⓘ Screening estimate from a state-policy table — verify with the county assessor before closing.
Climate risk First Street
- Flood 1/10 Low FEMA zone X (unshaded) · 0% chance over 30 yrs
- Wildfire 1/10 Low
- Heat 3/10 Moderate 7 d/yr ≥100°F today · 18 d/yr by 30 yrs out
- Wind 2/10 Low
- Air quality 2/10 Low 1 unhealthy d/yr today · 1 by 30 yrs out
Nearby sold comps map
Loading sold comps map…
Walkable amenities ~0.75 mi
Loading nearby amenities…
Taxation est. · year 1
- Rental income
- $15,588
- − Mortgage interest
- −$4,369
- − Property taxes
- −$709
- − Insurance
- −$390
- − Repairs & maintenance
- −$1,247
- − Management
- −$1,247
- − Depreciation
- −$2,269
- Taxable income
- $5,357
- Est. tax owed @ 24.0%
- −$1,286
- After-tax cash flow
- $5,022/yr
For passive investors: Depreciation is non-cash, so a rental often shows a tax loss while cash-flowing — sheltering income. Rental losses are passive: they offset passive income freely, and up to $25,000/yr can offset ordinary (W-2) income if you actively participate and your MAGI is under $100k (phasing out to $0 by $150k); unused losses carry forward. On sale, claimed depreciation is recaptured at up to 25%, and gains may owe capital-gains tax (a 1031 exchange can defer both). Figures are a year-1 estimate at your 24.0% rate — not tax advice; consult a CPA.
Schools (NCES district)
- District
- Marion City
- NCES district ID
- 3904433
- Math proficiency
- 22% ▼ -17.00%
- Reading proficiency
- 31% ▼ -8.00%
- Median HH income
- $32,327
- Composite
- 21.58/100
- National rank
- #8306
- State rank
- #600 of 656 in OH
Livability — Marion
- Score
- 65/100
- State rank
- #704
- US rank
- #12605
Category grades
Schools grade is shown separately in the Schools card above.
Census & demographics
- Census place
- Marion, OH
- County
- Marion County · 53,702 people
- City population
- 53,702
- Metro
- Marion, OH
- Population (ZIP)
- 53,702
- Household income
- $55,057
- Rent vs Own
- Severe rent burden
- 1554.0
Population outlook (Marion County) Hauer SSP2
- Today (2025)
- 62,078 people
- By 2030
- 60,049 · -3.3%
- By 2040
- 55,413 · -10.7%
- By 2050
- 50,604 · -18.5%
- By 2075
- 40,162 · -35.3%
- By 2100
- 29,105 · -53.1%
Race, ethnicity, and origin ACS 2023
- Neighborhood character
- Predominantly White (85%)
- Race & ethnicity
- White 85% Black 6% Two or more races 6% Hispanic / Latino 3%
- Common ancestry
- Slovak 2% Romanian 2% Lithuanian 2%
- Foreign-born
- 2% · Canada
- Languages at home
- 96% English-only · Spanish 2% Arabic 1%
Political lean MEDSL · Marion
- 2024 margin
- Solid R (+41.4) · D 28.9% · R 70.3%
- 2008→2024 swing
- -32.5pp toward R · 2008: -8.9pp · 2024: -41.4pp
- All cycles
- 2024: R+41.4 2020: R+38.6 2016: R+34.4 2012: R+7.6 2008: R+8.9
Not yet ingested
- Civics
- —
Market trends
- HPI YoY
- ▼ -114.52%
- Current HPI
- 223.5344
- Rent YoY
- —
- Metro
- Marion, OH
- State GDP YoY
- ▲ 1.98%
- F500 in state
- 48
Industry mix (Fortune 500 HQ in OH)
| Industry | F500 HQs | Revenue |
|---|---|---|
| Insurance | 3 | $145B |
|
||
| Industrial Machinery | 3 | $49B |
|
||
| Financial Services | 3 | $24B |
|
||
| Consumer Goods | 2 | $93B |
|
||
| Aerospace / Defense | 2 | $47B |
|
||
| Utilities | 2 | $33B |
|
||
Price history
-17.9% since first listed3 events — show timeline
- 2026-05-20 Price Changed $78,000 WCARE
- 2026-05-10 Price Changed $80,000 WCARE
- 2026-05-03 Listed $95,000 WCARE
Property tax history
+0.7%/yrLatest (2025): $709 · +0.0% YoY. Source: county tax records.
Cash-flow waterfall
monthlySold comps — $/sqft
last 12 mo · ≤1 miLoading sold comps…