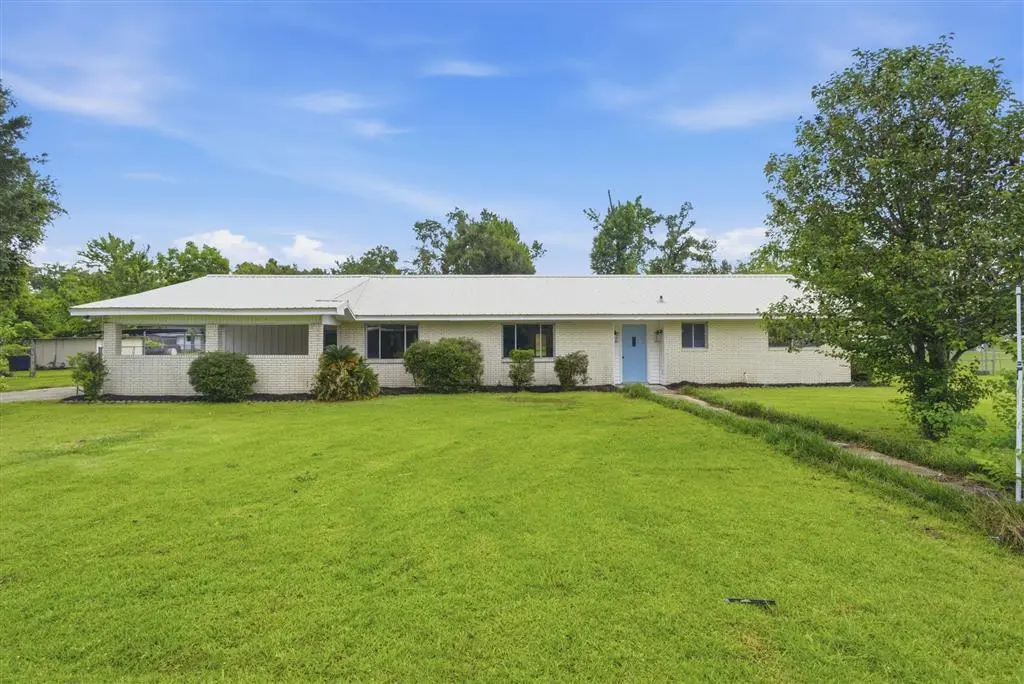
325 Noma Ln · Westlake, LA
Flood risk 1/10 · Minimal
- FEMA flood zone
- X (unshaded)
- Chance of flooding over 30 yrs
- 0.0%
- Est. flood insurance / yr
- $507 – $1,088
Fire risk 2/10 · Minimal
- Est. fire insurance / yr
- $1,269 – $2,357
Heat risk 9/10 · Severe
- Hot days now (above 109°F)
- 7 days/yr
- Hot days in 30 yrs
- 22 days/yr
Wind risk 9/10 · Severe
- Chance of severe wind over 30 yrs
- 99.0%
Air-quality risk 2/10 · Minimal
- Unhealthy air days now
- 1 days/yr
- Unhealthy air days in 30 yrs
- 1 days/yr
Risk factors via First Street. Map © Google.
Why this score? — see what drove the C grade
The composite is a weighted blend of 9 inputs, each scored 0–100. Each bar is that input's sub-score; the figure is the points it added to the 100-point composite (weight × sub-score).
- Cash flow +21.1/30.0
- ARV discount +15.0/15.0
- DSCR +6.7/10.0
- 1% rule +4.5/10.0
- Livability +3.3/5.0
- Schools +3.1/10.0
- Rent growth +2.5/5.0
- Condition / age +2.5/5.0
- Appreciation +0.0/10.0
$199,900
🖨 Deal sheet 📄 Offer letter ✓ Due diligence
Listing remarks
Remodeled 3-bed, 2.5-bath home on a generous 0.8-acre lot in a quiet neighborhood on a dead-end street. Home features two inviting living spaces and a huge bonus room, ideal for a 4th bedroom, playroom, or flex space. Enjoy a screened-in sunroom, outdoor patio, and a large fenced backyard perfect for entertaining or outdoor living. Inside, you’ll find abundant storage, a walk-in master closet, and a convenient double carport. Located in Flood Zone X, meaning no flood insurance required. A rare combination of space, updates, privacy, and functionality. Schedule a private showing soon. Owner/Agents
Key facts
- Two living spaces
- Huge bonus room
- Generous lot
Tags
Property features AI
Exterior
- Utilities: Public water; Aerobic septic; Electricity connected; Sewer connected; Water connected
- Home design: Single-family house; Single-story
- Exterior features: Front yard; Back yard; Landscaped lot; Lot dimensions approximately 186 x 179 x 210 x 171; Approximately 0.8 acres
Interior
- Bathrooms: 2 full bathrooms; 1 half bathroom
- Heating & cooling: Central heating; Central air conditioning; Ceiling fans
- Interior features: No fireplace
Neighborhood map
What this means for you Summary
Snapshot
- This is a 3-bed/2.5-bath single-family listed at $200k.
Deal economics
- At list price, monthly cash flow is $287 ($3k/yr) — positive.
- The deal already cash-flows at list — no discount required.
- To meet the 1% rule (rent ≥ 1% of price), the offer needs to be $190k (5.2% below list).
- Recommended offer: $190k (5.2% below list) — sets the bar for 1% rule.
- Cap rate 8.0% vs local median 6.4% in Westlake — meaningfully above typical; check what's discounted (condition, days-on-market, listing class) to confirm the premium yield is real.
Location & tenants
- Location reads 66/100 on livability (#120 in LA) — a middle-class / working-renter tenant base. Strengths: cost of living A+, housing A+, schools A; Watch: amenities F, commute F.
- Calcasieu Parish (other): math 30% / reading 44% proficiency, ranked #29 of 98 in LA (top 30%) — families likely to look elsewhere, expect single-tenant / working-renter base with shorter leases.
- Market conditions: 148 active listings in the ZIP; 2 comparable units currently listed for rent nearby; 1,298 units permitted in Calcasieu Parish in 2024 (526 in 5+ unit buildings).
- This rent runs 33% of the median local income ($69k/yr) — at the standard rent-burdened threshold; future hikes will face affordability resistance.
Forward outlook
- Local home prices are declining (-3.0%/yr); year-one equity from $1k of loan paydown is wiped out by about $6k of value loss. Plan a longer hold.
- Calcasieu County population projected at +11% by 2050 — modest demand growth; plan on rents tracking national, not racing it.
Negotiation context
- It's been on market 26 days — a 2% lower offer ($197k) is reasonable based on typical stale-listing flexibility.
- Current owner paid $87k; list at $200k implies a 130% gain — meaningful room to come down on a strong offer.
Risks & watch-outs
- Climate carrying-cost: severe wind risk, 99% chance of damaging wind over 30y; extreme-heat days projected 7→22/yr by 2055 (HVAC capex compounding) — expect insurance premiums to compound above CPI over the hold.
Questions for the listing agent
- Built in 1965 — when were the roof, HVAC, electrical panel, plumbing, and water heater last replaced?
- Is there a deadline driving the sale (1031 exchange, divorce, estate, relocation)? That informs how much negotiation room exists.
- Schools are A-rated — typically a magnet for longer-tenancy family renters. What's the average tenant stay here, and is there a school-zone premium baked into asking?
- What's the average days-on-market for RENTAL listings here right now (not sales)? A rising rental-DOM trend means longer vacancies and softer asking-rent achievability than the comps imply.
- What's the recent tenant-quality profile in this submarket — average credit score on applications, eviction rate, late-payment / NSF rate, and stable-employment percentage? A property-management company in the area should have these aggregated.
- How much new for-sale + rental construction is in the pipeline within 1–3 miles? Heavy new supply typically softens prices + rents 12–24 months out; constrained supply supports both.
Investment metrics
- 1% rule
- 0.95% ✗
- Cap rate
- 8.01%
- Cash-on-cash
- 6.14%
- DSCR
- 1.27
- GRM
- 8.8
CMA / ARV
- ARV (on-the-fly)
- $256,476
- Comps found
- 4
Show comp detail 4 sales within ~0.75 mi
| Address | Dist | Beds/Ba | Sqft | Sold | Price | $/sf | Match |
|---|---|---|---|---|---|---|---|
| 345 Fred Lutz Rd | 0.30mi | 3/2.0 | 2,205 (-0%) | 4mo | $255,000 | $116 | 80 |
| 130 Ruth St | 0.29mi | 3/2.0 | 1,938 (-12%) | 8mo | $127,000 | $66 | 57 |
| 2931 Hudson Dr | 0.56mi | 4/— (+1) | 1,978 (-10%) | 12mo | $224,900 | $114 | 41 |
| 2989 Davis Rd | 0.72mi | 3/2.0 | 1,896 (-14%) | 12mo | $360,000 | $190 | 31 |
Match score weights: distance 35% · size 25% · config 20% · recency 20%. Top-matched comps best support the ARV.
Projected returns pro-forma
-3.0% appreciation · 3.0% rent growth · sell at horizon
- IRR
- -6.9%
- Equity multiple
- 0.75×
- Total profit
- $-14,217
- Equity at exit
- $29,806
- IRR
- 2.7%
- Equity multiple
- 1.19×
- Total profit
- $10,813
- Equity at exit
- $17,284
Cash invested: $55,972 (down + closing). Projections, not guarantees.
Landlord ↔ Tenant lean methodology
- Overall (STATE)
- 90 Strongly Landlord-Friendly
- State Louisiana
- 90 Strongly Landlord-Friendly · R+12
- County
- — inherits STATE
- City
- — inherits STATE
ZIP-level market 70669
- Active inventory
- 148
- Price-to-rent
- 8.8×
Monthly cashflow live
- Estimated rent
- $1,896 medium interval (Pro) →
- Mortgage (P&I)
- −$1,048
- Tax from tax record
- −$79 /mo · $952/yr
- Insurance
- −$83
- HOA
- −$0
- Vacancy / Maint / Mgmt
- −$398
- Net cashflow
- $287
Break-even live
UW: 25.0% down · 7.5% · 30yr · 1.5% tax · 5.0% vac · 8.0% maint · 8.0% mgmt
Financing live
Cash to close
- Down payment
- $49,975
- Closing costs
- $5,997
- Reserves months
- —
- Total cash needed
- —
Loan-product check · same deal, 3 products live
Conventional
25% down · 7.5% · 30yr
- Down + closing
- —
- Monthly P&I
- —
- Monthly cashflow
- —
- DSCR
- —
- Eligible?
- —
Personal DTI + credit; lowest rate.
DSCR
20% down · 8.5% · 30yr
- Down + closing
- —
- Monthly P&I
- —
- Monthly cashflow
- —
- DSCR
- —
- Eligible?
- —
No personal income docs; deal must DSCR.
Hard money
10% down · 12.0% · 12mo
- Down + closing
- —
- Monthly P&I
- —
- Monthly cashflow
- —
- DSCR
- —
- Eligible?
- —
Short-term bridge; refi at stabilization.
Rent comps 2 comps
| Address | Beds | Baths | Sqft | Rent | $/sqft | DOM | Units | Dist |
|---|---|---|---|---|---|---|---|---|
| 1607 Matilda St Westlake, LA | 4.0 | 2.5 | 2120 | $4,300 | $2.03 | 44d | 1 | 1.08mi |
| 909 Wehrt St Westlake, LA | 4.0 | 2.0 | 1819 | $4,250 | $2.34 | 44d | 1 | 1.32mi |
Listing history 18 events
-
2026-06-17status $199,900 Pending 26 DOM
-
2026-06-17days on market $199,900 Active 26 DOM
-
2026-06-16days on market $199,900 Active 25 DOM
-
2026-06-15days on market $199,900 Active 24 DOM
-
2026-06-14days on market $199,900 Active 22 DOM
-
2026-06-13days on market $199,900 Active 21 DOM
-
2026-06-10days on market $199,900 Active 19 DOM
-
2026-06-09days on market $199,900 Active 18 DOM
-
2026-06-08days on market $199,900 Active 17 DOM
-
2026-06-07days on market $199,900 Active 16 DOM
-
2026-06-05days on market $199,900 Active 13 DOM
-
2026-06-02days on market $199,900 Active 11 DOM
-
2026-06-01days on market $199,900 Active 10 DOM
-
2026-05-31days on market $199,900 Active 9 DOM
-
2026-05-30days on market $199,900 Active 8 DOM
-
2026-05-22$199,900 Active
-
2026-02-20soldstatus $87,000
-
2002-02-06soldstatus $83,500
ⓘ Source: listings_history table (triggers on properties + properties_extension) + one-shot
backfill from property_details.listing_events for pre-trigger history.
Tax reassessment forecast LA · Resets to sale price
- Current annual tax
- $952 · $79/mo
- Projected year-2 tax
- $1,099 · $92/mo
- Expected delta
- +$147/yr (+$12/mo · 15.4%)
ⓘ Screening estimate from a state-policy table — verify with the county assessor before closing.
Climate risk First Street
- Flood 1/10 Low FEMA zone X (unshaded) · 0% chance over 30 yrs
- Wildfire 2/10 Low
- Heat 9/10 Extreme 7 d/yr ≥109°F today · 22 d/yr by 30 yrs out
- Wind 9/10 Extreme 99% chance of damaging wind over 30 yrs
- Air quality 2/10 Low 1 unhealthy d/yr today · 1 by 30 yrs out
Nearby sold comps map
Loading sold comps map…
Walkable amenities ~0.75 mi
Loading nearby amenities…
Taxation est. · year 1
- Rental income
- $22,747
- − Mortgage interest
- −$11,198
- − Property taxes
- −$952
- − Insurance
- −$1,000
- − Repairs & maintenance
- −$1,820
- − Management
- −$1,820
- − Depreciation
- −$5,815
- Taxable income
- $143
- Est. tax owed @ 24.0%
- −$34
- After-tax cash flow
- $3,405/yr
For passive investors: Depreciation is non-cash, so a rental often shows a tax loss while cash-flowing — sheltering income. Rental losses are passive: they offset passive income freely, and up to $25,000/yr can offset ordinary (W-2) income if you actively participate and your MAGI is under $100k (phasing out to $0 by $150k); unused losses carry forward. On sale, claimed depreciation is recaptured at up to 25%, and gains may owe capital-gains tax (a 1031 exchange can defer both). Figures are a year-1 estimate at your 24.0% rate — not tax advice; consult a CPA.
Schools (NCES district)
- District
- Calcasieu Parish
- NCES district ID
- 2200330
- Math proficiency
- 30% ▼ -39.00%
- Reading proficiency
- 44% ▼ -33.00%
- Median HH income
- $44,700
- Composite
- 31.45/100
- National rank
- #5979
- State rank
- #29 of 98 in LA
Livability — Westlake
- Score
- 66/100
- State rank
- #120
- US rank
- #11457
Category grades
Schools grade is shown separately in the Schools card above.
Census & demographics
- County
- Calcasieu Parish · 170,889 people
- City population
- 9,552
- Metro
- Lake Charles, LA
- Population (ZIP)
- 9,552
- Household income
- $69,106
- Rent vs Own
- Severe rent burden
- 178.0
Population outlook (Calcasieu County) Hauer SSP2
- Today (2025)
- 212,179 people
- By 2030
- 218,199 · +2.8%
- By 2040
- 228,486 · +7.7%
- By 2050
- 236,208 · +11.3%
- By 2075
- 251,696 · +18.6%
- By 2100
- 247,848 · +16.8%
Race, ethnicity, and origin ACS 2023
- Neighborhood character
- Predominantly White (82%)
- Race & ethnicity
- White 82% Black 9% Two or more races 4% Hispanic / Latino 4% Asian 3%
- Common ancestry
- Lithuanian 7% Serbian 2% Italian 1%
- Foreign-born
- 3% · Canada, South Korea
- Languages at home
- 93% English-only · Other Asian/Pacific 3% Spanish 2% French/Haitian/Cajun 1%
Political lean MEDSL · Calcasieu
- 2024 margin
- Solid R (+39.6) · D 29.5% · R 69.0% · Other 1.5%
- 2008→2024 swing
- -15.0pp toward R · 2008: -24.6pp · 2024: -39.6pp
- All cycles
- 2024: R+39.6 2020: R+35.2 2016: R+33.3 2012: R+28.7 2008: R+24.6
Not yet ingested
- Civics
- —
Market trends
- HPI YoY
- ▼ -107.45%
- Current HPI
- 81.9801
- Rent YoY
- —
- Metro
- Lake Charles, LA
- State GDP YoY
- ▲ 3.29%
- F500 in state
- 10
Industry mix (Fortune 500 HQ in LA)
| Industry | F500 HQs | Revenue |
|---|---|---|
| Telecommunications | 2 | $23B |
|
||
| Utilities | 1 | $12B |
|
||
| Wholesale / Distribution | 1 | $5B |
|
||
| Advertising | 1 | $2B |
|
||
Price history
+139.4% since first listed3 events — show timeline
- 2026-05-22 Listed $199,900 SWLAR
- 2026-02-20 Sold (Public Records) $87,000 Public Records
- 2002-02-06 Sold (Public Records) $83,500 Public Records
Property tax history
+0.1%/yrLatest (2025): $952 · +3.6% YoY. Source: county tax records.
Cash-flow waterfall
monthlySold comps — $/sqft
last 12 mo · ≤1 miLoading sold comps…