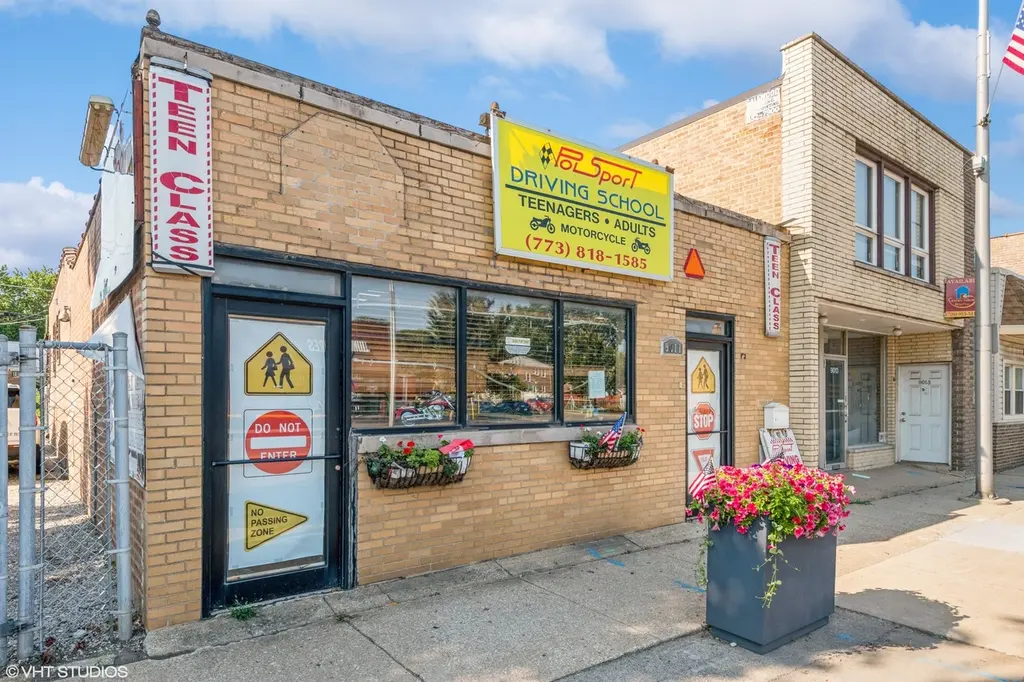
9011 Grand Ave · River Grove, IL
Flood risk 4/10 · Minor
- FEMA flood zone
- X (unshaded)
- Chance of flooding over 30 yrs
- 0.2%
- Est. flood insurance / yr
- $473 – $860
Fire risk 1/10 · Minimal
- Est. fire insurance / yr
- $804 – $1,492
Heat risk 3/10 · Minor
- Hot days now (above 100°F)
- 7 days/yr
- Hot days in 30 yrs
- 14 days/yr
Wind risk 2/10 · Minimal
- Chance of severe wind over 30 yrs
- 1.0%
Air-quality risk 4/10 · Minor
- Unhealthy air days now
- 6 days/yr
- Unhealthy air days in 30 yrs
- 7 days/yr
Risk factors via First Street. Map © Google.
Why this score? — see what drove the F grade
The composite is a weighted blend of 9 inputs, each scored 0–100. Each bar is that input's sub-score; the figure is the points it added to the 100-point composite (weight × sub-score).
- Cash flow +10.0/30.0
- ARV discount +7.5/15.0
- Livability +4.0/5.0
- DSCR +2.8/10.0
- 1% rule +2.7/10.0
- Rent growth +2.5/5.0
- Condition / age +2.5/5.0
- Schools +1.6/10.0
- Appreciation +0.0/10.0
$419,000
🖨 Deal sheet 📄 Offer letter ✓ Due diligence
Listing remarks
Envision a future where your home and your ambition thrive in perfect harmony. This property offers a compelling combination of residential comfort and an established commercial enterprise/0.1bath. For 20 years, a successful driving school has operated from this location, and the sellers are prepared to transfer this business opportunity to the buyer. They are also willing to provide guidance and training to help the new owner learn and take on the school if desired. The residential space features a two-bedroom, one-bathroom apartment that has been thoughtfully renovated with various updates over the years. The space features a room with a glass ceiling that offers unique potential for a ga
Key facts
- Furnace room
- Garden room
- Large basement
Tags
Property features AI
Finance
- Financial info: Annual taxes reported for 2023
Exterior
- Utilities: Electric service with circuit breakers
- Home design: Mixed-use property; Two-unit building; Built before 1978
- Construction: Brick construction; Concrete perimeter foundation
- Exterior features: City street frontage; 25 x 125 lot dimensions
Interior
- Kitchen: One range
- Heating & cooling: Forced air heating; Central air conditioning
- Interior features: Some photos are not virtually staged
- Laundry & utility: One washer; One dryer
Neighborhood map
What this means for you Summary
Snapshot
- This is a 2-bed/2.5-bath condo listed at $419k.
Deal economics
- At list price, monthly cash flow is $-255 ($-3k/yr) — negative.
- To cash-flow at today's rent, offer at most $374k (10.7% below list).
- To meet the 1% rule (rent ≥ 1% of price), the offer needs to be $323k (22.8% below list).
- Recommended offer: $323k (22.8% below list) — sets the bar for 1% rule.
Location & tenants
- Location reads 79/100 on livability (#123 in IL, #2,150 nationally) — a middle-class / working-renter tenant base. Strengths: commute A+, housing A+, crime A; Watch: schools D+, amenities D-.
- Leyden Chsd 212 (suburban): math 15% / reading 20% proficiency, ranked #451 of 620 in IL (top 73%) — low school quality limits family demand, transient renter base, plan for 1-2y turnover.
- Market conditions: 20 active listings in the ZIP; 23 comparable units currently listed for rent nearby; rentals at typical pace (median 24d on market — plan ~3-4 weeks tenant-placement turnaround); 6,272 units permitted in Cook County in 2024 (4,658 in 5+ unit buildings).
Forward outlook
- Local home prices are declining (-3.0%/yr); year-one equity from $3k of loan paydown is wiped out by about $13k of value loss. Plan a longer hold.
Negotiation context
- It's been on market 76 days — a 6% lower offer ($394k) is reasonable based on typical stale-listing flexibility.
- 5 sale attempts with the ask held roughly flat each time — persistent listings suggest the price (not the market) is what's stuck; bring a comps-based counter.
- Current owner paid $189k; list at $419k implies a 122% gain — meaningful room to come down on a strong offer.
Risks & watch-outs
- Watch-outs: built in 1951 — expect roof / HVAC / electrical / plumbing capex.
Questions for the listing agent
- What do current leases actually rent for vs. the listed asking? Can we see a recent rent roll and the last 12 months of T-12 income?
- It's been on market 76 days. Have you received any prior offers? Is the seller open to a 23% concession, seller financing, or rate buy-down credit?
- Built in 1951 — when were the roof, HVAC, electrical panel, plumbing, and water heater last replaced?
- Any open or pending special assessments — roof, HVAC, plumbing, elevator, façade? What's the per-unit balance and payoff schedule, and is the seller paying it off at close or rolling it to the buyer?
- Why hasn't it sold? Are there any deal-killer items the seller is aware of (foundation, flood, title, zoning, code violations)?
- Is there a deadline driving the sale (1031 exchange, divorce, estate, relocation)? That informs how much negotiation room exists.
- Schools are D-rated, which usually means shorter tenancies and higher turnover. Who's the typical renter profile here, and what's been the actual vacancy rate?
- The area grade is low — what's the realistic commute time and amenity access for the typical tenant pool here? Any planned neighborhood developments (good or bad) we should know about?
- What's the average days-on-market for RENTAL listings here right now (not sales)? A rising rental-DOM trend means longer vacancies and softer asking-rent achievability than the comps imply.
- What's the recent tenant-quality profile in this submarket — average credit score on applications, eviction rate, late-payment / NSF rate, and stable-employment percentage? A property-management company in the area should have these aggregated.
- How much new apartment / multifamily construction is in the pipeline within 1–3 miles? Heavy new supply (>2% of stock underway) typically softens rents 12–24 months out; light construction supports rent growth.
Investment metrics
- 1% rule
- 0.77% ✗
- Cap rate
- 5.56%
- Cash-on-cash
- -2.61%
- DSCR
- 0.88
- GRM
- 10.8
CMA / ARV
No comps found within radius.
Projected returns pro-forma
-3.0% appreciation · 3.0% rent growth · sell at horizon
- IRR
- -20.6%
- Equity multiple
- 0.28×
- Total profit
- $-84,133
- Equity at exit
- $62,474
- IRR
- -13.9%
- Equity multiple
- 0.20×
- Total profit
- $-94,180
- Equity at exit
- $36,227
Cash invested: $117,320 (down + closing). Projections, not guarantees.
Landlord ↔ Tenant lean methodology
- Overall (STATE)
- 43 Moderately Tenant-Leaning
- State Illinois
- 43 Moderately Tenant-Leaning · D+7
- County
- — inherits STATE
- City
- — inherits STATE
ZIP-level market 60171
- Active inventory
- 20
- Price-to-rent
- 10.8×
Monthly cashflow live
- Estimated rent
- $3,234 high interval (Pro) →
- Mortgage (P&I)
- −$2,197
- Tax from tax record
- −$438 /mo · $5,256/yr
- Insurance
- −$175
- HOA
- −$0
- Vacancy / Maint / Mgmt
- −$679
- Net cashflow
- $-255
Break-even live
UW: 25.0% down · 7.5% · 30yr · 1.5% tax · 5.0% vac · 8.0% maint · 8.0% mgmt
Financing live
Cash to close
- Down payment
- $104,750
- Closing costs
- $12,570
- Reserves months
- —
- Total cash needed
- —
Loan-product check · same deal, 3 products live
Conventional
25% down · 7.5% · 30yr
- Down + closing
- —
- Monthly P&I
- —
- Monthly cashflow
- —
- DSCR
- —
- Eligible?
- —
Personal DTI + credit; lowest rate.
DSCR
20% down · 8.5% · 30yr
- Down + closing
- —
- Monthly P&I
- —
- Monthly cashflow
- —
- DSCR
- —
- Eligible?
- —
No personal income docs; deal must DSCR.
Hard money
10% down · 12.0% · 12mo
- Down + closing
- —
- Monthly P&I
- —
- Monthly cashflow
- —
- DSCR
- —
- Eligible?
- —
Short-term bridge; refi at stabilization.
Rent comps 23 comps
| Address | Beds | Baths | Sqft | Rent | $/sqft | DOM | Units | Dist |
|---|---|---|---|---|---|---|---|---|
| 2537 Willow St Franklin Park, IL | 3.0 | 2.0 | 1137 | $3,000 | $2.64 | 15d | 1 | 0.29mi |
| 2524 Grove St River Grove, IL | 3.0 | 3.0 | 1842 | $3,100 | $1.68 | 20d | 1 | 0.42mi |
| 8536 River Grove Ave River Grove, IL | 3.0 | 2.0 | 1424 | $3,100 | $2.18 | 14d | 1 | 0.58mi |
| 8471 W Grand Ave River Grove, IL | 2.0 | 2.0 | 1200 | $2,650 | $2.21 | 24d | 1 | 0.66mi |
| 9600 Franklin Ave Franklin Park, IL | 1.0–2.0 | 1.0–2.0 | 1104 | $2,698 | $2.44 | 24d | 2 | 0.91mi |
| 8212 W Walsh Ln Apt 1 River Grove, IL | 3.0 | 3.0 | 2200 | $2,600 | $1.18 | 2d | 1 | 1.11mi |
| 8040 Oconnor Dr Unit 110 River Grove, IL | 2.0 | 2.0 | 1234 | $3,195 | $2.59 | 24d | 1 | 1.25mi |
| 8040 Oconnor Dr Unit 305 River Grove, IL | 2.0 | 2.0 | 1234 | $3,340 | $2.71 | 24d | 1 | 1.25mi |
| 8040 Oconnor Dr Unit 205 River Grove, IL | 2.0 | 2.0 | 1234 | $3,240 | $2.63 | 24d | 1 | 1.26mi |
| 8040 Oconnor Dr #210 River Grove, IL | 2.0 | 2.0 | 1234 | $3,295 | $2.67 | 24d | 1 | 1.26mi |
| 8029 W Belmont Ave #202 River Grove, IL | 2.0 | 2.0 | 1236 | $2,950 | $2.39 | 24d | 1 | 1.31mi |
| 8020 Oconnor Dr #307 River Grove, IL | 2.0 | 2.0 | 1234 | $3,595 | $2.91 | 24d | 1 | 1.31mi |
| 8020 Oconnor Dr #305 River Grove, IL | 2.0 | 2.0 | 1234 | $3,450 | $2.80 | 24d | 1 | 1.31mi |
| 8020 Oconnor Dr #103 River Grove, IL | 2.0 | 2.0 | 1234 | $3,395 | $2.75 | 24d | 1 | 1.31mi |
| 8020 Oconnor Dr #101 River Grove, IL | 2.0 | 2.0 | 1234 | $3,350 | $2.71 | 24d | 1 | 1.31mi |
| 8020 Oconnor Dr #207 River Grove, IL | 2.0 | 2.0 | 1234 | $3,550 | $2.88 | 24d | 1 | 1.31mi |
| 8020 Oconnor Dr Unit 205 River Grove, IL | 2.0 | 2.0 | 1234 | $3,495 | $2.83 | 24d | 1 | 1.31mi |
| 8015 W Belmont Ave Unit 204 Chicago, IL | 3.0 | 2.0 | 1336 | $3,500 | $2.62 | 24d | 1 | 1.32mi |
| 8015 W Belmont Ave Unit 203 Chicago, IL | 3.0 | 2.0 | 1336 | $3,690 | $2.76 | 24d | 1 | 1.32mi |
| 3000 Cottonwood Ln River Grove, IL | 3.0–4.0 | 3.5 | 2159 | $4,800 | $2.22 | 1d | 7 | 1.32mi |
| 8000 Oconnor Dr River Grove, IL | 1.0–2.0 | 1.5–2.0 | 1167 | $3,340 | $2.86 | 1d | 1 | 1.33mi |
| 8003 W Belmont Ave Unit 303 Chicago, IL | 3.0 | 2.0 | 1336 | $3,450 | $2.58 | 24d | 1 | 1.37mi |
| 8001 Belmont Ave River Grove, IL | 1.0–3.0 | 1.0–3.0 | 1030 | $3,020 | $2.93 | 4d | 20 | 1.38mi |
HOA detail condo
- Monthly dues
- $0 · $0/yr
- Assessments
- None detected in remarks — confirm with the listing agent.
Listing history 25 events
-
2026-06-18days on market $419,000 Active 76 DOM
-
2026-06-17days on market $419,000 Active 75 DOM
-
2026-06-16days on market $419,000 Active 74 DOM
-
2026-06-15days on market $419,000 Active 73 DOM
-
2026-06-13days on market $419,000 Active 71 DOM
-
2026-06-09days on market $419,000 Active 67 DOM
-
2026-06-08days on market $419,000 Active 66 DOM
-
2026-06-07days on market $419,000 Active 65 DOM
-
2026-06-04days on market $419,000 Active 62 DOM
-
2026-06-03days on market $419,000 Active 61 DOM
-
2026-06-02days on market $419,000 Active 60 DOM
-
2026-06-01days on market $419,000 Active 59 DOM
-
2026-05-31days on market $419,000 Active 58 DOM
-
2026-04-03$419,000 Active
-
2026-04-03historical
-
2026-03-10price
-
2026-03-03status Active
-
2026-02-07historical Contingent - No Showings
-
2025-10-16Active
-
2025-10-16historical
-
2025-09-23Active
-
2025-09-23historical
-
2025-06-05Active
-
2005-07-05soldstatus $189,000
-
1991-05-24soldstatus $39,000
ⓘ Source: listings_history table (triggers on properties + properties_extension) + one-shot
backfill from property_details.listing_events for pre-trigger history.
Tax reassessment forecast IL · Partial reset (capped growth)
- Current annual tax
- $5,256 · $438/mo
- Projected year-2 tax
- $7,384 · $615/mo
- Expected delta
- +$2,128/yr (+$177/mo · 40.5%)
ⓘ Screening estimate from a state-policy table — verify with the county assessor before closing.
Climate risk First Street
- Flood 4/10 Moderate FEMA zone X (unshaded) · 20% chance over 30 yrs
- Wildfire 1/10 Low
- Heat 3/10 Moderate 7 d/yr ≥100°F today · 14 d/yr by 30 yrs out
- Wind 2/10 Low 100% chance of damaging wind over 30 yrs
- Air quality 4/10 Moderate 6 unhealthy d/yr today · 7 by 30 yrs out
Nearby sold comps map
Loading sold comps map…
Walkable amenities ~0.75 mi
Loading nearby amenities…
Taxation est. · year 1
- Rental income
- $38,810
- − Mortgage interest
- −$23,471
- − Property taxes
- −$5,256
- − Insurance
- −$2,095
- − Repairs & maintenance
- −$3,105
- − Management
- −$3,105
- − Depreciation
- −$12,189
- Taxable loss
- −$10,410
- Est. tax savings @ 24.0%
- +$2,498
- After-tax cash flow
- $-560/yr
For passive investors: Depreciation is non-cash, so a rental often shows a tax loss while cash-flowing — sheltering income. Rental losses are passive: they offset passive income freely, and up to $25,000/yr can offset ordinary (W-2) income if you actively participate and your MAGI is under $100k (phasing out to $0 by $150k); unused losses carry forward. On sale, claimed depreciation is recaptured at up to 25%, and gains may owe capital-gains tax (a 1031 exchange can defer both). Figures are a year-1 estimate at your 24.0% rate — not tax advice; consult a CPA.
Schools (NCES district)
- District
- Leyden Chsd 212
- NCES district ID
- 1722740
- Math proficiency
- 15% ▼ -12.00%
- Reading proficiency
- 20% ▼ -9.00%
- Median HH income
- $55,738
- Composite
- 16.37/100
- National rank
- #9200
- State rank
- #451 of 620 in IL
Livability — River Grove
- Score
- 79/100
- State rank
- #123
- US rank
- #2150
Category grades
Schools grade is shown separately in the Schools card above.
Census & demographics
- Census place
- River Grove, IL
- City population
- 10,482
- Population (ZIP)
- 10,482
Population outlook (Cook County) Hauer SSP2
- Today (2025)
- 5,347,519 people
- By 2030
- 5,357,703 · +0.2%
- By 2040
- 5,324,924 · -0.4%
- By 2050
- 5,230,762 · -2.2%
- By 2075
- 4,785,735 · -10.5%
- By 2100
- 4,188,836 · -21.7%
Race, ethnicity, and origin ACS 2023
- Neighborhood character
- Majority White (59%)
- Race & ethnicity
- White 59% Hispanic / Latino 37% Two or more races 6% Asian 4% Native American 3%
- Hispanic origin (detail)
- Mexican 16% Puerto Rican 14%
- Common ancestry
- Romanian 16% Subsaharan African 4% Danish 1%
- Foreign-born
- 25% · Canada, China
- Languages at home
- 53% English-only · Spanish 26% Russian/Polish/Slavic 15% Other Indo-European 2%
Political lean MEDSL · Cook
- 2024 margin
- Solid D (+42.0) · D 70.4% · R 28.4% · Other 1.2%
- 2008→2024 swing
- -11.4pp toward R · 2008: 53.4pp · 2024: 42.0pp
- All cycles
- 2024: D+42.0 2020: D+50.3 2016: D+53.0 2012: D+49.4 2008: D+53.4
Not yet ingested
- Civics
- —
Market trends
- HPI YoY
- ▼ -130.56%
- Current HPI
- 218.0332
- Rent YoY
- —
- Metro
- —
- State GDP YoY
- ▲ 1.59%
- F500 in state
- 60
Industry mix (Fortune 500 HQ in IL)
| Industry | F500 HQs | Revenue |
|---|---|---|
| Insurance | 4 | $201B |
|
||
| Consumer Goods | 4 | $87B |
|
||
| Industrial Machinery | 3 | $64B |
|
||
| Healthcare | 2 | $55B |
|
||
| Retail / Pharmacy | 1 | $148B |
|
||
| Agriculture / Food | 1 | $86B |
|
||
Price history
+974.4% since first listed12 events — show timeline
- 2026-04-03 Listing Removed — MRED as Distributed by MLS Grid
- 2026-04-03 Listed $419,000 MRED as Distributed by MLS Grid
- 2026-03-10 Price Changed — MRED as Distributed by MLS Grid
- 2026-03-03 Relisted — MRED as Distributed by MLS Grid
- 2026-02-07 Contingent — MRED as Distributed by MLS Grid
- 2025-10-16 Listing Removed — MRED as Distributed by MLS Grid
- 2025-10-16 Listed — MRED as Distributed by MLS Grid
- 2025-09-23 Listing Removed — MRED as Distributed by MLS Grid
- 2025-09-23 Listed — MRED as Distributed by MLS Grid
- 2025-06-05 Listed — MRED as Distributed by MLS Grid
- 2005-07-05 Sold (Public Records) $189,000 Public Records
- 1991-05-24 Sold (Public Records) $39,000 Public Records
Property tax history
+0.0%/yrLatest (2023): $5,256 · +2.5% YoY. Source: county tax records.
Cash-flow waterfall
monthlySold comps — $/sqft
last 12 mo · ≤1 miLoading sold comps…