 🏗️ New Construction
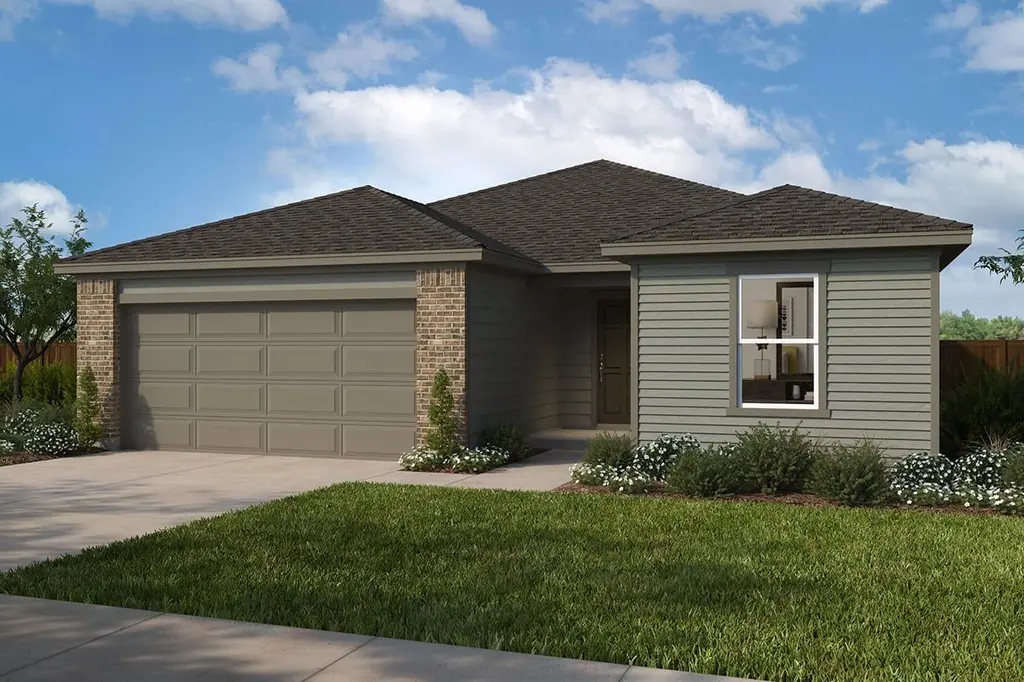
Plan 1793 Plan · Rosenberg, TX
Flood risk 4/10 · Minor
- FEMA flood zone
- X (unshaded)
- Chance of flooding over 30 yrs
- 0.22%
- Est. flood insurance / yr
- $507 – $1,088
Fire risk 2/10 · Minimal
- Est. fire insurance / yr
- $1,222 – $2,270
Heat risk 8/10 · Major
- Hot days now (above 111°F)
- 6 days/yr
- Hot days in 30 yrs
- 19 days/yr
Wind risk 9/10 · Severe
- Chance of severe wind over 30 yrs
- 99.0%
Air-quality risk 2/10 · Minimal
- Unhealthy air days now
- 1 days/yr
- Unhealthy air days in 30 yrs
- 1 days/yr
Risk factors via First Street. Map © Google.
Why this score? — see what drove the D- grade
The composite is a weighted blend of 9 inputs, each scored 0–100. Each bar is that input's sub-score; the figure is the points it added to the 100-point composite (weight × sub-score).
- ARV discount +7.5/15.0
- Cash flow +7.4/30.0
- Appreciation +7.1/10.0
- Schools +4.6/10.0
- Condition / age +3.8/5.0
- Livability +3.1/5.0
- Rent growth +2.5/5.0
- 1% rule +2.1/10.0
- DSCR +1.5/10.0
$222,995
🖨 Deal sheet 📄 Offer letter ✓ Due diligence
Listing remarks MLS
* Walk-in kitchen pantry * Open floor plan * Front porch * Extra storage space * 5-panel interior doors * Stainless steel appliances * Kitchen USB charging port * Granite kitchen countertops * Smart thermostat * WaterSense® labeled faucets * Low-E windows * ENERGY STAR® certified home * Near local schools * Great shopping nearby * Near entertainment and leisure * Pond * Pickleball court * Community park
Key facts
- Extra storage space
- Open floor plan
- Front porch
Tags
Neighborhood map
What this means for you Summary
Snapshot
- This is a 3-bed/2.0-bath single-family listed at $223k. Condition is rated good.
Deal economics
- At list price, monthly cash flow is $-341 ($-4k/yr) — negative.
- To cash-flow at today's rent, offer at most $214k (4.2% below list).
- To meet the 1% rule (rent ≥ 1% of price), the offer needs to be $187k (16.2% below list).
- Recommended offer: $187k (16.2% below list) — sets the bar for 1% rule.
- Cap rate 4.7% vs local median 3.4% in Rosenberg — top-decile yield for the area; either an underpriced asset or a hidden risk that comps aren't pricing in. Stress-test before assuming the spread holds.
Location & tenants
- Location reads 62/100 on livability (#922 in TX) — a middle-class / working-renter tenant base. Strengths: cost of living A+, housing A+, crime B; Watch: schools D-, amenities F, commute F.
- Lamar CISD (suburban): math 50% / reading 53% proficiency, ranked #116 of 826 in TX (top 14%) — acceptable for families but not a draw, mixed tenant base, ~2y average lease.
- Market conditions: 232 active listings in the ZIP; 12,093 units permitted in Fort Bend County in 2024 (815 in 5+ unit buildings).
Forward outlook
- In year one you build about $13k of equity ($2k loan paydown + $11k appreciation (4.2% local appreciation)).
- Fort Bend County population projected at +75% by 2050 — long-run rental-demand tailwind backs the buy-and-hold thesis.
- By year 3, paydown + projected appreciation supports a ~$32k cash-out refi (75% LTV) — recoverable capital for the next deal without selling this one.
Negotiation context
- It's been on market 209 days — a 12% lower offer ($196k) is reasonable based on typical stale-listing flexibility.
- 2 sale attempts; this cycle's ask has dropped $39k (15%) from the opening price — seller is motivated, your offer sets the floor, not the list.
Risks & watch-outs
- Climate carrying-cost: severe wind risk, 99% chance of damaging wind over 30y; extreme-heat days projected 6→19/yr by 2055 (HVAC capex compounding) — expect insurance premiums to compound above CPI over the hold.
Questions for the listing agent
- What do current leases actually rent for vs. the listed asking? Can we see a recent rent roll and the last 12 months of T-12 income?
- It's been on market 209 days. Have you received any prior offers? Is the seller open to a 16% concession, seller financing, or rate buy-down credit?
- Why hasn't it sold? Are there any deal-killer items the seller is aware of (foundation, flood, title, zoning, code violations)?
- Is there a deadline driving the sale (1031 exchange, divorce, estate, relocation)? That informs how much negotiation room exists.
- Schools are D-rated, which usually means shorter tenancies and higher turnover. Who's the typical renter profile here, and what's been the actual vacancy rate?
- The area grade is low — what's the realistic commute time and amenity access for the typical tenant pool here? Any planned neighborhood developments (good or bad) we should know about?
- What's the average days-on-market for RENTAL listings here right now (not sales)? A rising rental-DOM trend means longer vacancies and softer asking-rent achievability than the comps imply.
- What's the recent tenant-quality profile in this submarket — average credit score on applications, eviction rate, late-payment / NSF rate, and stable-employment percentage? A property-management company in the area should have these aggregated.
- How much new for-sale + rental construction is in the pipeline within 1–3 miles? Heavy new supply typically softens prices + rents 12–24 months out; constrained supply supports both.
Investment metrics
- 1% rule
- 0.71% ✗
- Cap rate
- 4.74%
- Cash-on-cash
- -5.55%
- DSCR
- 0.75
- GRM
- 11.7
CMA / ARV
- ARV (median comp)
- $263,028
- List price
- $222,995
- Delta
- -15.22%
- Verdict
- UNDERPRICED
- Comps
- 7 within 1.0 mi
Show comp detail 3 sales within ~0.75 mi
| Address | Dist | Beds/Ba | Sqft | Sold | Price | $/sf | Match |
|---|---|---|---|---|---|---|---|
| 7211 Saddle Crest Way | 0.10mi | 3/2.0 | 2,004 (+12%) | 1mo | $263,028 | $131 | 74 |
| 7214 Brooklea Rd | 0.09mi | 3/2.0 | 1,549 (-14%) | 1mo | $223,882 | $145 | 72 |
| 1811 Beasley West End Rd | 0.42mi | 3/2.0 | 1,991 (+11%) | 7mo | $378,500 | $190 | 56 |
Match score weights: distance 35% · size 25% · config 20% · recency 20%. Top-matched comps best support the ARV.
Projected returns pro-forma
4.15% appreciation · 3.0% rent growth · sell at horizon
- IRR
- 5.8%
- Equity multiple
- 1.36×
- Total profit
- $26,421
- Equity at exit
- $135,722
- IRR
- 8.4%
- Equity multiple
- 2.43×
- Total profit
- $105,268
- Equity at exit
- $223,890
Cash invested: $73,648 (down + closing). Projections, not guarantees.
Landlord ↔ Tenant lean methodology
- Overall (STATE)
- 87 Strongly Landlord-Friendly
- State Texas
- 87 Strongly Landlord-Friendly · R+5
- County
- — inherits STATE
- City
- — inherits STATE
ZIP-level market 77417
- Home prices YoY
- 1.2%
- Active inventory
- 232
- Price-to-rent
- 9.9×
Monthly cashflow live
- Estimated rent
- $1,870 medium interval (Pro) →
- Mortgage (P&I)
- −$1,379
- Tax est. 1.5%
- −$329 /mo · $3,945/yr
- Insurance
- −$110
- HOA
- −$0
- Vacancy / Maint / Mgmt
- −$393
- Net cashflow
- $-341
Break-even live
UW: 25.0% down · 7.5% · 30yr · 1.5% tax · 5.0% vac · 8.0% maint · 8.0% mgmt
Financing live
Cash to close
- Down payment
- $65,757
- Closing costs
- $7,891
- Reserves months
- —
- Total cash needed
- —
Loan-product check · same deal, 3 products live
Conventional
25% down · 7.5% · 30yr
- Down + closing
- —
- Monthly P&I
- —
- Monthly cashflow
- —
- DSCR
- —
- Eligible?
- —
Personal DTI + credit; lowest rate.
DSCR
20% down · 8.5% · 30yr
- Down + closing
- —
- Monthly P&I
- —
- Monthly cashflow
- —
- DSCR
- —
- Eligible?
- —
No personal income docs; deal must DSCR.
Hard money
10% down · 12.0% · 12mo
- Down + closing
- —
- Monthly P&I
- —
- Monthly cashflow
- —
- DSCR
- —
- Eligible?
- —
Short-term bridge; refi at stabilization.
Listing history 21 events
-
2026-06-18days on market $222,995 Active 209 DOM
-
2026-06-17days on market $222,995 Active 208 DOM
-
2026-06-16days on market $222,995 Active 207 DOM
-
2026-06-15days on market $222,995 Active 206 DOM
-
2026-06-13days on market $222,995 Active 204 DOM
-
2026-06-10days on market $222,995 Active 200 DOM
-
2026-06-08days on market $222,995 Active 199 DOM
-
2026-06-07days on market $222,995 Active 198 DOM
-
2026-06-04days on market $222,995 Active 195 DOM
-
2026-06-03days on market $222,995 Active 194 DOM
-
2026-06-02days on market $222,995 Active 193 DOM
-
2026-06-01days on market $222,995 Active 192 DOM
-
2026-05-31days on market $222,995 Active 191 DOM
-
2026-05-09price $222,995 449-char remark
Show marketing remark (449 chars)
* Walk-in kitchen pantry * Open floor plan * Front porch * Extra storage space * 5-panel interior doors * Stainless steel appliances * Kitchen USB charging port * Granite kitchen countertops * Smart thermostat * WaterSense® labeled faucets * Low-E windows * ENERGY STAR® certified home * Near local schools * Great shopping nearby * Near entertainment and leisure * Pond * Pickleball court * Community park
-
2026-04-01price $221,995 449-char remark
Show marketing remark (449 chars)
* Walk-in kitchen pantry * Open floor plan * Front porch * Extra storage space * 5-panel interior doors * Stainless steel appliances * Kitchen USB charging port * Granite kitchen countertops * Smart thermostat * WaterSense® labeled faucets * Low-E windows * ENERGY STAR® certified home * Near local schools * Great shopping nearby * Near entertainment and leisure * Pond * Pickleball court * Community park
-
2026-02-06price $231,995 449-char remark
Show marketing remark (449 chars)
* Walk-in kitchen pantry * Open floor plan * Front porch * Extra storage space * 5-panel interior doors * Stainless steel appliances * Kitchen USB charging port * Granite kitchen countertops * Smart thermostat * WaterSense® labeled faucets * Low-E windows * ENERGY STAR® certified home * Near local schools * Great shopping nearby * Near entertainment and leisure * Pond * Pickleball court * Community park
-
2025-12-12price $241,995 449-char remark
Show marketing remark (449 chars)
* Walk-in kitchen pantry * Open floor plan * Front porch * Extra storage space * 5-panel interior doors * Stainless steel appliances * Kitchen USB charging port * Granite kitchen countertops * Smart thermostat * WaterSense® labeled faucets * Low-E windows * ENERGY STAR® certified home * Near local schools * Great shopping nearby * Near entertainment and leisure * Pond * Pickleball court * Community park
-
2025-11-22status Active 449-char remark
Show marketing remark (449 chars)
* Walk-in kitchen pantry * Open floor plan * Front porch * Extra storage space * 5-panel interior doors * Stainless steel appliances * Kitchen USB charging port * Granite kitchen countertops * Smart thermostat * WaterSense® labeled faucets * Low-E windows * ENERGY STAR® certified home * Near local schools * Great shopping nearby * Near entertainment and leisure * Pond * Pickleball court * Community park
-
2025-11-22price $251,995 449-char remark
Show marketing remark (449 chars)
* Walk-in kitchen pantry * Open floor plan * Front porch * Extra storage space * 5-panel interior doors * Stainless steel appliances * Kitchen USB charging port * Granite kitchen countertops * Smart thermostat * WaterSense® labeled faucets * Low-E windows * ENERGY STAR® certified home * Near local schools * Great shopping nearby * Near entertainment and leisure * Pond * Pickleball court * Community park
-
2025-11-05historical 449-char remark
Show marketing remark (449 chars)
* Walk-in kitchen pantry * Open floor plan * Front porch * Extra storage space * 5-panel interior doors * Stainless steel appliances * Kitchen USB charging port * Granite kitchen countertops * Smart thermostat * WaterSense® labeled faucets * Low-E windows * ENERGY STAR® certified home * Near local schools * Great shopping nearby * Near entertainment and leisure * Pond * Pickleball court * Community park
-
2025-11-04$261,995 Active 449-char remark
Show marketing remark (449 chars)
* Walk-in kitchen pantry * Open floor plan * Front porch * Extra storage space * 5-panel interior doors * Stainless steel appliances * Kitchen USB charging port * Granite kitchen countertops * Smart thermostat * WaterSense® labeled faucets * Low-E windows * ENERGY STAR® certified home * Near local schools * Great shopping nearby * Near entertainment and leisure * Pond * Pickleball court * Community park
ⓘ Source: listings_history table (triggers on properties + properties_extension) + one-shot
backfill from property_details.listing_events for pre-trigger history.
Climate risk First Street
- Flood 4/10 Moderate FEMA zone X (unshaded) · 22% chance over 30 yrs
- Wildfire 2/10 Low
- Heat 8/10 Severe 6 d/yr ≥111°F today · 19 d/yr by 30 yrs out
- Wind 9/10 Extreme 99% chance of damaging wind over 30 yrs
- Air quality 2/10 Low 1 unhealthy d/yr today · 1 by 30 yrs out
Nearby sold comps map
Loading sold comps map…
Walkable amenities ~0.75 mi
Loading nearby amenities…
Taxation est. · year 1
- Rental income
- $22,436
- − Mortgage interest
- −$14,734
- − Property taxes
- −$3,945
- − Insurance
- −$1,315
- − Repairs & maintenance
- −$1,795
- − Management
- −$1,795
- − Depreciation
- −$7,652
- Taxable loss
- −$8,800
- Est. tax savings @ 24.0%
- +$2,112
- After-tax cash flow
- $-1,976/yr
For passive investors: Depreciation is non-cash, so a rental often shows a tax loss while cash-flowing — sheltering income. Rental losses are passive: they offset passive income freely, and up to $25,000/yr can offset ordinary (W-2) income if you actively participate and your MAGI is under $100k (phasing out to $0 by $150k); unused losses carry forward. On sale, claimed depreciation is recaptured at up to 25%, and gains may owe capital-gains tax (a 1031 exchange can defer both). Figures are a year-1 estimate at your 24.0% rate — not tax advice; consult a CPA.
Condition & rehab AI · 0 photos
This single-family home in Rosenberg, TX is in good condition with recent updates and a good condition score. It offers a good investment opportunity with potential for both resale and rental value through minor improvements.
Value-add opportunities
- Both Landscaping improvements — Enhances curb appeal and adds value
- Both Smart home security system — Improves safety and adds modern appeal
Renovation cost estimate screening
Value-add ROI direction
- Both Landscaping improvements — Enhances curb appeal and adds value ↑
- Both Smart home security system — Improves safety and adds modern appeal ↑
ⓘ Cost ranges are severity-bucket heuristics (US national rule-of-thumb). Get contractor quotes + a written scope before underwriting a rehab budget.
Schools (NCES district)
- District
- Lamar CISD
- NCES district ID
- 4826580
- Math proficiency
- 50% ▼ -12.00%
- Reading proficiency
- 53% ▼ -4.00%
- Median HH income
- $75,213
- Composite
- 46.43/100
- National rank
- #2452
- State rank
- #116 of 826 in TX
Livability — Rosenberg
- Score
- 62/100
- State rank
- #922
- US rank
- #16414
Category grades
Schools grade is shown separately in the Schools card above.
Census & demographics
- City population
- 115,151
- Population (ZIP)
- 3,232
Population outlook (Fort Bend County) Hauer SSP2
- Today (2025)
- 1,004,526 people
- By 2030
- 1,153,104 · +14.8%
- By 2040
- 1,453,718 · +44.7%
- By 2050
- 1,753,781 · +74.6%
- By 2075
- 2,455,772 · +144.5%
- By 2100
- 2,930,528 · +191.7%
Race, ethnicity, and origin ACS 2023
- Neighborhood character
- Predominantly Hispanic (67%)
- Race & ethnicity
- Hispanic / Latino 67% Two or more races 49% White 22% Black 8%
- Hispanic origin (detail)
- Mexican 54%
- Common ancestry
- Italian 2% Romanian 1%
- Foreign-born
- 3% · Canada
- Languages at home
- 76% English-only · Spanish 24%
Political lean MEDSL · Fort Bend
- 2024 margin
- Toss-up / Even · D 49.5% · R 47.9% · Other 2.6%
- 2008→2024 swing
- +4.0pp toward D · 2008: -2.4pp · 2024: 1.6pp
- All cycles
- 2024: D+1.6 2020: D+10.6 2016: D+6.6 2012: R+6.8 2008: R+2.4
Not yet ingested
- Civics
- —
Market trends
- HPI YoY
- ▲ 4.15%
- Current HPI
- 337.8236
- Rent YoY
- —
- Metro
- —
- State GDP YoY
- ▲ 3.95%
- F500 in state
- 110
Industry mix (Fortune 500 HQ in TX)
| Industry | F500 HQs | Revenue |
|---|---|---|
| Energy | 16 | $1,198B |
|
||
| Technology | 5 | $198B |
|
||
| Engineering / Construction | 4 | $72B |
|
||
| Energy Services | 3 | $60B |
|
||
| Utilities | 3 | $41B |
|
||
| Healthcare | 2 | $330B |
|
||
Price history
-14.9% since first listed8 events — show timeline
- 2026-05-09 Price Changed $222,995 Zillow
- 2026-04-01 Price Changed $221,995 Zillow
- 2026-02-06 Price Changed $231,995 Zillow
- 2025-12-12 Price Changed $241,995 Zillow
- 2025-11-22 Relisted — Zillow
- 2025-11-22 Price Changed $251,995 Zillow
- 2025-11-05 Delisted — Zillow
- 2025-11-04 Listed $261,995 Zillow
Cash-flow waterfall
monthlySold comps — $/sqft
last 12 mo · ≤1 miLoading sold comps…