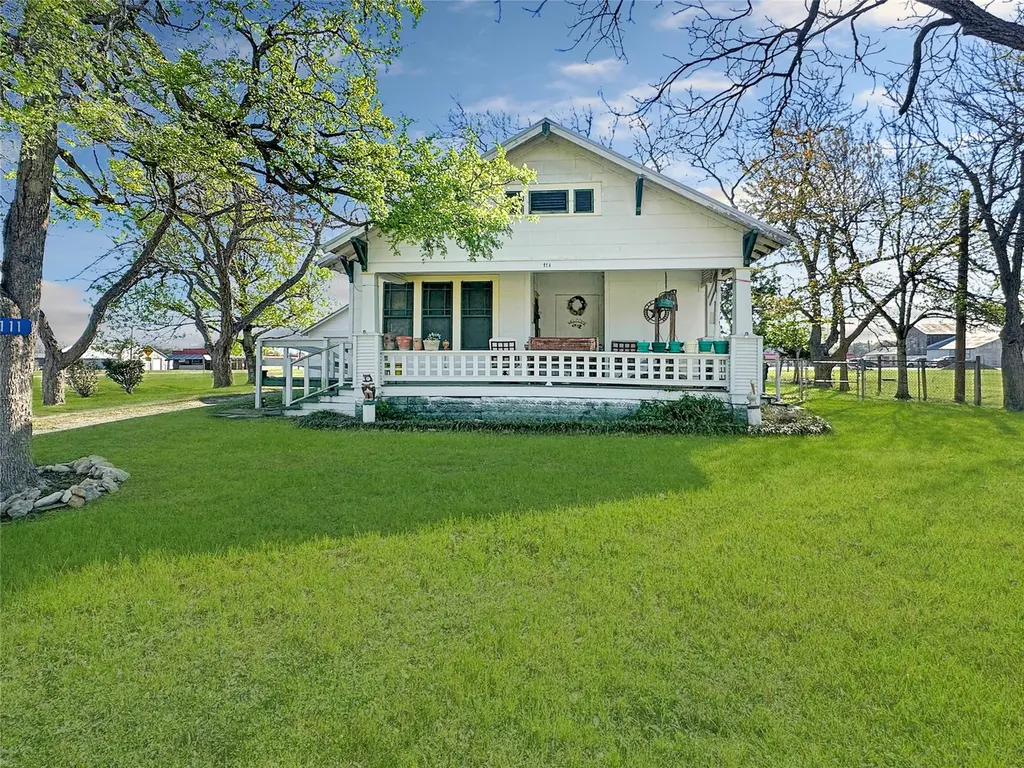
111 S Mill St · Flatonia, TX
Flood risk 1/10 · Minimal
- FEMA flood zone
- X (unshaded)
- Chance of flooding over 30 yrs
- 0.0%
- Est. flood insurance / yr
- $507 – $1,088
Fire risk 4/10 · Minor
- Est. fire insurance / yr
- $1,222 – $2,270
Heat risk 8/10 · Major
- Hot days now (above 108°F)
- 7 days/yr
- Hot days in 30 yrs
- 21 days/yr
Wind risk 8/10 · Major
- Chance of severe wind over 30 yrs
- 99.0%
Air-quality risk 1/10 · Minimal
- Unhealthy air days now
- 0 days/yr
- Unhealthy air days in 30 yrs
- 0 days/yr
Risk factors via First Street. Map © Google.
Why this score? — see what drove the C- grade
The composite is a weighted blend of 9 inputs, each scored 0–100. Each bar is that input's sub-score; the figure is the points it added to the 100-point composite (weight × sub-score).
- ARV discount +15.0/15.0
- Cash flow +11.1/30.0
- Appreciation +6.4/10.0
- Schools +5.4/10.0
- Livability +3.3/5.0
- DSCR +3.2/10.0
- 1% rule +2.8/10.0
- Rent growth +2.5/5.0
- Condition / age +2.5/5.0
$179,000
🖨 Deal sheet 📄 Offer letter ✓ Due diligence
Listing remarks MLS
Step into the warmth and character of this charming 100-year-old home in the heart of Flatonia. This inviting 2-bedroom, 1-bath residence showcases the craftsmanship of a bygone era with beautiful original wood floors throughout much of the home, soaring high ceilings, and an abundance of built-ins that add both charm and functionality.The home’s thoughtful layout highlights the historic details that make properties like this so special. The built-ins provide unique storage and character rarely found in newer homes.Outside, the property features a garage and morgan building with ample storage space—perfect for tools, hobbies, or extra workspace.If you appreciate classic architecture, timeless character, and the charm of small-town living, this historic Flatonia home is one you won’t want to miss.
Key facts
- Ample storage space
- Original wood floors
- Historic details
Tags
Neighborhood map
What this means for you Summary
Snapshot
- This is a 2-bed/1.0-bath single-family listed at $179k.
Deal economics
- At list price, monthly cash flow is $-73 ($-879/yr) — negative.
- To cash-flow at today's rent, offer at most $166k (7.2% below list).
- To meet the 1% rule (rent ≥ 1% of price), the offer needs to be $140k (21.8% below list).
- Recommended offer: $140k (21.8% below list) — sets the bar for 1% rule.
- Cap rate 5.8% vs local median 2.7% in Flatonia — top-decile yield for the area; either an underpriced asset or a hidden risk that comps aren't pricing in. Stress-test before assuming the spread holds.
Location & tenants
- Location reads 66/100 on livability (#599 in TX) — a middle-class / working-renter tenant base. Strengths: cost of living A+, housing A+, employment B+; Watch: schools D+, amenities F, commute F.
- Flatonia ISD (rural): math 69% / reading 60% proficiency, ranked #43 of 826 in TX (top 5%) — acceptable for families but not a draw, mixed tenant base, ~2y average lease.
- Market conditions: 79 active listings in the ZIP; 1 comparable units currently listed for rent nearby; 23 units permitted in Fayette County in 2024 (0 in 5+ unit buildings).
Forward outlook
- In year one you build about $6k of equity ($1k loan paydown + $5k appreciation (2.8% local appreciation)).
- Fayette County population projected at +9% by 2050 — modest demand growth; plan on rents tracking national, not racing it.
- At projected returns (2.8% appreciation + 3.0% rent growth), your $50k cash investment doubles in ~7 years — after that, you're playing with house money.
- By year 6, paydown + projected appreciation supports a ~$33k cash-out refi (75% LTV) — recoverable capital for the next deal without selling this one.
Negotiation context
- It's been on market 87 days — a 6% lower offer ($168k) is reasonable based on typical stale-listing flexibility.
- 2 sale attempts with the ask held roughly flat each time — persistent listings suggest the price (not the market) is what's stuck; bring a comps-based counter.
- Current owner paid $40k; list at $179k implies a 348% gain — meaningful room to come down on a strong offer.
Risks & watch-outs
- Watch-outs: built in 1930 — expect roof / HVAC / electrical / plumbing capex.
- Climate carrying-cost: severe wind risk, 99% chance of damaging wind over 30y; extreme-heat days projected 7→21/yr by 2055 (HVAC capex compounding) — expect insurance premiums to compound above CPI over the hold.
Questions for the listing agent
- What do current leases actually rent for vs. the listed asking? Can we see a recent rent roll and the last 12 months of T-12 income?
- It's been on market 87 days. Have you received any prior offers? Is the seller open to a 22% concession, seller financing, or rate buy-down credit?
- Built in 1930 — when were the roof, HVAC, electrical panel, plumbing, and water heater last replaced?
- Why hasn't it sold? Are there any deal-killer items the seller is aware of (foundation, flood, title, zoning, code violations)?
- Is there a deadline driving the sale (1031 exchange, divorce, estate, relocation)? That informs how much negotiation room exists.
- Schools are D-rated, which usually means shorter tenancies and higher turnover. Who's the typical renter profile here, and what's been the actual vacancy rate?
- What's the average days-on-market for RENTAL listings here right now (not sales)? A rising rental-DOM trend means longer vacancies and softer asking-rent achievability than the comps imply.
- What's the recent tenant-quality profile in this submarket — average credit score on applications, eviction rate, late-payment / NSF rate, and stable-employment percentage? A property-management company in the area should have these aggregated.
- How much new for-sale + rental construction is in the pipeline within 1–3 miles? Heavy new supply typically softens prices + rents 12–24 months out; constrained supply supports both.
Investment metrics
- 1% rule
- 0.78% ✗
- Cap rate
- 5.80%
- Cash-on-cash
- -1.75%
- DSCR
- 0.92
- GRM
- 10.7
CMA / ARV
- ARV (median comp)
- $218,638
- List price
- $179,000
- Delta
- -18.13%
- Verdict
- UNDERPRICED
- Comps
- 18 within 1.0 mi
Show comp detail 4 sales within ~0.75 mi
| Address | Dist | Beds/Ba | Sqft | Sold | Price | $/sf | Match |
|---|---|---|---|---|---|---|---|
| 210 E 5th St | 0.42mi | 3/1.0 (+1) | 1,404 (+4%) | 17mo | $215,000 | $153 | 54 |
| 402 N Penn St | 0.39mi | 3/2.0 (+1) | 1,280 (-5%) | 13mo | $225,000 | $176 | 54 |
| 320 E South Main St | 0.50mi | 3/1.5 (+1) | 1,431 (+6%) | 9mo | $170,000 | $119 | 52 |
| 118 N Converse St | 0.47mi | 2/2.0 | 1,204 (-11%) | 12mo | $150,000 | $125 | 46 |
Match score weights: distance 35% · size 25% · config 20% · recency 20%. Top-matched comps best support the ARV.
Projected returns pro-forma
2.81% appreciation · 3.0% rent growth · sell at horizon
- IRR
- 5.3%
- Equity multiple
- 1.30×
- Total profit
- $15,125
- Equity at exit
- $78,614
- IRR
- 8.4%
- Equity multiple
- 2.25×
- Total profit
- $62,591
- Equity at exit
- $119,718
Cash invested: $50,120 (down + closing). Projections, not guarantees.
Landlord ↔ Tenant lean methodology
- Overall (STATE)
- 87 Strongly Landlord-Friendly
- State Texas
- 87 Strongly Landlord-Friendly · R+5
- County
- — inherits STATE
- City
- — inherits STATE
ZIP-level market 78941
- Home prices YoY
- 1.2%
- Active inventory
- 79
- Price-to-rent
- 10.7×
Monthly cashflow live
- Estimated rent
- $1,400 medium interval (Pro) →
- Mortgage (P&I)
- −$939
- Tax from tax record
- −$166 /mo · $1,991/yr
- Insurance
- −$75
- HOA
- −$0
- Vacancy / Maint / Mgmt
- −$294
- Net cashflow
- $-73
Break-even live
UW: 25.0% down · 7.5% · 30yr · 1.5% tax · 5.0% vac · 8.0% maint · 8.0% mgmt
Financing live
Cash to close
- Down payment
- $44,750
- Closing costs
- $5,370
- Reserves months
- —
- Total cash needed
- —
Loan-product check · same deal, 3 products live
Conventional
25% down · 7.5% · 30yr
- Down + closing
- —
- Monthly P&I
- —
- Monthly cashflow
- —
- DSCR
- —
- Eligible?
- —
Personal DTI + credit; lowest rate.
DSCR
20% down · 8.5% · 30yr
- Down + closing
- —
- Monthly P&I
- —
- Monthly cashflow
- —
- DSCR
- —
- Eligible?
- —
No personal income docs; deal must DSCR.
Hard money
10% down · 12.0% · 12mo
- Down + closing
- —
- Monthly P&I
- —
- Monthly cashflow
- —
- DSCR
- —
- Eligible?
- —
Short-term bridge; refi at stabilization.
Rent comps 1 comps
| Address | Beds | Baths | Sqft | Rent | $/sqft | DOM | Units | Dist |
|---|---|---|---|---|---|---|---|---|
| 607 E 12th St Flatonia, TX | 2.0 | 1.0 | 900 | $1,400 | $1.56 | 43d | 1 | 0.82mi |
Listing history 13 events
-
2026-06-12statusdays on market $179,000 Pending 87 DOM
-
2026-06-09days on market $179,000 Active 85 DOM
-
2026-06-08days on market $179,000 Active 84 DOM
-
2026-06-08days on market $179,000 Active 83 DOM
-
2026-06-05days on market $179,000 Active 81 DOM
-
2026-06-03days on market $179,000 Active 79 DOM
-
2026-06-02days on market $179,000 Active 78 DOM
-
2026-06-01days on market $179,000 Active 77 DOM
-
2026-05-31days on market $179,000 Active 76 DOM
-
2026-03-16$179,000 Active 825-char remark
Show marketing remark (828 chars)
Step into the warmth and character of this charming 100-year-old home in the heart of Flatonia. This inviting 2-bedroom, 1-bath residence showcases the craftsmanship of a bygone era with beautiful original wood floors throughout much of the home, soaring high ceilings, and an abundance of built-ins that add both charm and functionality. The home’s thoughtful layout highlights the historic details that make properties like this so special. The built-ins provide unique storage and character rarely found in newer homes. Outside, the property features a garage and morgan building with ample storage space—perfect for tools, hobbies, or extra workspace. If you appreciate classic architecture, timeless character, and the charm of small-town living, this historic Flatonia home is one you won’t want to miss.
-
2026-03-16$179,000 Active 828-char remark
Show marketing remark (828 chars)
Step into the warmth and character of this charming 100-year-old home in the heart of Flatonia. This inviting 2-bedroom, 1-bath residence showcases the craftsmanship of a bygone era with beautiful original wood floors throughout much of the home, soaring high ceilings, and an abundance of built-ins that add both charm and functionality. The home’s thoughtful layout highlights the historic details that make properties like this so special. The built-ins provide unique storage and character rarely found in newer homes. Outside, the property features a garage and morgan building with ample storage space—perfect for tools, hobbies, or extra workspace. If you appreciate classic architecture, timeless character, and the charm of small-town living, this historic Flatonia home is one you won’t want to miss.
-
2017-03-24soldstatus
-
1999-07-27soldstatus $40,000
ⓘ Source: listings_history table (triggers on properties + properties_extension) + one-shot
backfill from property_details.listing_events for pre-trigger history.
Tax reassessment forecast TX · Resets to sale price
- Current annual tax
- $1,991 · $166/mo
- Projected year-2 tax
- $3,276 · $273/mo
- Expected delta
- +$1,284/yr (+$107/mo · 64.5%)
ⓘ Screening estimate from a state-policy table — verify with the county assessor before closing.
Climate risk First Street
- Flood 1/10 Low FEMA zone X (unshaded) · 0% chance over 30 yrs
- Wildfire 4/10 Moderate
- Heat 8/10 Severe 7 d/yr ≥108°F today · 21 d/yr by 30 yrs out
- Wind 8/10 Severe 99% chance of damaging wind over 30 yrs
- Air quality 1/10 Low 0 unhealthy d/yr today · 0 by 30 yrs out
Nearby sold comps map
Loading sold comps map…
Walkable amenities ~0.75 mi
Loading nearby amenities…
Taxation est. · year 1
- Rental income
- $16,800
- − Mortgage interest
- −$10,027
- − Property taxes
- −$1,991
- − Insurance
- −$895
- − Repairs & maintenance
- −$1,344
- − Management
- −$1,344
- − Depreciation
- −$5,207
- Taxable loss
- −$4,009
- Est. tax savings @ 24.0%
- +$962
- After-tax cash flow
- $83/yr
For passive investors: Depreciation is non-cash, so a rental often shows a tax loss while cash-flowing — sheltering income. Rental losses are passive: they offset passive income freely, and up to $25,000/yr can offset ordinary (W-2) income if you actively participate and your MAGI is under $100k (phasing out to $0 by $150k); unused losses carry forward. On sale, claimed depreciation is recaptured at up to 25%, and gains may owe capital-gains tax (a 1031 exchange can defer both). Figures are a year-1 estimate at your 24.0% rate — not tax advice; consult a CPA.
Schools (NCES district)
- District
- Flatonia ISD
- NCES district ID
- 4819280
- Math proficiency
- 69% ▼ -1.00%
- Reading proficiency
- 60% ▲ 2.00%
- Median HH income
- $45,018
- Composite
- 54.38/100
- National rank
- #1359
- State rank
- #43 of 826 in TX
Livability — Flatonia
- Score
- 66/100
- State rank
- #599
- US rank
- #11419
Category grades
Schools grade is shown separately in the Schools card above.
Census & demographics
- Census place
- Flatonia, TX
- Population (ZIP)
- 3,334
Population outlook (Fayette County) Hauer SSP2
- Today (2025)
- 26,343 people
- By 2030
- 26,940 · +2.3%
- By 2040
- 27,898 · +5.9%
- By 2050
- 28,623 · +8.7%
- By 2075
- 31,155 · +18.3%
- By 2100
- 31,557 · +19.8%
Race, ethnicity, and origin ACS 2023
- Neighborhood character
- Diverse neighborhood (Simpson 0.57)
- Race & ethnicity
- White 50% Hispanic / Latino 43% Two or more races 14% Black 3%
- Hispanic origin (detail)
- Mexican 43%
- Common ancestry
- Lithuanian 2% Slovak 1% Italian 1%
- Foreign-born
- 10% · Canada
- Languages at home
- 66% English-only · Spanish 32% Russian/Polish/Slavic 1% Chinese 1%
Political lean MEDSL · Fayette
- 2024 margin
- Solid R (+61.4) · D 18.9% · R 80.3%
- 2008→2024 swing
- -18.8pp toward R · 2008: -42.6pp · 2024: -61.4pp
- All cycles
- 2024: R+61.4 2020: R+58.0 2016: R+59.1 2012: R+54.9 2008: R+42.6
Not yet ingested
- Civics
- —
Market trends
- HPI YoY
- ▲ 2.81%
- Current HPI
- 228.938
- Rent YoY
- —
- Metro
- —
- State GDP YoY
- ▲ 3.95%
- F500 in state
- 110
Industry mix (Fortune 500 HQ in TX)
| Industry | F500 HQs | Revenue |
|---|---|---|
| Energy | 16 | $1,198B |
|
||
| Technology | 5 | $198B |
|
||
| Engineering / Construction | 4 | $72B |
|
||
| Energy Services | 3 | $60B |
|
||
| Utilities | 3 | $41B |
|
||
| Healthcare | 2 | $330B |
|
||
Price history
+347.5% since first listed4 events — show timeline
- 2026-03-16 Listed $179,000 CTXMLS
- 2026-03-16 Listed $179,000 HARMLS
- 2017-03-24 Sold (Public Records) — Public Records
- 1999-07-27 Sold (Public Records) $40,000 Public Records
Property tax history
+2.2%/yrLatest (2025): $1,991 · +8.7% YoY. Source: county tax records.
Cash-flow waterfall
monthlySold comps — $/sqft
last 12 mo · ≤1 miLoading sold comps…