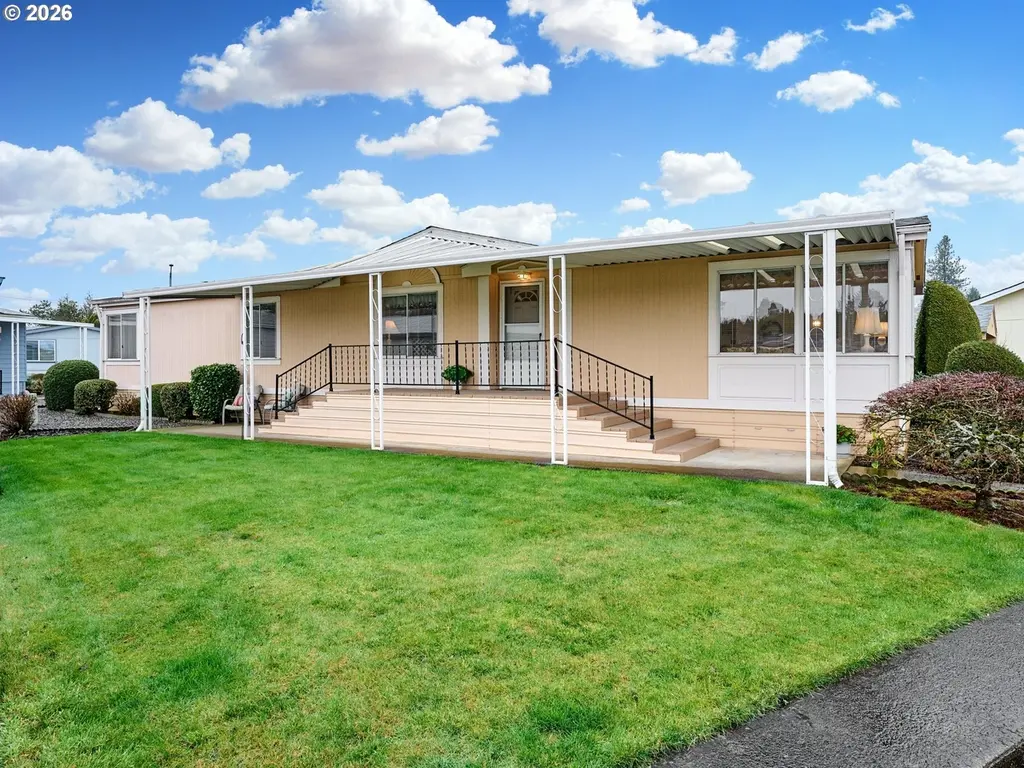
2410 Lancaster Dr SE #955 · Salem, OR
Flood risk 1/10 · Minimal
- FEMA flood zone
- X
- Chance of flooding over 30 yrs
- 0.0%
- Est. flood insurance / yr
- $435 – $905
Fire risk 1/10 · Minimal
- Est. fire insurance / yr
- $498 – $926
Heat risk 4/10 · Minor
- Hot days now (above threshold)
- 7 days/yr
- Hot days in 30 yrs
- 15 days/yr
Wind risk No data
- Chance of severe wind over 30 yrs
- —
Air-quality risk No data
- Unhealthy air days now
- —
- Unhealthy air days in 30 yrs
- —
Risk factors via First Street. Map © Google.
Why this score? — see what drove the C+ grade
The composite is a weighted blend of 9 inputs, each scored 0–100. Each bar is that input's sub-score; the figure is the points it added to the 100-point composite (weight × sub-score).
- Cash flow +30.0/30.0
- 1% rule +10.0/10.0
- DSCR +10.0/10.0
- Livability +4.0/5.0
- Schools +3.7/10.0
- Rent growth +3.2/5.0
- Condition / age +2.5/5.0
- ARV discount +0.0/15.0
- Appreciation +0.0/10.0
$119,000
🖨 Deal sheet 📄 Offer letter ✓ Due diligence
Listing remarks MLS
Welcome to this clean, spacious 1,822 sq ft manufactured home in the Sundial 55+ park community. With a generous open floor plan & thoughtful major updates that bring peace of mind— new roof (‘24), new heat pump/air conditioning, water heater & updated decking (all in ‘22)— this home offers comfort, functionality, & easy living. Inside you’ll find expansive natural light & a bright, inviting feel with a smooth flow between the kitchen, living, & dining rooms that’s perfect for both everyday life & life's most special gatherings. The covered porches & patio, front lawn, & storage shed provide great outdoor spaces for relaxing, visiting with friends & staying organized. Enjoy year-round comfort with central air conditioning & appreciate the accessibility of a wheelchair ramp from the generously sized carport. Beyond the home itself, the park amenities further set this property apart. Residents can enjoy an active & vibrant lifestyle with a swimming pool, hot tub, pickleball court, gym, dog park, billiard tables, & an impressive calendar of activities including live music, bunco, pinochle, cooking demos, fitness classes, potlucks, birthday parties & more. There’s always something to do & a welcoming community to be part of. Conveniently tucked in off of Lancaster Dr SE with easy access to shopping, dining, medical facilities & major roadways while still providing a quiet neighborhood setting. If you’re seeking a move-in ready home with valuable upgrades & outstanding amenities, this is one you won’t want to miss. Buyer to be approved by park management. More park information available upon request.
Key facts
- New furnace
- Covered porches
- New water heater
Tags
Neighborhood map
What this means for you Summary
Snapshot
- This is a 3-bed/2.0-bath manufactured listed at $119k.
Deal economics
- At list price, monthly cash flow is $972 ($12k/yr) — positive.
- The deal already cash-flows at list — no discount required.
- Meets the 1% rule at list price ($2k rent vs $119k).
- Recommended offer: $108k (9.0% below list) — sets the bar for market timing.
- Cap rate 16.1% vs local median 2.9% in Salem — top-decile yield for the area; either an underpriced asset or a hidden risk that comps aren't pricing in. Stress-test before assuming the spread holds.
Location & tenants
- Location reads 79/100 on livability (#59 in OR, #2,084 nationally) — a middle-class / working-renter tenant base. Strengths: amenities A+, commute A+, housing A+; Watch: schools D, crime F.
- Salem-Keizer SD 24J (urban): math 34% / reading 47% proficiency, ranked #103 of 183 in OR (top 56%) — families likely to look elsewhere, expect single-tenant / working-renter base with shorter leases.
- Market conditions: Rents rising (+2.6%/yr); 133 active listings in the ZIP; 3 comparable units currently listed for rent nearby; rentals lingering (median 44d on market — plan ~5-8 weeks vacancy on turnover, expect pricing pressure); 67% of comp listings sitting > 30 days — soft ceiling on asking rent; solid renter incomes; 1,591 units permitted in Marion County in 2024 (716 in 5+ unit buildings).
- This rent runs 32% of the median local income ($84k/yr) — at the standard rent-burdened threshold; future hikes will face affordability resistance.
Forward outlook
- Local home prices are declining (-3.0%/yr); year-one equity from $823 of loan paydown is wiped out by about $4k of value loss. Plan a longer hold.
- Marion County population projected at +17% by 2050 — long-run rental-demand tailwind backs the buy-and-hold thesis.
- At projected returns (-3.0% appreciation + 2.6% rent growth), your $33k cash investment doubles in ~4 years — after that, you're playing with house money.
Negotiation context
- It's been on market 112 days — a 9% lower offer ($108k) is reasonable based on typical stale-listing flexibility.
- 3 sale attempts since 22y ago; this cycle's ask has dropped $20k (14%) from the opening price — seller is motivated, your offer sets the floor, not the list.
- Current owner paid $65k; list at $119k implies a 83% gain — meaningful room to come down on a strong offer.
Questions for the listing agent
- It's been on market 112 days. Have you received any prior offers? Is the seller open to a 9% concession, seller financing, or rate buy-down credit?
- Why hasn't it sold? Are there any deal-killer items the seller is aware of (foundation, flood, title, zoning, code violations)?
- Is there a deadline driving the sale (1031 exchange, divorce, estate, relocation)? That informs how much negotiation room exists.
- Schools are D-rated, which usually means shorter tenancies and higher turnover. Who's the typical renter profile here, and what's been the actual vacancy rate?
- Crime grade is F in this area — have there been break-ins, vandalism, or insurance claims at this property in the last 3 years? What carrier currently insures it and at what premium?
- What's the average days-on-market for RENTAL listings here right now (not sales)? A rising rental-DOM trend means longer vacancies and softer asking-rent achievability than the comps imply.
- What's the recent tenant-quality profile in this submarket — average credit score on applications, eviction rate, late-payment / NSF rate, and stable-employment percentage? A property-management company in the area should have these aggregated.
- How much new for-sale + rental construction is in the pipeline within 1–3 miles? Heavy new supply typically softens prices + rents 12–24 months out; constrained supply supports both.
Investment metrics
- 1% rule
- 1.90% ✓
- Cap rate
- 16.10%
- Cash-on-cash
- 35.02%
- DSCR
- 2.56
- GRM
- 4.4
CMA / ARV
- ARV (median comp)
- $93,203
- List price
- $119,000
- Delta
- 27.68%
- Verdict
- OVERPRICED
- Comps
- 20 within 1.0 mi
Show comp detail 11 sales within ~0.75 mi
| Address | Dist | Beds/Ba | Sqft | Sold | Price | $/sf | Match |
|---|---|---|---|---|---|---|---|
| 4348 Essex St | 0.22mi | 2/2.0 (-1) | 1,880 (+3%) | 2mo | $35,000 | $19 | 78 |
| 2232 42nd Ave SE #807 | 0.20mi | 3/2.0 | 1,890 (+4%) | 20mo | $117,000 | $62 | 67 |
| 3100 Turner Rd SE #421 | 0.68mi | 3/2.0 | 1,746 (-4%) | 0mo | $260,000 | $149 | 61 |
| 4244 Eden St | 0.20mi | 3/2.0 | 1,566 (-14%) | 15mo | $92,500 | $59 | 55 |
| 3296 Turner Rd SE | 0.71mi | 3/2.0 | 1,782 (-2%) | 18mo | $120,000 | $67 | 48 |
| 3340 Turner Rd SE | 0.74mi | 3/2.0 | 1,620 (-11%) | 3mo | $128,000 | $79 | 44 |
| 3100 Turner (620) Rd SE | 0.67mi | 3/2.0 | 1,560 (-14%) | 1mo | $200,000 | $128 | 44 |
| 3100 Turner Rd SE #620 | 0.68mi | 3/2.0 | 1,560 (-14%) | 1mo | $200,000 | $128 | 43 |
| 3100 Turner Rd SE #101 | 0.68mi | 3/2.0 | 1,931 (+6%) | 22mo | $284,000 | $147 | 40 |
| 3210 Turner Rd SE | 0.65mi | 4/2.0 (+1) | 1,648 (-10%) | 14mo | $80,000 | $49 | 37 |
| 3100 Turner Rd SE #308 | 0.68mi | 2/2.0 (-1) | 1,620 (-11%) | 13mo | $255,000 | $157 | 34 |
Match score weights: distance 35% · size 25% · config 20% · recency 20%. Top-matched comps best support the ARV.
Projected returns pro-forma
-3.0% appreciation · 2.62% rent growth · sell at horizon
- IRR
- 30.1%
- Equity multiple
- 2.25×
- Total profit
- $41,816
- Equity at exit
- $17,743
- IRR
- 37.2%
- Equity multiple
- 4.38×
- Total profit
- $112,772
- Equity at exit
- $10,289
Cash invested: $33,320 (down + closing). Projections, not guarantees.
Landlord ↔ Tenant lean methodology
- Overall (STATE)
- 28 Tenant-Leaning
- State Oregon
- 28 Tenant-Leaning · D+6
- County
- — inherits STATE
- City
- — inherits STATE
ZIP-level market 97317
- Rents YoY
- 2.6%
- Active inventory
- 133
- Price-to-rent
- 4.4×
Monthly cashflow live
- Estimated rent
- $2,266 medium interval (Pro) →
- Mortgage (P&I)
- −$624
- Tax from tax record
- −$144 /mo · $1,733/yr
- Insurance
- −$50
- HOA
- −$0
- Vacancy / Maint / Mgmt
- −$476
- Net cashflow
- $972
Break-even live
UW: 25.0% down · 7.5% · 30yr · 1.5% tax · 5.0% vac · 8.0% maint · 8.0% mgmt
Financing live
Cash to close
- Down payment
- $29,750
- Closing costs
- $3,570
- Reserves months
- —
- Total cash needed
- —
Loan-product check · same deal, 3 products live
Conventional
25% down · 7.5% · 30yr
- Down + closing
- —
- Monthly P&I
- —
- Monthly cashflow
- —
- DSCR
- —
- Eligible?
- —
Personal DTI + credit; lowest rate.
DSCR
20% down · 8.5% · 30yr
- Down + closing
- —
- Monthly P&I
- —
- Monthly cashflow
- —
- DSCR
- —
- Eligible?
- —
No personal income docs; deal must DSCR.
Hard money
10% down · 12.0% · 12mo
- Down + closing
- —
- Monthly P&I
- —
- Monthly cashflow
- —
- DSCR
- —
- Eligible?
- —
Short-term bridge; refi at stabilization.
Rent comps 3 comps
| Address | Beds | Baths | Sqft | Rent | $/sqft | DOM | Units | Dist |
|---|---|---|---|---|---|---|---|---|
| 1447 Connecticut St SE Salem, OR | 3.0 | 2.0 | 1258 | $2,675 | $2.13 | 43d | 1 | 0.55mi |
| 4776 Buffalo Dr SE Salem, OR | 3.0 | 1.0 | 1369 | $2,150 | $1.57 | 43d | 1 | 1.02mi |
| 3897 Meadowlawn Loop SE Salem, OR | 1.0–3.0 | 1.0–2.0 | 962 | $1,958 | $2.03 | 14d | 26 | 1.26mi |
Listing history 21 events
-
2026-06-18days on market $119,000 Active 112 DOM
-
2026-06-17days on market $119,000 Active 111 DOM
-
2026-06-16days on market $119,000 Active 110 DOM
-
2026-06-15days on market $119,000 Active 109 DOM
-
2026-06-14days on market $119,000 Active 107 DOM
-
2026-06-10days on market $119,000 Active 104 DOM
-
2026-06-09days on market $119,000 Active 103 DOM
-
2026-06-08days on market $119,000 Active 102 DOM
-
2026-06-07days on market $119,000 Active 101 DOM
-
2026-06-03pricedays on market $119,000 Active 97 DOM
-
2026-06-02days on market $139,000 Active 96 DOM
-
2026-06-01days on market $139,000 Active 95 DOM
-
2026-05-31days on market $139,000 Active 94 DOM
-
2026-05-30days on market $139,000 Active 93 DOM
-
2026-02-26$139,000 Active 1740-char remark
Show marketing remark (1740 chars)
Welcome to this clean, spacious 1,822 sq ft manufactured home in the Sundial 55+ park community. With a generous open floor plan & thoughtful major updates that bring peace of mind— new roof (‘24), new heat pump/air conditioning, water heater & updated decking (all in ‘22)— this home offers comfort, functionality, & easy living. Inside you’ll find expansive natural light & a bright, inviting feel with a smooth flow between the kitchen, living, & dining rooms that’s perfect for both everyday life & life's most special gatherings. The covered porches & patio, front lawn, & storage shed provide great outdoor spaces for relaxing, visiting with friends & staying organized. Enjoy year-round comfort with central air conditioning & appreciate the accessibility of a wheelchair ramp from the generously sized carport. Beyond the home itself, the park amenities further set this property apart. Residents can enjoy an active & vibrant lifestyle with a swimming pool, hot tub, pickleball court, gym, dog park, billiard tables, & an impressive calendar of activities including live music, bunco, pinochle, cooking demos, fitness classes, potlucks, birthday parties & more. There’s always something to do & a welcoming community to be part of. Conveniently tucked in off of Lancaster Dr SE with easy access to shopping, dining, medical facilities & major roadways while still providing a quiet neighborhood setting. If you’re seeking a move-in ready home with valuable upgrades & outstanding amenities, this is one you won’t want to miss. Buyer to be approved by park management. More park information available upon request.
-
2019-06-30historical
-
2019-05-30$129,900 Active
-
2004-10-01soldstatus $65,000
-
2004-09-08historical
-
2004-07-08$69,900
-
1999-03-30soldstatus $327,000
ⓘ Source: listings_history table (triggers on properties + properties_extension) + one-shot
backfill from property_details.listing_events for pre-trigger history.
Tax reassessment forecast OR · Resets to sale price
- Current annual tax
- $1,733 · $144/mo
- Projected year-2 tax
- $1,733 · $144/mo
- Expected delta
- $0/yr ($0/mo · 0.0%)
ⓘ Screening estimate from a state-policy table — verify with the county assessor before closing.
Climate risk First Street
- Flood 1/10 Low FEMA zone X · 0% chance over 30 yrs
- Wildfire 1/10 Low
- Heat 4/10 Moderate
Nearby sold comps map
Loading sold comps map…
Walkable amenities ~0.75 mi
Loading nearby amenities…
Taxation est. · year 1
- Rental income
- $27,196
- − Mortgage interest
- −$6,666
- − Property taxes
- −$1,733
- − Insurance
- −$595
- − Repairs & maintenance
- −$2,176
- − Management
- −$2,176
- − Depreciation
- −$3,462
- Taxable income
- $10,389
- Est. tax owed @ 24.0%
- −$2,493
- After-tax cash flow
- $9,175/yr
For passive investors: Depreciation is non-cash, so a rental often shows a tax loss while cash-flowing — sheltering income. Rental losses are passive: they offset passive income freely, and up to $25,000/yr can offset ordinary (W-2) income if you actively participate and your MAGI is under $100k (phasing out to $0 by $150k); unused losses carry forward. On sale, claimed depreciation is recaptured at up to 25%, and gains may owe capital-gains tax (a 1031 exchange can defer both). Figures are a year-1 estimate at your 24.0% rate — not tax advice; consult a CPA.
Schools (NCES district)
- District
- Salem-Keizer SD 24J
- NCES district ID
- 4110820
- Math proficiency
- 34% ▼ -1.00%
- Reading proficiency
- 47% ▼ -2.00%
- Median HH income
- $48,632
- Composite
- 37.16/100
- National rank
- #9017
- State rank
- #103 of 183 in OR
Livability — Salem
- Score
- 79/100
- State rank
- #59
- US rank
- #2084
Category grades
Schools grade is shown separately in the Schools card above.
Census & demographics
- Census place
- Salem, OR
- County
- Marion County · 258,219 people
- City population
- 193,601
- Metro
- Salem, OR
- Population (ZIP)
- 25,966
- Household income
- $84,393
- Rent vs Own
- Severe rent burden
- 395.0
Population outlook (Marion County) Hauer SSP2
- Today (2025)
- 360,940 people
- By 2030
- 375,178 · +3.9%
- By 2040
- 400,914 · +11.1%
- By 2050
- 422,187 · +17.0%
- By 2075
- 460,305 · +27.5%
- By 2100
- 464,025 · +28.6%
Race, ethnicity, and origin ACS 2023
- Neighborhood character
- Majority White (61%)
- Race & ethnicity
- White 61% Hispanic / Latino 28% Two or more races 17% Asian 2% Pacific Islander 2%
- Hispanic origin (detail)
- Mexican 26%
- Common ancestry
- Portuguese 4% Italian 2% Lithuanian 2%
- Foreign-born
- 11% · Canada, Vietnam
- Languages at home
- 74% English-only · Spanish 22% Russian/Polish/Slavic 2% German/W. Germanic 1%
Political lean MEDSL · Marion
- 2024 margin
- Toss-up / Even · D 47.5% · R 49.5% · Other 3.0%
- 2008→2024 swing
- -4.2pp toward R · 2008: 2.2pp · 2024: -2.0pp
- All cycles
- 2024: R+2.0 2020: D+1.1 2016: R+5.0 2012: R+3.5 2008: D+2.2
Not yet ingested
- Civics
- —
Market trends
- HPI YoY
- ▼ -471.73%
- Current HPI
- 307.3264
- Rent YoY
- ▲ 2.62%
- Metro
- Salem, OR
- State GDP YoY
- ▲ 2.05%
- F500 in state
- 2
Industry mix (Fortune 500 HQ in OR)
| Industry | F500 HQs | Revenue |
|---|---|---|
| Consumer Goods | 1 | $51B |
|
||
Price history
-57.5% since first listed7 events — show timeline
- 2026-02-26 Listed $139,000 RMLS
- 2019-06-30 Listing Removed — WVMLS
- 2019-05-30 Listed $129,900 WVMLS
- 2004-10-01 Sold (MLS) $65,000 WVMLS
- 2004-09-08 Listing Removed — WVMLS
- 2004-07-08 Listed $69,900 WVMLS
- 1999-03-30 Sold (Public Records) $327,000 Public Records
Property tax history
+3.8%/yrLatest (2025): $1,733 · +7.7% YoY. Source: county tax records.
Cash-flow waterfall
monthlySold comps — $/sqft
last 12 mo · ≤1 miLoading sold comps…