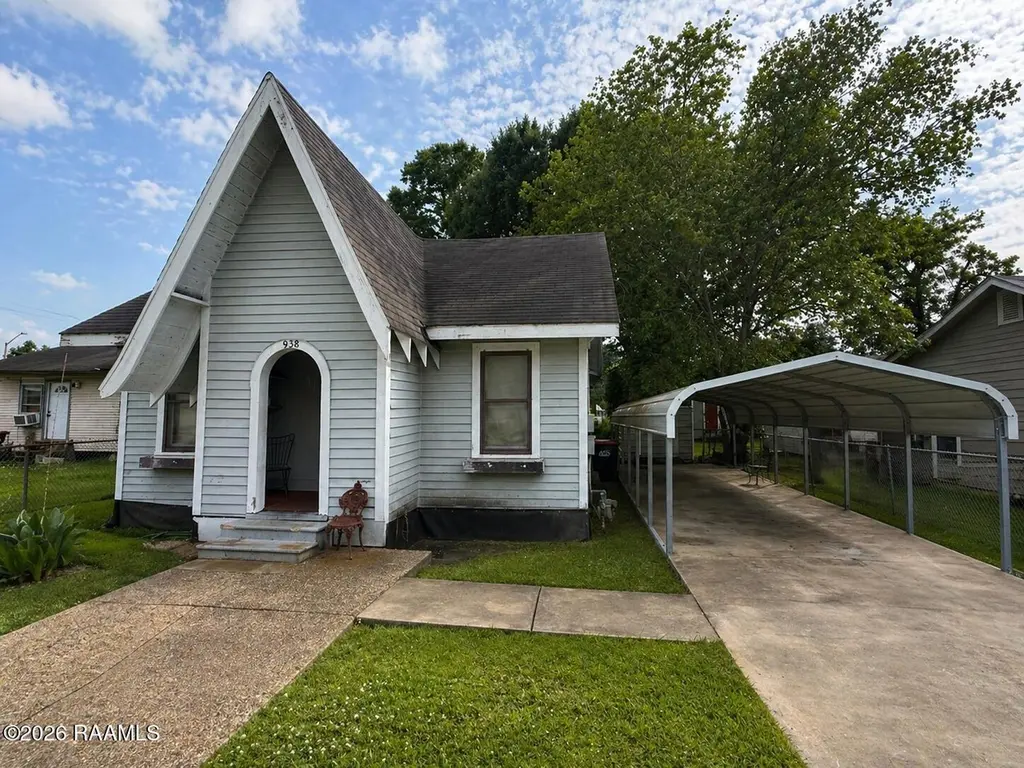
938 St Charles St · Lafayette, LA
Flood risk 1/10 · Minimal
- FEMA flood zone
- X (unshaded)
- Chance of flooding over 30 yrs
- 0.0%
- Est. flood insurance / yr
- $507 – $1,088
Fire risk 1/10 · Minimal
- Est. fire insurance / yr
- $1,269 – $2,357
Heat risk 9/10 · Severe
- Hot days now (above 108°F)
- 7 days/yr
- Hot days in 30 yrs
- 21 days/yr
Wind risk 9/10 · Severe
- Chance of severe wind over 30 yrs
- 99.0%
Air-quality risk 2/10 · Minimal
- Unhealthy air days now
- 0 days/yr
- Unhealthy air days in 30 yrs
- 1 days/yr
Risk factors via First Street. Map © Google.
Why this score? — see what drove the B+ grade
The composite is a weighted blend of 9 inputs, each scored 0–100. Each bar is that input's sub-score; the figure is the points it added to the 100-point composite (weight × sub-score).
- Cash flow +30.0/30.0
- ARV discount +15.0/15.0
- 1% rule +10.0/10.0
- DSCR +10.0/10.0
- Rent growth +4.3/5.0
- Schools +3.6/10.0
- Livability +3.5/5.0
- Condition / age +2.5/5.0
- Appreciation +0.0/10.0
$55,000
🖨 Deal sheet 📄 Offer letter ✓ Due diligence
Listing remarks
Welcome to 938 St. Charles -- a beautiful 3-bedroom, 2-bath home offering 1,059 sq ft of comfortable living space in the heart of Lafayette! 🏡This inviting home features a functional layout with great natural light and a warm, welcoming feel throughout. The fully fenced backyard provides privacy and space perfect for pets, outdoor gatherings, or relaxing evenings at home. Conveniently located near shopping, dining, parks, and everyday amenities, this property also offers access to well-regarded schools and a centrally located neighborhood that makes commuting around Lafayette quick and easy. Whether you're a first-time homebuyer, downsizing, or looking for a solid investment opportunity, th
Key facts
- Great natural light
- 6,534 sq ft lot
- Parking
Tags
Property features AI
Exterior
- Parking: Attached parking
- Utilities: Public sewer; City electricity
- Home design: Single-family residence; Fixer condition
- Construction: Brick veneer construction
- Exterior features: Chain link fence; Brick veneer exterior; City street frontage
Interior
- Bathrooms: 1 full bathroom
- Heating & cooling: Central heating; Central air conditioning
- Interior features: Central heating; Central air conditioning
Neighborhood map
What this means for you Summary
Snapshot
- This is a 3-bed/1.0-bath single-family listed at $55k.
Deal economics
- At list price, monthly cash flow is $669 ($8k/yr) — positive.
- The deal already cash-flows at list — no discount required.
- Meets the 1% rule at list price ($1k rent vs $55k).
- Recommended offer: $53k (3.0% below list) — sets the bar for market timing.
- Cap rate 20.9% vs local median 4.7% in Lafayette — top-decile yield for the area; either an underpriced asset or a hidden risk that comps aren't pricing in. Stress-test before assuming the spread holds.
Location & tenants
- Location reads 70/100 on livability (#63 in LA) — a middle-class / working-renter tenant base. Strengths: cost of living A+, housing A+, health & safety A+; Watch: amenities C-, employment C-, crime F.
- Lafayette Parish (urban): math 38% / reading 46% proficiency, ranked #19 of 98 in LA (top 19%) — families likely to look elsewhere, expect single-tenant / working-renter base with shorter leases.
- Zoned schools: Woodvale Elementary School (math 56% / reading 59%, grade C+, #76 of 646 statewide, top 12%, 890 students, 56% FRL); Paul Breaux Middle School (math 30% / reading 37%, grade F, #100 of 218 statewide, top 47%, 680 students, 68% FRL); Northside High School (math 17% / reading 22%, grade F, #186 of 265 statewide, top 73%, 655 students, 83% FRL).
- Market conditions: Rents rising fast (+7.3%/yr); 246 active listings in the ZIP; 27 comparable units currently listed for rent nearby; rentals at typical pace (median 21d on market — plan ~3-4 weeks tenant-placement turnaround); 48% of comp listings sitting > 30 days — soft ceiling on asking rent; lower-income renter base — watch delinquency; 1,585 units permitted in Lafayette Parish in 2024 (10 in 5+ unit buildings).
- At $1,293/mo this rent would consume 47% of the median local household income ($33k/yr) (locally 2089% of renters already pay >50% of income on rent) — very limited rent-growth headroom before tenants either downsize or default.
Forward outlook
- Local home prices are declining (-3.0%/yr); year-one equity from $380 of loan paydown is wiped out by about $2k of value loss. Plan a longer hold.
- Lafayette County population projected at +34% by 2050 — long-run rental-demand tailwind backs the buy-and-hold thesis.
- At projected returns (-3.0% appreciation + 7.3% rent growth), your $15k cash investment doubles in ~3 years — after that, you're playing with house money.
Negotiation context
- It's been on market 48 days — a 3% lower offer ($53k) is reasonable based on typical stale-listing flexibility.
Risks & watch-outs
- Watch-outs: built in 1860 — expect roof / HVAC / electrical / plumbing capex.
- Climate carrying-cost: severe wind risk, 99% chance of damaging wind over 30y; extreme-heat days projected 7→21/yr by 2055 (HVAC capex compounding) — expect insurance premiums to compound above CPI over the hold.
Questions for the listing agent
- It's been on market 48 days. Have you received any prior offers? Is the seller open to a 3% concession, seller financing, or rate buy-down credit?
- Built in 1860 — when were the roof, HVAC, electrical panel, plumbing, and water heater last replaced?
- Is there a deadline driving the sale (1031 exchange, divorce, estate, relocation)? That informs how much negotiation room exists.
- Schools are B-rated — typically a magnet for longer-tenancy family renters. What's the average tenant stay here, and is there a school-zone premium baked into asking?
- Crime grade is F in this area — have there been break-ins, vandalism, or insurance claims at this property in the last 3 years? What carrier currently insures it and at what premium?
- What's the average days-on-market for RENTAL listings here right now (not sales)? A rising rental-DOM trend means longer vacancies and softer asking-rent achievability than the comps imply.
- What's the recent tenant-quality profile in this submarket — average credit score on applications, eviction rate, late-payment / NSF rate, and stable-employment percentage? A property-management company in the area should have these aggregated.
- How much new for-sale + rental construction is in the pipeline within 1–3 miles? Heavy new supply typically softens prices + rents 12–24 months out; constrained supply supports both.
Investment metrics
- 1% rule
- 2.35% ✓
- Cap rate
- 20.88%
- Cash-on-cash
- 52.11%
- DSCR
- 3.32
- GRM
- 3.5
CMA / ARV
- ARV (median comp)
- $102,044
- List price
- $55,000
- Delta
- -46.10%
- Verdict
- UNDERPRICED
- Comps
- 20 within 1.0 mi
Show comp detail 12 sales within ~0.75 mi
| Address | Dist | Beds/Ba | Sqft | Sold | Price | $/sf | Match |
|---|---|---|---|---|---|---|---|
| 1038 Saint Charles St | 0.21mi | 3/1.0 | 1,046 (-1%) | 1mo | $57,750 | $55 | 88 |
| 717 S Sterling St | 0.32mi | 3/2.0 | 1,109 (+5%) | 10mo | $123,000 | $111 | 65 |
| 210 Lilly St | 0.34mi | 3/1.0 | 1,200 (+13%) | 2mo | $21,000 | $18 | 60 |
| 518 S Magnolia St | 0.49mi | 3/2.0 | 1,092 (+3%) | 16mo | $155,000 | $142 | 55 |
| 310 S Sterling St | 0.62mi | 2/2.0 (-1) | 1,066 (+1%) | 7mo | $136,000 | $128 | 55 |
| 617 S Sterling St | 0.40mi | 3/1.0 | 950 (-10%) | 13mo | $40,000 | $42 | 54 |
| 404 Attakapas Rd | 0.73mi | 3/1.0 | 979 (-8%) | 1mo | $71,000 | $73 | 52 |
| 113 Dorian Dr | 0.45mi | 3/2.0 | 1,203 (+14%) | 2mo | $164,000 | $136 | 51 |
| 730 Saint Charles St | 0.23mi | 2/1.0 (-1) | 900 (-15%) | 12mo | $105,000 | $117 | 49 |
| 708 Louisiana Ave | 0.47mi | 3/2.0 | 1,210 (+14%) | 6mo | $99,000 | $82 | 45 |
| 1013 E Vermillion St | 0.57mi | 2/1.0 (-1) | 900 (-15%) | 2mo | $48,000 | $53 | 42 |
| 324 Surrey St | 0.51mi | 2/1.0 (-1) | 1,200 (+13%) | 12mo | $90,000 | $75 | 39 |
Match score weights: distance 35% · size 25% · config 20% · recency 20%. Top-matched comps best support the ARV.
Projected returns pro-forma
-3.0% appreciation · 7.35% rent growth · sell at horizon
- IRR
- 54.8%
- Equity multiple
- 3.57×
- Total profit
- $39,593
- Equity at exit
- $8,201
- IRR
- 61.5%
- Equity multiple
- 8.52×
- Total profit
- $115,862
- Equity at exit
- $4,755
Cash invested: $15,400 (down + closing). Projections, not guarantees.
Landlord ↔ Tenant lean methodology
- Overall (STATE)
- 90 Strongly Landlord-Friendly
- State Louisiana
- 90 Strongly Landlord-Friendly · R+12
- County
- — inherits STATE
- City
- — inherits STATE
ZIP-level market 70501
- Rents YoY
- 7.3%
- Active inventory
- 246
- Price-to-rent
- 3.5×
Monthly cashflow live
- Estimated rent
- $1,293 high interval (Pro) →
- Mortgage (P&I)
- −$288
- Tax from tax record
- −$42 /mo · $501/yr
- Insurance
- −$23
- HOA
- −$0
- Vacancy / Maint / Mgmt
- −$272
- Net cashflow
- $669
Break-even live
UW: 25.0% down · 7.5% · 30yr · 1.5% tax · 5.0% vac · 8.0% maint · 8.0% mgmt
Financing live
Cash to close
- Down payment
- $13,750
- Closing costs
- $1,650
- Reserves months
- —
- Total cash needed
- —
Loan-product check · same deal, 3 products live
Conventional
25% down · 7.5% · 30yr
- Down + closing
- —
- Monthly P&I
- —
- Monthly cashflow
- —
- DSCR
- —
- Eligible?
- —
Personal DTI + credit; lowest rate.
DSCR
20% down · 8.5% · 30yr
- Down + closing
- —
- Monthly P&I
- —
- Monthly cashflow
- —
- DSCR
- —
- Eligible?
- —
No personal income docs; deal must DSCR.
Hard money
10% down · 12.0% · 12mo
- Down + closing
- —
- Monthly P&I
- —
- Monthly cashflow
- —
- DSCR
- —
- Eligible?
- —
Short-term bridge; refi at stabilization.
Rent comps 27 comps
| Address | Beds | Baths | Sqft | Rent | $/sqft | DOM | Units | Dist |
|---|---|---|---|---|---|---|---|---|
| 908 Saint Charles St Lafayette, LA | 3.0 | 2.0 | 1200 | $1,250 | $1.04 | 21d | 1 | 0.12mi |
| 1030 9th St Lafayette, LA | 2.0 | 1.0 | 800 | $800 | $1.00 | 43d | 1 | 0.50mi |
| 1002 E Simcoe St Lafayette, LA | 4.0 | 2.0 | 1100 | $950 | $0.86 | 43d | 1 | 0.55mi |
| 114 Choctaw Rd Lafayette, LA | 2.0 | 1.0 | 1000 | $1,200 | $1.20 | 21d | 1 | 0.70mi |
| 402 Lamar St Lafayette, LA | 2.0 | 2.0 | 770 | $825 | $1.07 | 43d | 1 | 0.81mi |
| 405 E Convent St Lafayette, LA | 2.0 | 1.0 | 847 | $1,125 | $1.33 | 43d | 1 | 0.88mi |
| 801 General Mouton Ave Unit 3 Lafayette, LA | 2.0 | 1.0 | 800 | $850 | $1.06 | 43d | 1 | 0.89mi |
| 300 Roosevelt St Unit A Lafayette, LA | 2.0 | 2.0 | 1070 | $1,750 | $1.64 | 13d | 1 | 0.97mi |
| 1404 General Mouton Ave Lafayette, LA | 2.0 | 2.0 | 1205 | $1,495 | $1.24 | 43d | 1 | 0.99mi |
| 908 Lamar St Unit 108 Lafayette, LA | 2.0 | 1.0 | 1050 | $1,025 | $0.98 | 13d | 1 | 1.00mi |
| 1426 General Mouton Ave Lafayette, LA | 2.0 | 2.0 | 1205 | $1,495 | $1.24 | 43d | 1 | 1.03mi |
| 330 General Mouton Ave Lafayette, LA | 3.0 | 1.0 | 1200 | $1,500 | $1.25 | 13d | 1 | 1.04mi |
| 305 General Mouton Ave Unit B Lafayette, LA | 2.0 | 1.0 | 750 | $1,250 | $1.67 | 13d | 1 | 1.04mi |
| 300 General Mouton Ave #6 Lafayette, LA | 2.0 | 2.5 | 1200 | $1,600 | $1.33 | 13d | 1 | 1.07mi |
| 213 General Gardner Ave Lafayette, LA | 3.0 | 1.0 | 1300 | $1,750 | $1.35 | 21d | 1 | 1.10mi |
| 423 Sampson St Lafayette, LA | 4.0 | 2.0 | 1400 | $950 | $0.68 | 43d | 1 | 1.12mi |
| 319 Tissington St Lafayette, LA | 2.0 | 1.0 | 956 | $775 | $0.81 | 43d | 1 | 1.15mi |
| 313 Hobson St Lafayette, LA | 3.0 | 1.0 | 1000 | $1,100 | $1.10 | 21d | 1 | 1.16mi |
| 109 Perth PL Lafayette, LA | 2.0 | 2.0 | 1150 | $1,625 | $1.41 | 13d | 1 | 1.19mi |
| 117 Perth PL Lafayette, LA | 2.0 | 2.0 | 1150 | $1,625 | $1.41 | 21d | 1 | 1.19mi |
| 701 W Taft St #7 Lafayette, LA | 2.0 | 2.5 | 1142 | $1,600 | $1.40 | 43d | 1 | 1.23mi |
| 3600 E Simcoe St Lafayette, LA | 1.0–3.0 | 1.0–2.0 | 1100 | $1,300 | $1.18 | 13d | 5 | 1.26mi |
| 615 Lafayette St Lafayette, LA | 2.0 | 2.0 | 1188 | $1,350 | $1.14 | 43d | 1 | 1.27mi |
| 1120 S Washington St Unit A Lafayette, LA | 2.0 | 2.0 | 892 | $2,200 | $2.47 | 13d | 1 | 1.33mi |
| 1120 S Washington St Unit B Lafayette, LA | 3.0 | 2.0 | 1030 | $2,400 | $2.33 | 13d | 1 | 1.33mi |
| 610 Sunset Dr Lafayette, LA | 2.0 | 1.0 | 1000 | $800 | $0.80 | 43d | 1 | 1.36mi |
| 114 Carlin St Lafayette, LA | 2.0 | 2.5 | 1200 | $2,000 | $1.67 | 43d | 1 | 1.46mi |
Listing history 17 events
-
2026-06-18days on market $55,000 Active 48 DOM
-
2026-06-17days on market $55,000 Active 47 DOM
-
2026-06-16days on market $55,000 Active 46 DOM
-
2026-06-15days on market $55,000 Active 45 DOM
-
2026-06-14days on market $55,000 Active 43 DOM
-
2026-06-13pricedays on market $55,000 Active 42 DOM
-
2026-06-10days on market $65,000 Active 40 DOM
-
2026-06-09days on market $65,000 Active 39 DOM
-
2026-06-08days on market $65,000 Active 38 DOM
-
2026-06-07days on market $65,000 Active 37 DOM
-
2026-06-05days on market $65,000 Active 34 DOM
-
2026-06-03days on market $65,000 Active 33 DOM
-
2026-06-02days on market $65,000 Active 32 DOM
-
2026-06-01days on market $65,000 Active 31 DOM
-
2026-05-31days on market $65,000 Active 30 DOM
-
2026-05-30days on market $65,000 Active 29 DOM
-
2026-05-01$70,000 Active 837-char remark
ⓘ Source: listings_history table (triggers on properties + properties_extension) + one-shot
backfill from property_details.listing_events for pre-trigger history.
Tax reassessment forecast LA · Resets to sale price
- Current annual tax
- $501 · $42/mo
- Projected year-2 tax
- $501 · $42/mo
- Expected delta
- $0/yr ($0/mo · 0.0%)
ⓘ Screening estimate from a state-policy table — verify with the county assessor before closing.
Climate risk First Street
- Flood 1/10 Low FEMA zone X (unshaded) · 0% chance over 30 yrs
- Wildfire 1/10 Low
- Heat 9/10 Extreme 7 d/yr ≥108°F today · 21 d/yr by 30 yrs out
- Wind 9/10 Extreme 99% chance of damaging wind over 30 yrs
- Air quality 2/10 Low 0 unhealthy d/yr today · 1 by 30 yrs out
Nearby sold comps map
Loading sold comps map…
Walkable amenities ~0.75 mi
Loading nearby amenities…
Taxation est. · year 1
- Rental income
- $15,522
- − Mortgage interest
- −$3,081
- − Property taxes
- −$501
- − Insurance
- −$275
- − Repairs & maintenance
- −$1,242
- − Management
- −$1,242
- − Depreciation
- −$1,600
- Taxable income
- $7,581
- Est. tax owed @ 24.0%
- −$1,820
- After-tax cash flow
- $6,205/yr
For passive investors: Depreciation is non-cash, so a rental often shows a tax loss while cash-flowing — sheltering income. Rental losses are passive: they offset passive income freely, and up to $25,000/yr can offset ordinary (W-2) income if you actively participate and your MAGI is under $100k (phasing out to $0 by $150k); unused losses carry forward. On sale, claimed depreciation is recaptured at up to 25%, and gains may owe capital-gains tax (a 1031 exchange can defer both). Figures are a year-1 estimate at your 24.0% rate — not tax advice; consult a CPA.
Schools (NCES district)
- District
- Lafayette Parish
- NCES district ID
- 2200870
- Math proficiency
- 38% ▼ -32.00%
- Reading proficiency
- 46% ▼ -24.00%
- Median HH income
- $50,238
- Composite
- 36.15/100
- National rank
- #4741
- State rank
- #19 of 98 in LA
Livability — Lafayette
- Score
- 70/100
- State rank
- #63
- US rank
- #8133
Category grades
Schools grade is shown separately in the Schools card above.
Census & demographics
- Census place
- Lafayette, LA
- County
- Lafayette Parish · 207,544 people
- City population
- 158,114
- Metro
- Lafayette, LA
- Population (ZIP)
- 26,465
- Household income
- $33,365
- Rent vs Own
- Severe rent burden
- 2089.0
Population outlook (Lafayette County) Hauer SSP2
- Today (2025)
- 280,930 people
- By 2030
- 301,092 · +7.2%
- By 2040
- 339,456 · +20.8%
- By 2050
- 375,156 · +33.5%
- By 2075
- 451,672 · +60.8%
- By 2100
- 497,203 · +77.0%
Race, ethnicity, and origin ACS 2023
- Neighborhood character
- Predominantly Black (73%)
- Race & ethnicity
- Black 73% White 18% Two or more races 6% Hispanic / Latino 4%
- Common ancestry
- Lithuanian 4%
- Foreign-born
- 2% · Canada
- Languages at home
- 95% English-only · Spanish 3% French/Haitian/Cajun 2%
Political lean MEDSL · Lafayette
- 2024 margin
- Solid R (+31.4) · D 33.5% · R 64.8% · Other 1.7%
- 2008→2024 swing
- -0.1pp no change · 2008: -31.3pp · 2024: -31.4pp
- All cycles
- 2024: R+31.4 2020: R+28.7 2016: R+33.6 2012: R+33.7 2008: R+31.3
Not yet ingested
- Civics
- —
Market trends
- HPI YoY
- ▼ -108.63%
- Current HPI
- 81.2963
- Rent YoY
- ▲ 7.35%
- Metro
- Lafayette, LA
- State GDP YoY
- ▲ 3.29%
- F500 in state
- 10
Industry mix (Fortune 500 HQ in LA)
| Industry | F500 HQs | Revenue |
|---|---|---|
| Telecommunications | 2 | $23B |
|
||
| Utilities | 1 | $12B |
|
||
| Wholesale / Distribution | 1 | $5B |
|
||
| Advertising | 1 | $2B |
|
||
Price history
-21.4% since first listed3 events — show timeline
- 2026-06-11 Price Changed $55,000 AcadianaMLS
- 2026-05-19 Price Changed $65,000 AcadianaMLS
- 2026-05-01 Listed $70,000 AcadianaMLS
Property tax history
+1.2%/yrLatest (2025): $501 · -1.1% YoY. Source: county tax records.
Cash-flow waterfall
monthlySold comps — $/sqft
last 12 mo · ≤1 miLoading sold comps…