1832 SE Roxy Way · Stuart, FL
Flood risk 7/10 · Major
- FEMA flood zone
- X (unshaded)
- Chance of flooding over 30 yrs
- 0.77%
- Est. flood insurance / yr
- $507 – $1,088
Fire risk 1/10 · Minimal
- Est. fire insurance / yr
- $947 – $1,759
Heat risk 10/10 · Severe
- Hot days now (above 106°F)
- 7 days/yr
- Hot days in 30 yrs
- 25 days/yr
Wind risk 10/10 · Severe
- Chance of severe wind over 30 yrs
- 99.0%
Air-quality risk 2/10 · Minimal
- Unhealthy air days now
- 2 days/yr
- Unhealthy air days in 30 yrs
- 2 days/yr
Risk factors via First Street. Map © Google.
Why this score? — see what drove the F grade
The composite is a weighted blend of 9 inputs, each scored 0–100. Each bar is that input's sub-score; the figure is the points it added to the 100-point composite (weight × sub-score).
- Appreciation +10.0/10.0
- Cash flow +6.4/30.0
- Schools +4.5/10.0
- Livability +4.2/5.0
- Rent growth +2.5/5.0
- Condition / age +2.5/5.0
- 1% rule +2.2/10.0
- ARV discount +1.2/15.0
- DSCR +0.7/10.0
$444,990
🖨 Deal sheet (PDF) 📄 Offer letter ✓ Due diligence
Listing remarks
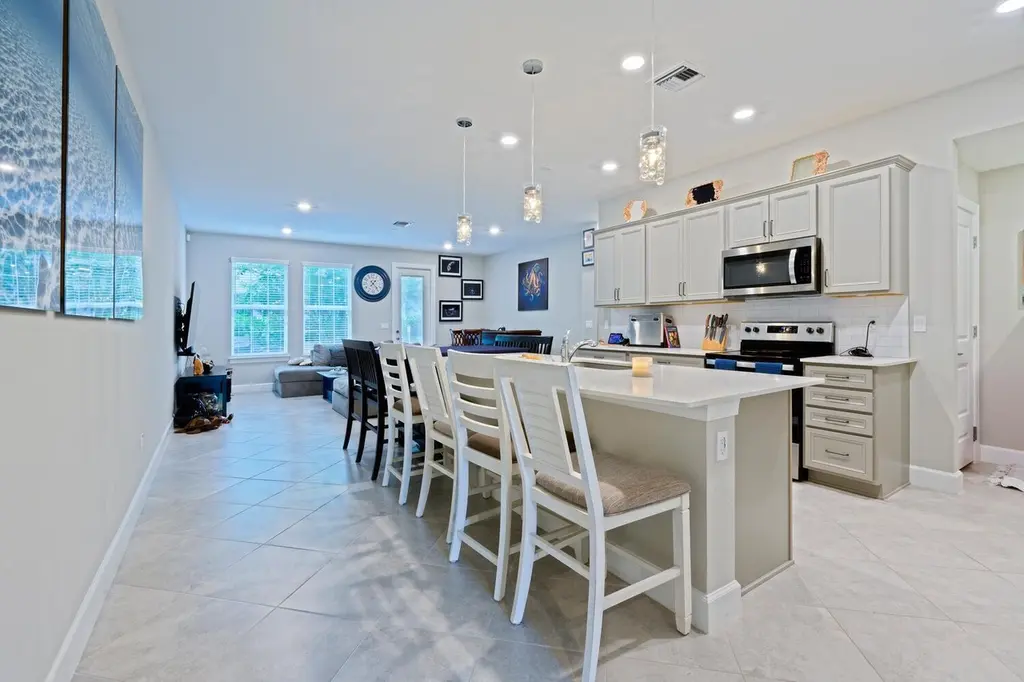
Beautifully upgraded 3BR/2.5BA townhome built in 2022 in desirable Ocean Cove. This move-in ready home features open-concept living, 9' ceilings, impact windows and doors, smart-home wiring, and AT & T fiber internet included. The coastal-style kitchen offers a large quartz island, pantry, coffee nook, and Samsung Smart refrigerator with specialty ice. Upstairs, you'll find three spacious bedrooms, including a primary suite with walk-in closet and spa-style shower, double-vanity baths, and a dedicated laundry room. Enjoy an extended driveway, private paved patio, and nearby walking paths around a scenic reservoir with gazebo. Prime Stuart location close to beaches, shopping, dining, par
Key facts
- Smart-home wiring
- Upgraded townhome
- Open-concept living
Tags
Neighborhood map
What this means for you Summary
Snapshot
- This is a 3-bed/2.5-bath townhouse listed at $445k.
Deal economics
- At list price, monthly cash flow is $-829 ($-10k/yr) — negative.
- To cash-flow at today's rent, offer at most $298k (32.9% below list).
- To meet the 1% rule (rent ≥ 1% of price), the offer needs to be $320k (28.0% below list).
- Recommended offer: $298k (32.9% below list) — sets the bar for cash-flow.
Location & tenants
- Location reads 84/100 on livability (#39 in FL, #790 nationally) — a professional / high-income tenant draw. Strengths: commute A+, housing A+, health & safety A+; Watch: crime C-, employment C-, amenities D.
- Martin (suburban): math 52% / reading 53% proficiency, ranked #24 of 73 in FL (top 33%) — acceptable for families but not a draw, mixed tenant base, ~2y average lease.
- Zoned schools: J. D. Parker School of Technology (math 39% / reading 40%, grade F, #1,513 of 2,144 statewide, top 73%, 519 students, 72% FRL); Stuart Middle School (math 55% / reading 55%, grade B-, #180 of 571 statewide, top 32%, 867 students, 49% FRL); Jensen Beach High School (math 53% / reading 71%, grade B-, #98 of 667 statewide, top 15%, 1,584 students, 36% FRL).
- Market conditions: 252 active listings in the ZIP; 7 comparable units currently listed for rent nearby; rentals at typical pace (median 25d on market — plan ~3-4 weeks tenant-placement turnaround); solid renter incomes; 737 units permitted in Martin County in 2024 (167 in 5+ unit buildings).
- At $3,203/mo this rent would consume 46% of the median local household income ($84k/yr) (locally 247% of renters already pay >50% of income on rent) — very limited rent-growth headroom before tenants either downsize or default.
Forward outlook
- In year one you build about $48k of equity ($3k loan paydown + $44k appreciation (10.0% local appreciation)).
- Martin County population projected at +19% by 2050 — long-run rental-demand tailwind backs the buy-and-hold thesis.
- By year 2, paydown + projected appreciation supports a ~$76k cash-out refi (75% LTV) — recoverable capital for the next deal without selling this one.
Negotiation context
- It's been on market 20 days — a 2% lower offer ($438k) is reasonable based on typical stale-listing flexibility.
- 4 sale attempts; this cycle's ask is 15244% above the opening price — seller raised mid-cycle; expect resistance to lowballs.
Risks & watch-outs
- Watch-outs: flood insurance adds $66/mo.
- Climate carrying-cost: major flood risk; severe wind risk, 99% chance of damaging wind over 30y; extreme-heat days projected 7→25/yr by 2055 (HVAC capex compounding) — expect insurance premiums to compound above CPI over the hold.
Questions for the listing agent
- What do current leases actually rent for vs. the listed asking? Can we see a recent rent roll and the last 12 months of T-12 income?
- What's the actual annual flood-insurance premium (NFIP or private), and is the property in a SFHA with mandatory coverage?
- What does the HOA fee cover, when was the last increase, and are there any pending special assessments or reserve-fund shortfalls?
- Is there a deadline driving the sale (1031 exchange, divorce, estate, relocation)? That informs how much negotiation room exists.
- Schools are A-rated — typically a magnet for longer-tenancy family renters. What's the average tenant stay here, and is there a school-zone premium baked into asking?
- The area grade is low — what's the realistic commute time and amenity access for the typical tenant pool here? Any planned neighborhood developments (good or bad) we should know about?
- What's the average days-on-market for RENTAL listings here right now (not sales)? A rising rental-DOM trend means longer vacancies and softer asking-rent achievability than the comps imply.
- What's the recent tenant-quality profile in this submarket — average credit score on applications, eviction rate, late-payment / NSF rate, and stable-employment percentage? A property-management company in the area should have these aggregated.
- How much new for-sale + rental construction is in the pipeline within 1–3 miles? Heavy new supply typically softens prices + rents 12–24 months out; constrained supply supports both.
Investment metrics
- 1% rule
- 0.72% ✗
- Cap rate
- 4.24%
- Cash-on-cash
- -7.35%
- DSCR
- 0.67
- GRM
- 11.6
CMA / ARV
- ARV (on-the-fly)
- $390,258
- Comps found
- 4
Show comp detail 4 sales within ~0.75 mi
| Address | Dist | Beds/Ba | Sqft | Sold | Price | $/sf | Match |
|---|---|---|---|---|---|---|---|
| 1843 SE Roxy Way | 0.03mi | 3/2.5 | 1,782 (0%) | 3mo | $390,000 | $219 | 96 |
| 1857 SE Tarni Way | 0.02mi | 3/2.5 | 1,816 (+2%) | 10mo | $380,000 | $209 | 88 |
| 1814 SE Ocean Cove Way | 0.05mi | 3/2.5 | 1,637 (-8%) | 16mo | $460,000 | $281 | 71 |
| 162 SE Saint Lucie Blvd Unit B201 | 0.63mi | 3/2.0 | 1,684 (-6%) | 5mo | $240,000 | $143 | 55 |
Match score weights: distance 35% · size 25% · config 20% · recency 20%. Top-matched comps best support the ARV.
Projected returns pro-forma
10.0% appreciation · 3.0% rent growth · sell at horizon
- IRR
- 18.7%
- Equity multiple
- 2.52×
- Total profit
- $189,753
- Equity at exit
- $400,882
- IRR
- 17.3%
- Equity multiple
- 5.82×
- Total profit
- $600,774
- Equity at exit
- $864,518
Cash invested: $124,597 (down + closing). Projections, not guarantees.
Landlord ↔ Tenant lean methodology
- Overall (STATE)
- 87 Strongly Landlord-Friendly
- State Florida
- 87 Strongly Landlord-Friendly · R+3
- County
- — inherits STATE
- City
- — inherits STATE
ZIP-level market 34996
- Home prices YoY
- 2.1%
- Active inventory
- 252
- Price-to-rent
- 11.6×
Monthly cashflow live
- Estimated rent
- $3,203 high interval (Pro) →
- Mortgage (P&I)
- −$2,334
- Tax from tax record
- −$509 /mo · $6,110/yr
- Insurance
- −$185
- Flood insurance flood zone
- −$66 /mo · $798/yr
- HOA
- −$265
- Vacancy / Maint / Mgmt
- −$673
- Net cashflow
- $-829
Break-even live
Sensitivity live
| Price | -10% $-577 | -5% $-703 | +0% $-829 | +5% $-955 | +10% $-1,081 |
|---|---|---|---|---|---|
| Rent | -10% $-1,082 | -5% $-956 | +0% $-829 | +5% $-703 | +10% $-576 |
| Rate | -1.0pp $-605 | -0.5pp $-716 | base $-829 | +0.5pp $-945 | +1.0pp $-1,062 |
UW: 25.0% down · 7.5% · 30yr · 1.5% tax · 5.0% vac · 8.0% maint · 8.0% mgmt
Financing live
Cash to close
- Down payment
- $111,248
- Closing costs
- $13,350
- Reserves months
- —
- Total cash needed
- —
Loan-product check · same deal, 3 products live
Conventional
25% down · 7.5% · 30yr
- Down + closing
- —
- Monthly P&I
- —
- Monthly cashflow
- —
- DSCR
- —
- Eligible?
- —
Personal DTI + credit; lowest rate.
DSCR
20% down · 8.5% · 30yr
- Down + closing
- —
- Monthly P&I
- —
- Monthly cashflow
- —
- DSCR
- —
- Eligible?
- —
No personal income docs; deal must DSCR.
Hard money
10% down · 12.0% · 12mo
- Down + closing
- —
- Monthly P&I
- —
- Monthly cashflow
- —
- DSCR
- —
- Eligible?
- —
Short-term bridge; refi at stabilization.
Rent comps 7 comps
| Address | Beds | Baths | Sqft | Rent | $/sqft | DOM | Units | Dist |
|---|---|---|---|---|---|---|---|---|
| 1866 SE Tarni Way Stuart, FL | 3.0 | 2.5 | 1782 | $2,800 | $1.57 | 15d | 1 | 0.05mi |
| 2950 SE Ocean Blvd Stuart, FL | 2.0 | 2.0 | 1157 | $1,800 | $1.56 | 15d | 3 | 0.11mi |
| 1196 SE Saint Lucie Blvd Stuart, FL | 2.0 | 2.0 | 1309 | $4,300 | $3.28 | 25d | 1 | 0.43mi |
| 175 SE Saint Lucie Blvd Stuart, FL | 2.0 | 2.0–2.5 | 1300 | $2,600 | $2.00 | 25d | 4 | 0.69mi |
| 905 SE Flamingo Ave Stuart, FL | 3.0 | 2.0 | 1520 | $4,500 | $2.96 | 25d | 1 | 0.70mi |
| 150 SE Four Winds Dr Unit B303 Stuart, FL | 2.0 | 2.0 | 1359 | $2,500 | $1.84 | 25d | 1 | 0.76mi |
| 1843 SE Granada Ln Stuart, FL | 2.0 | 2.0 | 1606 | $1,800 | $1.12 | 15d | 1 | 1.02mi |
HOA detail
- Monthly dues
- $265 · $3,180/yr
- Likely covers
- internet
Listing history 24 events
-
2026-06-10days on market $444,990 Active 20 DOM
-
2026-06-09days on market $444,990 Active 19 DOM
-
2026-06-08days on market $444,990 Active 18 DOM
-
2026-06-07days on market $444,990 Active 17 DOM
-
2026-06-03days on market $444,990 Active 13 DOM
-
2026-06-02days on market $444,990 Active 12 DOM
-
2026-06-01days on market $444,990 Active 11 DOM
-
2026-05-31days on market $444,990 Active 10 DOM
-
2026-05-31days on market $444,990 Active 9 DOM
-
2026-05-22$2,900
-
2026-05-21$444,990 Active
-
2025-12-29historical $3,000
-
2025-12-22price $3,000
-
2025-12-14historical
-
2025-12-04price $3,490
-
2025-12-03price $444,990
-
2025-12-03price $445,000
-
2025-10-28historical $5,900
-
2025-10-28$5,900
-
2025-10-27price $455,000
-
2025-08-12$5,900
-
2025-07-28price $480,000
-
2025-07-23price $499,000
-
2025-07-18$500,000 Active
ⓘ Source: listings_history table (triggers on properties + properties_extension) + one-shot
backfill from property_details.listing_events for pre-trigger history.
Tax reassessment forecast FL · Resets to sale price
- Current annual tax
- $6,110 · $509/mo
- Projected year-2 tax
- $6,110 · $509/mo
- Expected delta
- $0/yr ($0/mo · 0.0%)
ⓘ Screening estimate from a state-policy table — verify with the county assessor before closing.
Climate risk First Street
- Flood 7/10 Severe FEMA zone X (unshaded) · 77% chance over 30 yrs
- Wildfire 1/10 Low
- Heat 10/10 Extreme 7 d/yr ≥106°F today · 25 d/yr by 30 yrs out
- Wind 10/10 Extreme 99% chance of damaging wind over 30 yrs
- Air quality 2/10 Low 2 unhealthy d/yr today · 2 by 30 yrs out
Nearby sold comps map
Loading sold comps map…
Walkable amenities ~0.75 mi
Loading nearby amenities…
Taxation est. · year 1
- Rental income
- $38,433
- − Mortgage interest
- −$24,926
- − Property taxes
- −$6,110
- − Insurance
- −$3,022
- − Repairs & maintenance
- −$3,075
- − Management
- −$3,075
- − HOA
- −$3,180
- − Depreciation
- −$12,945
- Taxable loss
- −$17,900
- Est. tax savings @ 24.0%
- +$4,296
- After-tax cash flow
- $-5,657/yr
For passive investors: Depreciation is non-cash, so a rental often shows a tax loss while cash-flowing — sheltering income. Rental losses are passive: they offset passive income freely, and up to $25,000/yr can offset ordinary (W-2) income if you actively participate and your MAGI is under $100k (phasing out to $0 by $150k); unused losses carry forward. On sale, claimed depreciation is recaptured at up to 25%, and gains may owe capital-gains tax (a 1031 exchange can defer both). Figures are a year-1 estimate at your 24.0% rate — not tax advice; consult a CPA.
Schools (NCES district)
- District
- Martin
- NCES district ID
- 1201290
- Math proficiency
- 52% ▼ -14.00%
- Reading proficiency
- 53% ▼ -4.00%
- Median HH income
- $52,482
- Composite
- 45.1/100
- National rank
- #2690
- State rank
- #24 of 73 in FL
Livability — Stuart
- Score
- 84/100
- State rank
- #39
- US rank
- #790
Category grades
Schools grade is shown separately in the Schools card above.
Census & demographics
- Census place
- Stuart, FL
- County
- Martin County · 165,223 people
- City population
- 65,812
- Metro
- Port St. Lucie, FL
- Population (ZIP)
- 10,653
- Household income
- $83,929
- Rent vs Own
- Severe rent burden
- 247.0
Population outlook (Martin County) Hauer SSP2
- Today (2025)
- 172,383 people
- By 2030
- 180,192 · +4.5%
- By 2040
- 194,114 · +12.6%
- By 2050
- 204,992 · +18.9%
- By 2075
- 229,641 · +33.2%
- By 2100
- 232,146 · +34.7%
Race, ethnicity, and origin ACS 2023
- Neighborhood character
- Predominantly White (90%)
- Race & ethnicity
- White 90% Hispanic / Latino 7% Two or more races 5%
- Hispanic origin (detail)
- Puerto Rican 2%
- Common ancestry
- Italian 3% Romanian 3% Slovak 3%
- Foreign-born
- 6% · Canada
- Languages at home
- 94% English-only · Spanish 3% Other Indo-European 1% French/Haitian/Cajun 1%
Political lean MEDSL · Martin
- 2024 margin
- Solid R (+31.1) · D 34.1% · R 65.2%
- 2008→2024 swing
- -17.5pp toward R · 2008: -13.6pp · 2024: -31.1pp
- All cycles
- 2024: R+31.1 2020: R+24.6 2016: R+26.9 2012: R+22.9 2008: R+13.6
Not yet ingested
- Civics
- —
Market trends
- HPI YoY
- ▲ 13.71%
- Current HPI
- 658.96
- Rent YoY
- —
- Metro
- Port St. Lucie, FL
- State GDP YoY
- ▲ 3.28%
- F500 in state
- 36
Industry mix (Fortune 500 HQ in FL)
| Industry | F500 HQs | Revenue |
|---|---|---|
| Industrial Technology | 2 | $29B |
|
||
| Insurance | 2 | $17B |
|
||
| Retail | 1 | $60B |
|
||
| Technology Distribution | 1 | $58B |
|
||
| Homebuilding | 1 | $35B |
|
||
| Technology Manufacturing | 1 | $35B |
|
||
Price history
-99.4% since first listed14 events — show timeline
- 2026-05-22 Listed for Rent $2,900 RMLSFL
- 2025-12-29 Rental Removed $3,000 RMLSFL
- 2025-12-22 Price Changed $3,000 RMLSFL
- 2025-12-14 Listing Removed — Beaches MLS
- 2025-12-04 Price Changed $3,490 RMLSFL
- 2025-12-03 Price Changed $444,990 Beaches MLS
- 2025-12-03 Price Changed $445,000 Beaches MLS
- 2025-10-28 Rental Removed $5,900 GFLMLS
- 2025-10-28 Listed for Rent $5,900 GFLMLS
- 2025-10-27 Price Changed $455,000 Beaches MLS
- 2025-08-12 Listed for Rent $5,900 RMLSFL
- 2025-07-28 Price Changed $480,000 Beaches MLS
- 2025-07-23 Price Changed $499,000 Beaches MLS
- 2025-07-18 Listed $500,000 Beaches MLS
Property tax history
+79.7%/yrLatest (2025): $6,110 · -0.9% YoY. Source: county tax records.
Cash-flow waterfall
monthlySold comps — $/sqft
last 12 mo · ≤1 miLoading sold comps…