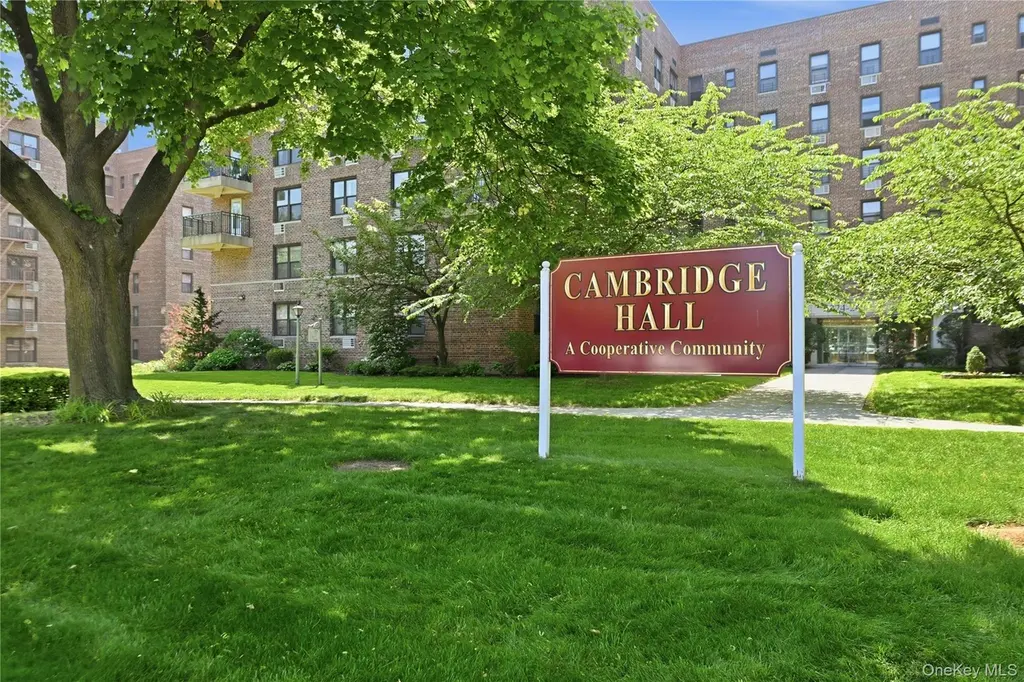
226-26 Union Tpke Unit 2N · New York, NY
Flood risk 1/10 · Minimal
- FEMA flood zone
- X (unshaded)
- Chance of flooding over 30 yrs
- 0.0%
- Est. flood insurance / yr
- $507 – $1,088
Fire risk 2/10 · Minimal
- Est. fire insurance / yr
- $691 – $1,283
Heat risk 6/10 · Moderate
- Hot days now (above 97°F)
- 7 days/yr
- Hot days in 30 yrs
- 15 days/yr
Wind risk 6/10 · Moderate
- Chance of severe wind over 30 yrs
- 27.0%
Air-quality risk 3/10 · Minor
- Unhealthy air days now
- 4 days/yr
- Unhealthy air days in 30 yrs
- 4 days/yr
Risk factors via First Street. Map © Google.
Why this score? — see what drove the F grade
The composite is a weighted blend of 9 inputs, each scored 0–100. Each bar is that input's sub-score; the figure is the points it added to the 100-point composite (weight × sub-score).
- ARV discount +7.5/15.0
- Schools +5.0/10.0
- Rent growth +4.6/5.0
- Livability +3.8/5.0
- 1% rule +3.4/10.0
- Condition / age +2.5/5.0
- Cash flow +0.0/30.0
- DSCR +0.0/10.0
- Appreciation +0.0/10.0
$298,000
🖨 Deal sheet 📄 Offer letter ✓ Due diligence
Listing remarks
Move right into this updated large 1-bedroom Jr4 co-op in sought-after Oakland Gardens, Bayside. Featuring hardwood floors throughout, an updated kitchen, generous walk-in closet space, and a versatile floor plan that can easily be converted into a 2-bedroom or create the perfect bonus room, office, or guest space. This well-maintained community offers three parking lots, beautifully landscaped grounds, a private swimming pool, convenient on-site laundry, dedicated bike storage, and additional storage options available for a nominal fee.
Key facts
- Updated kitchen
- Versatile floor plan
- Parking
Tags
Property features AI
Finance
- HOA & community: Association amenities include pool; Association fee billed monthly; Fee includes common area maintenance, gas, grounds care, heat, hot water, pool service, snow removal, trash, water; Additional monthly assessment fee of $179
Exterior
- Parking: Off-street parking; Parking lot space (1 total)
- Utilities: Con-Edison electric; Public sewer; Cable connected; Electricity connected
- Home design: Stock cooperative
- Construction: Brick construction
- Exterior features: In-ground pool; No waterfront
Interior
- Kitchen: Dishwasher; Stainless steel appliances; Granite counters
- Bedrooms: Located on entry level 2
- Flooring: Wood flooring
- Bathrooms: 1 full bathroom
- Heating & cooling: Natural gas heating; Wall/window AC unit(s)
- Interior features: Elevator; Granite counters; Walk-in closet(s); Cats allowed, no dogs
- Laundry & utility: Common area laundry; Laundry in basement
Neighborhood map
What this means for you Summary
Snapshot
- This is a 1-bed/1.0-bath condo listed at $298k.
Deal economics
- At list price, monthly cash flow is $-1k ($-17k/yr) — negative.
- To cash-flow at today's rent, offer at most $287k (3.8% below list).
- To meet the 1% rule (rent ≥ 1% of price), the offer needs to be $251k (15.9% below list).
- Recommended offer: $251k (15.9% below list) — sets the bar for 1% rule.
- Cap rate 0.5% vs local median 2.6% in New York — below-typical yield; the buyer is paying a premium for something (appreciation thesis, condition, location) that the cap rate doesn't capture.
Location & tenants
- Location reads 75/100 on livability (#268 in NY, #4,188 nationally) — a middle-class / working-renter tenant base. Strengths: amenities A+, commute A+, health & safety A; Watch: crime F, cost of living F.
- Market conditions: Rents rising fast (+8.5%/yr); 248 active listings in the ZIP; 8 comparable units currently listed for rent nearby; rentals at typical pace (median 25d on market — plan ~3-4 weeks tenant-placement turnaround); solid renter incomes; 5,302 units permitted in Queens County in 2024 (4,918 in 5+ unit buildings).
- This rent runs 31% of the median local income ($98k/yr) — at the standard rent-burdened threshold; future hikes will face affordability resistance.
Forward outlook
- Local home prices are declining (-3.0%/yr); year-one equity from $2k of loan paydown is wiped out by about $9k of value loss. Plan a longer hold.
- Queens County population projected at +16% by 2050 — long-run rental-demand tailwind backs the buy-and-hold thesis.
Negotiation context
- It's been on market 23 days — a 2% lower offer ($294k) is reasonable based on typical stale-listing flexibility.
- 2 sale attempts since 7y ago with the ask held roughly flat each time — persistent listings suggest the price (not the market) is what's stuck; bring a comps-based counter.
Risks & watch-outs
- Watch-outs: HOA is 54% of rent; built in 1956 — expect roof / HVAC / electrical / plumbing capex.
- Climate carrying-cost: major wind risk, 27% chance of damaging wind over 30y; extreme-heat days projected 7→15/yr by 2055 (HVAC capex compounding) — expect insurance premiums to compound above CPI over the hold.
Questions for the listing agent
- What do current leases actually rent for vs. the listed asking? Can we see a recent rent roll and the last 12 months of T-12 income?
- Built in 1956 — when were the roof, HVAC, electrical panel, plumbing, and water heater last replaced?
- What does the HOA fee cover, when was the last increase, and are there any pending special assessments or reserve-fund shortfalls?
- Any open or pending special assessments — roof, HVAC, plumbing, elevator, façade? What's the per-unit balance and payoff schedule, and is the seller paying it off at close or rolling it to the buyer?
- Is there a deadline driving the sale (1031 exchange, divorce, estate, relocation)? That informs how much negotiation room exists.
- Schools are B-rated — typically a magnet for longer-tenancy family renters. What's the average tenant stay here, and is there a school-zone premium baked into asking?
- Crime grade is F in this area — have there been break-ins, vandalism, or insurance claims at this property in the last 3 years? What carrier currently insures it and at what premium?
- The area grade is low — what's the realistic commute time and amenity access for the typical tenant pool here? Any planned neighborhood developments (good or bad) we should know about?
- What's the average days-on-market for RENTAL listings here right now (not sales)? A rising rental-DOM trend means longer vacancies and softer asking-rent achievability than the comps imply.
- What's the recent tenant-quality profile in this submarket — average credit score on applications, eviction rate, late-payment / NSF rate, and stable-employment percentage? A property-management company in the area should have these aggregated.
- How much new apartment / multifamily construction is in the pipeline within 1–3 miles? Heavy new supply (>2% of stock underway) typically softens rents 12–24 months out; light construction supports rent growth.
Investment metrics
- 1% rule
- 0.84% ✗
- Cap rate
- 0.48%
- Cash-on-cash
- -20.75%
- DSCR
- 0.08
- GRM
- 9.9
CMA / ARV
No comps found within radius.
Projected returns pro-forma
-3.0% appreciation · 8.0% rent growth · sell at horizon
- IRR
- -47.1%
- Equity multiple
- -0.51×
- Total profit
- $-126,059
- Equity at exit
- $44,433
- IRR
- -33.0%
- Equity multiple
- -0.97×
- Total profit
- $-164,240
- Equity at exit
- $25,766
Cash invested: $83,440 (down + closing). Projections, not guarantees.
Landlord ↔ Tenant lean methodology
- Overall (CITY)
- 0 Strongly Tenant-Friendly
- State New York
- 15 Strongly Tenant-Friendly · D+10
- County
- — inherits STATE
- City New York
- 0 Strongly Tenant-Friendly · D+34
ZIP-level market 11364
- Rents YoY
- 8.5%
- Active inventory
- 248
- Price-to-rent
- 9.9×
Monthly cashflow live
- Estimated rent
- $2,507 high interval (Pro) →
- Mortgage (P&I)
- −$1,563
- Tax est. 1.5%
- −$372 /mo · $4,470/yr
- Insurance
- −$124
- HOA est. from 3 same-building comps
- −$1,364
- Vacancy / Maint / Mgmt
- −$526
- Net cashflow
- $-1,443
Break-even live
UW: 25.0% down · 7.5% · 30yr · 1.5% tax · 5.0% vac · 8.0% maint · 8.0% mgmt
Financing live
Cash to close
- Down payment
- $74,500
- Closing costs
- $8,940
- Reserves months
- —
- Total cash needed
- —
Loan-product check · same deal, 3 products live
Conventional
25% down · 7.5% · 30yr
- Down + closing
- —
- Monthly P&I
- —
- Monthly cashflow
- —
- DSCR
- —
- Eligible?
- —
Personal DTI + credit; lowest rate.
DSCR
20% down · 8.5% · 30yr
- Down + closing
- —
- Monthly P&I
- —
- Monthly cashflow
- —
- DSCR
- —
- Eligible?
- —
No personal income docs; deal must DSCR.
Hard money
10% down · 12.0% · 12mo
- Down + closing
- —
- Monthly P&I
- —
- Monthly cashflow
- —
- DSCR
- —
- Eligible?
- —
Short-term bridge; refi at stabilization.
Rent comps 8 comps
| Address | Beds | Baths | Sqft | Rent | $/sqft | DOM | Units | Dist |
|---|---|---|---|---|---|---|---|---|
| 232-15 67th Ave Unit 1FL Flushing, NY | 2.0 | 2.0 | 900 | $2,900 | $3.22 | 4d | 1 | 0.85mi |
| 222-40 92nd Rd Unit 2nd Floor Jamaica, NY | 2.0 | 1.0 | 1120 | $3,400 | $3.04 | 14d | 1 | 0.93mi |
| 240-53 68th Ave Unit 1st Floor Douglaston, NY | 2.0 | 1.0 | 900 | $2,500 | $2.78 | 25d | 1 | 1.13mi |
| 76-37 Commonwealth Blvd Unit 2 Jamaica, NY | 1.0 | 1.0 | 641 | $2,200 | $3.43 | 25d | 1 | 1.14mi |
| 245-24 77th Cres Jamaica, NY | 2.0 | 1.0 | 785 | $2,600 | $3.31 | 19d | 1 | 1.16mi |
| 8827 208th St Queens Village, NY | 1.0 | 1.0 | 640 | $1,900 | $2.97 | 25d | 1 | 1.19mi |
| 220-13 Jamaica Ave Queens Village, NY | 2.0 | 1.0 | 800 | $2,400 | $3.00 | 21d | 1 | 1.28mi |
| 214-83 Jamaica Ave Unit 2R Queens Village, NY | 1.0 | 1.0 | 650 | $2,100 | $3.23 | 25d | 1 | 1.31mi |
HOA detail condo
- Monthly dues
- $0 · $0/yr
- Likely covers
- landscapingpool
- Assessments
- None detected in remarks — confirm with the listing agent.
Listing history 18 events
-
2026-06-18days on market $298,000 Active 23 DOM
-
2026-06-17days on market $298,000 Active 22 DOM
-
2026-06-16days on market $298,000 Active 21 DOM
-
2026-06-15days on market $298,000 Active 20 DOM
-
2026-06-13days on market $298,000 Active 18 DOM
-
2026-06-10days on market $298,000 Active 14 DOM
-
2026-06-08days on market $298,000 Active 13 DOM
-
2026-06-08days on market $298,000 Active 12 DOM
-
2026-06-04days on market $298,000 Active 9 DOM
-
2026-06-03days on market $298,000 Active 8 DOM
-
2026-06-02days on market $298,000 Active 7 DOM
-
2026-06-01days on market $298,000 Active 6 DOM
-
2026-05-31days on market $298,000 Active 5 DOM
-
2026-05-26$298,000 Active
-
2019-04-09historical
-
2019-03-31price $288,000
-
2019-03-26price $294,888
-
2019-02-10$299,000 New
ⓘ Source: listings_history table (triggers on properties + properties_extension) + one-shot
backfill from property_details.listing_events for pre-trigger history.
Climate risk First Street
- Flood 1/10 Low FEMA zone X (unshaded) · 0% chance over 30 yrs
- Wildfire 2/10 Low
- Heat 6/10 Major 7 d/yr ≥97°F today · 15 d/yr by 30 yrs out
- Wind 6/10 Major 27% chance of damaging wind over 30 yrs
- Air quality 3/10 Moderate 4 unhealthy d/yr today · 4 by 30 yrs out
Nearby sold comps map
Loading sold comps map…
Walkable amenities ~0.75 mi
Loading nearby amenities…
Taxation est. · year 1
- Rental income
- $30,084
- − Mortgage interest
- −$16,693
- − Property taxes
- −$4,470
- − Insurance
- −$1,490
- − Repairs & maintenance
- −$2,407
- − Management
- −$2,407
- − HOA
- −$16,368
- − Depreciation
- −$8,669
- Taxable loss
- −$22,419
- Est. tax savings @ 24.0%
- +$5,381
- After-tax cash flow
- $-11,934/yr
For passive investors: Depreciation is non-cash, so a rental often shows a tax loss while cash-flowing — sheltering income. Rental losses are passive: they offset passive income freely, and up to $25,000/yr can offset ordinary (W-2) income if you actively participate and your MAGI is under $100k (phasing out to $0 by $150k); unused losses carry forward. On sale, claimed depreciation is recaptured at up to 25%, and gains may owe capital-gains tax (a 1031 exchange can defer both). Figures are a year-1 estimate at your 24.0% rate — not tax advice; consult a CPA.
Schools (NCES district)
No district data.
Livability — New York
- Score
- 75/100
- State rank
- #268
- US rank
- #4188
Category grades
Schools grade is shown separately in the Schools card above.
Census & demographics
- Census place
- New York, NY
- County
- Queens County · 1,914,869 people
- City population
- 7,731,280
- Metro
- New York-Newark-Jersey City, NY-NJ-PA
- Population (ZIP)
- 35,276
- Household income
- $98,359
- Rent vs Own
- Severe rent burden
- 1288.0
Population outlook (Queens County) Hauer SSP2
- Today (2025)
- 2,546,320 people
- By 2030
- 2,643,059 · +3.8%
- By 2040
- 2,815,563 · +10.6%
- By 2050
- 2,944,423 · +15.6%
- By 2075
- 3,123,338 · +22.7%
- By 2100
- 3,098,688 · +21.7%
Race, ethnicity, and origin ACS 2023
- Neighborhood character
- Diverse neighborhood (Simpson 0.64)
- Race & ethnicity
- Asian 50% White 29% Hispanic / Latino 15% Two or more races 7% Black 2%
- Hispanic origin (detail)
- Puerto Rican 3% Dominican 2%
- Common ancestry
- Romanian 2% Scotch-Irish 2% Lithuanian 1%
- Foreign-born
- 44% · China, South Korea, Canada
- Languages at home
- 41% English-only · Chinese 30% Spanish 9% Korean 8%
Political lean MEDSL · Queens
- 2024 margin
- Strong D (+24.6) · D 62.3% · R 37.7%
- 2008→2024 swing
- -26.2pp toward R · 2008: 50.8pp · 2024: 24.6pp
- All cycles
- 2024: D+24.6 2020: D+45.2 2016: D+53.4 2012: D+58.5 2008: D+50.8
Not yet ingested
- Civics
- —
Market trends
- HPI YoY
- ▼ -179.50%
- Current HPI
- 242.5386
- Rent YoY
- ▲ 8.47%
- Metro
- New York-Newark-Jersey City, NY-NJ-PA
- State GDP YoY
- ▲ 2.60%
- F500 in state
- 92
Industry mix (Fortune 500 HQ in NY)
| Industry | F500 HQs | Revenue |
|---|---|---|
| Financial Services | 10 | $950B |
|
||
| Consumer Goods | 9 | $162B |
|
||
| Insurance | 4 | $225B |
|
||
| Telecommunications | 2 | $144B |
|
||
| Pharmaceuticals | 2 | $112B |
|
||
| Media / Entertainment | 2 | $69B |
|
||
Price history
-0.3% since first listed5 events — show timeline
- 2026-05-26 Listed $298,000 OneKey® MLS as Distributed by MLS Grid
- 2019-04-09 Listing Removed — OneKey® MLS as Distributed by MLS Grid
- 2019-03-31 Price Changed $288,000 OneKey® MLS as Distributed by MLS Grid
- 2019-03-26 Price Changed $294,888 OneKey® MLS as Distributed by MLS Grid
- 2019-02-10 Listed $299,000 OneKey® MLS as Distributed by MLS Grid
Cash-flow waterfall
monthlySold comps — $/sqft
last 12 mo · ≤1 miLoading sold comps…