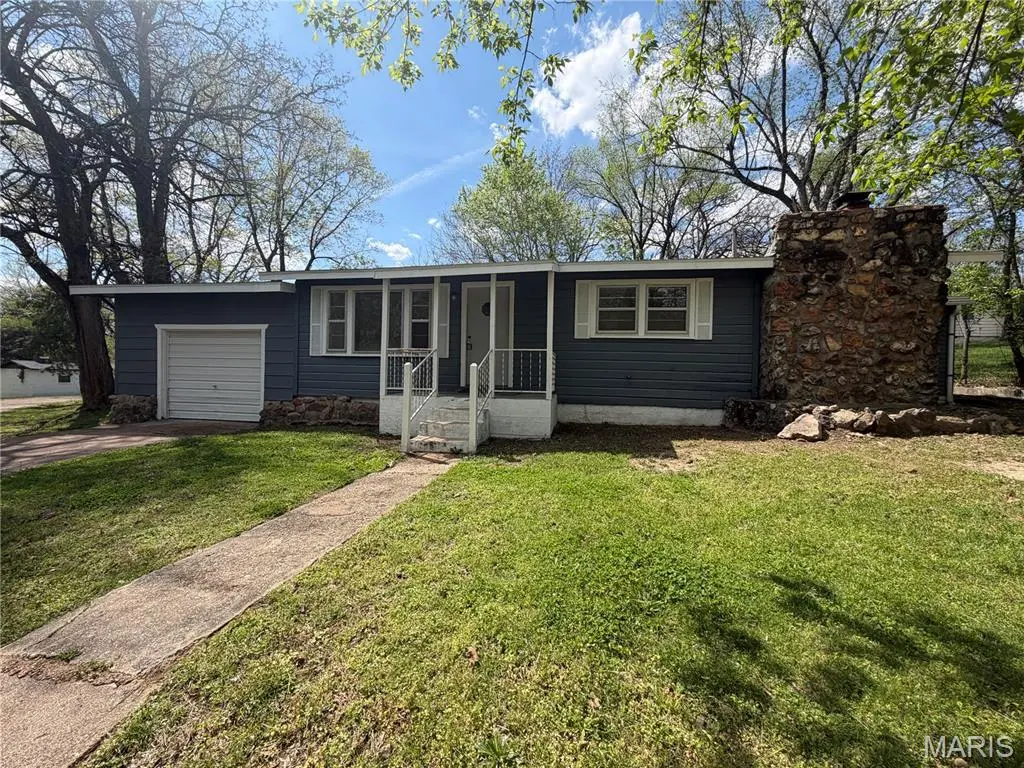
102 Branch Ln · Crocker, MO
Flood risk 9/10 · Severe
- FEMA flood zone
- X (unshaded)
- Chance of flooding over 30 yrs
- 0.99%
- Est. flood insurance / yr
- $507 – $1,088
Fire risk 6/10 · Moderate
- Est. fire insurance / yr
- $1,054 – $1,958
Heat risk 4/10 · Minor
- Hot days now (above 106°F)
- 7 days/yr
- Hot days in 30 yrs
- 19 days/yr
Wind risk 2/10 · Minimal
- Chance of severe wind over 30 yrs
- 1.0%
Air-quality risk 1/10 · Minimal
- Unhealthy air days now
- 0 days/yr
- Unhealthy air days in 30 yrs
- 0 days/yr
Risk factors via First Street. Map © Google.
Why this score? — see what drove the C grade
The composite is a weighted blend of 9 inputs, each scored 0–100. Each bar is that input's sub-score; the figure is the points it added to the 100-point composite (weight × sub-score).
- Cash flow +22.2/30.0
- ARV discount +7.5/15.0
- DSCR +7.1/10.0
- Appreciation +5.0/10.0
- 1% rule +4.7/10.0
- Livability +3.1/5.0
- Rent growth +2.5/5.0
- Condition / age +2.5/5.0
- Schools +2.1/10.0
$95,000
🖨 Deal sheet 📄 Offer letter ✓ Due diligence
Listing remarks
Move-in ready and full of potential, this charming 2-bedroom, 1-bath home is located within the city limits of Crocker in a quiet neighborhood. Inside, you’ll find a cozy den featuring a wood-burning fireplace—perfect for relaxing evenings at home. The property also offers a 1-car garage, a spacious yard with plenty of room to enjoy the outdoors, and a welcoming covered front porch. A new roof installed in 2025 adds peace of mind. Whether you’re looking for your first home, downsizing, or an investment opportunity, this property is ready for your personal touch!
Key facts
- Spacious yard
- Covered front porch
- New roof
Tags
Property features AI
Finance
- Other: Seller may consider concessions
- Financial info: Lease not considered
Exterior
- Parking: Attached garage (1 car); Additional concrete parking
- Utilities: Public water; Public sewer; 220 volt electrical service; Cable available; Electricity connected; Phone connected; Water connected; Sewer connected
- Home design: Single-family residence; One level
- Construction: Frame construction with lap siding; Architectural shingle roof
- Exterior features: Covered porch or patio; Back yard; Front yard; City lot; City street frontage
Interior
- Bedrooms: 2 bedrooms (both on the main level)
- Flooring: Carpet; Hardwood; Linoleum
- Bathrooms: 1 full bathroom (main level)
- Heating & cooling: Baseboard heating; Electric heating; Forced air; Heat pump; Central air conditioning; Electric cooling
- Interior features: Fireplace in the den; Laundry room
- Laundry & utility: Dedicated laundry room
Neighborhood map
What this means for you Summary
Snapshot
- This is a 2-bed/1.0-bath other listed at $95k.
Deal economics
- At list price, monthly cash flow is $88 ($1k/yr) — positive.
- The deal already cash-flows at list — no discount required.
- To meet the 1% rule (rent ≥ 1% of price), the offer needs to be $92k (2.9% below list).
- Recommended offer: $92k (2.9% below list) — sets the bar for 1% rule.
- Cap rate 8.2% vs local median 5.1% in Crocker — top-decile yield for the area; either an underpriced asset or a hidden risk that comps aren't pricing in. Stress-test before assuming the spread holds.
Location & tenants
- Location reads 62/100 on livability (#406 in MO) — a middle-class / working-renter tenant base. Strengths: crime A+, cost of living A+, housing B; Watch: employment D, amenities F, commute F.
- Crocker R-II (rural): math 17% / reading 34% proficiency, ranked #286 of 324 in MO (top 88%) — low school quality limits family demand, transient renter base, plan for 1-2y turnover.
- Zoned schools: Crocker Elem. (math 22% / reading 27%, grade F, #879 of 1,115 statewide, top 81%, 265 students, 89% FRL); Crocker High (math 12% / reading 42%, grade F, #420 of 521 statewide, top 82%, 299 students, 40% FRL) — zoned schools average 64% FRL vs 41% district-wide (23 pts higher); higher-poverty schools than district average — tighter screening recommended.
- Market conditions: 39 active listings in the ZIP; 62 units permitted in Pulaski County in 2024 (0 in 5+ unit buildings).
Forward outlook
- In year one you build about $606 of equity ($657 loan paydown + $-51 appreciation (-0.1% local appreciation)).
- At projected returns (-0.1% appreciation + 3.0% rent growth), your $27k cash investment doubles in ~10 years — after that, you're playing with house money.
Negotiation context
- It's been on market 18 days — a 2% lower offer ($94k) is reasonable based on typical stale-listing flexibility.
- 4 sale attempts with the ask held roughly flat each time — persistent listings suggest the price (not the market) is what's stuck; bring a comps-based counter.
Risks & watch-outs
- Watch-outs: flood insurance adds $66/mo.
- Climate carrying-cost: severe flood risk; major wildfire risk — expect insurance premiums to compound above CPI over the hold.
Questions for the listing agent
- Built in 1965 — when were the roof, HVAC, electrical panel, plumbing, and water heater last replaced?
- What's the actual annual flood-insurance premium (NFIP or private), and is the property in a SFHA with mandatory coverage?
- Is there a deadline driving the sale (1031 exchange, divorce, estate, relocation)? That informs how much negotiation room exists.
- Schools are F-rated, which usually means shorter tenancies and higher turnover. Who's the typical renter profile here, and what's been the actual vacancy rate?
- What's the average days-on-market for RENTAL listings here right now (not sales)? A rising rental-DOM trend means longer vacancies and softer asking-rent achievability than the comps imply.
- What's the recent tenant-quality profile in this submarket — average credit score on applications, eviction rate, late-payment / NSF rate, and stable-employment percentage? A property-management company in the area should have these aggregated.
- How much new for-sale + rental construction is in the pipeline within 1–3 miles? Heavy new supply typically softens prices + rents 12–24 months out; constrained supply supports both.
Investment metrics
- 1% rule
- 0.97% ✗
- Cap rate
- 8.24%
- Cash-on-cash
- 6.97%
- DSCR
- 1.31
- GRM
- 8.6
CMA / ARV
No comps found within radius.
Projected returns pro-forma
-0.05% appreciation · 3.0% rent growth · sell at horizon
- IRR
- 2.1%
- Equity multiple
- 1.10×
- Total profit
- $2,597
- Equity at exit
- $27,332
- IRR
- 7.6%
- Equity multiple
- 1.82×
- Total profit
- $21,697
- Equity at exit
- $32,653
Cash invested: $26,600 (down + closing). Projections, not guarantees.
Landlord ↔ Tenant lean methodology
- Overall (STATE)
- 81 Strongly Landlord-Friendly
- State Missouri
- 81 Strongly Landlord-Friendly · R+10
- County
- — inherits STATE
- City
- — inherits STATE
ZIP-level market 65452
- Home prices YoY
- -0.0%
- Active inventory
- 39
- Price-to-rent
- 8.6×
Monthly cashflow live
- Estimated rent
- $922 medium interval (Pro) →
- Mortgage (P&I)
- −$498
- Tax from tax record
- −$36 /mo · $436/yr
- Insurance
- −$40
- Flood insurance flood zone
- −$66 /mo · $798/yr
- HOA
- −$0
- Vacancy / Maint / Mgmt
- −$194
- Net cashflow
- $88
Break-even live
UW: 25.0% down · 7.5% · 30yr · 1.5% tax · 5.0% vac · 8.0% maint · 8.0% mgmt
Financing live
Cash to close
- Down payment
- $23,750
- Closing costs
- $2,850
- Reserves months
- —
- Total cash needed
- —
Loan-product check · same deal, 3 products live
Conventional
25% down · 7.5% · 30yr
- Down + closing
- —
- Monthly P&I
- —
- Monthly cashflow
- —
- DSCR
- —
- Eligible?
- —
Personal DTI + credit; lowest rate.
DSCR
20% down · 8.5% · 30yr
- Down + closing
- —
- Monthly P&I
- —
- Monthly cashflow
- —
- DSCR
- —
- Eligible?
- —
No personal income docs; deal must DSCR.
Hard money
10% down · 12.0% · 12mo
- Down + closing
- —
- Monthly P&I
- —
- Monthly cashflow
- —
- DSCR
- —
- Eligible?
- —
Short-term bridge; refi at stabilization.
Listing history 13 events
-
2026-06-19days on market $95,000 Active 18 DOM
-
2026-06-18days on market $95,000 Active 17 DOM
-
2026-06-17days on market $95,000 Active 16 DOM
-
2026-06-16days on market $95,000 Active 15 DOM
-
2026-06-15days on market $95,000 Active 14 DOM
-
2026-06-14days on market $95,000 Active 12 DOM
-
2026-06-12days on market $95,000 Active 11 DOM
-
2026-06-09days on market $95,000 Active 8 DOM
-
2026-06-08days on market $95,000 Active 7 DOM
-
2026-06-07days on market $95,000 Active 6 DOM
-
2026-06-07days on market $95,000 Active 5 DOM
-
2026-06-02remarks 568-char remark
-
2026-06-02$95,000 Active 1 DOM
ⓘ Source: listings_history table (triggers on properties + properties_extension) + one-shot
backfill from property_details.listing_events for pre-trigger history.
Tax reassessment forecast MO · Resets to sale price
- Current annual tax
- $436 · $36/mo
- Projected year-2 tax
- $922 · $77/mo
- Expected delta
- +$485/yr (+$40/mo · 111.3%)
ⓘ Screening estimate from a state-policy table — verify with the county assessor before closing.
Climate risk First Street
- Flood 9/10 Extreme FEMA zone X (unshaded) · 99% chance over 30 yrs
- Wildfire 6/10 Major
- Heat 4/10 Moderate 7 d/yr ≥106°F today · 19 d/yr by 30 yrs out
- Wind 2/10 Low 100% chance of damaging wind over 30 yrs
- Air quality 1/10 Low 0 unhealthy d/yr today · 0 by 30 yrs out
Nearby sold comps map
Loading sold comps map…
Walkable amenities ~0.75 mi
Loading nearby amenities…
Taxation est. · year 1
- Rental income
- $11,068
- − Mortgage interest
- −$5,321
- − Property taxes
- −$436
- − Insurance
- −$1,272
- − Repairs & maintenance
- −$885
- − Management
- −$885
- − Depreciation
- −$2,764
- Taxable loss
- −$496
- Est. tax savings @ 24.0%
- +$119
- After-tax cash flow
- $1,176/yr
For passive investors: Depreciation is non-cash, so a rental often shows a tax loss while cash-flowing — sheltering income. Rental losses are passive: they offset passive income freely, and up to $25,000/yr can offset ordinary (W-2) income if you actively participate and your MAGI is under $100k (phasing out to $0 by $150k); unused losses carry forward. On sale, claimed depreciation is recaptured at up to 25%, and gains may owe capital-gains tax (a 1031 exchange can defer both). Figures are a year-1 estimate at your 24.0% rate — not tax advice; consult a CPA.
Schools (NCES district)
- District
- Crocker R-II
- NCES district ID
- 2910350
- Math proficiency
- 17% ▼ -6.00%
- Reading proficiency
- 34% ▼ -5.00%
- Median HH income
- $37,897
- Composite
- 21.25/100
- National rank
- #8399
- State rank
- #286 of 324 in MO
Livability — Crocker
- Score
- 62/100
- State rank
- #406
- US rank
- #17255
Category grades
Schools grade is shown separately in the Schools card above.
Census & demographics
- Census place
- Crocker, MO
- Population (ZIP)
- 2,544
Population outlook (Pulaski County) Hauer SSP2
- Today (2025)
- 54,214 people
- By 2030
- 54,723 · +0.9%
- By 2040
- 54,885 · +1.2%
- By 2050
- 55,467 · +2.3%
- By 2075
- 58,576 · +8.0%
- By 2100
- 61,179 · +12.8%
Race, ethnicity, and origin ACS 2023
- Neighborhood character
- Predominantly White (93%)
- Race & ethnicity
- White 93% Two or more races 4% Hispanic / Latino 4%
- Common ancestry
- Slovak 3% Romanian 2% Portuguese 2%
- Foreign-born
- 0%
Political lean MEDSL · Pulaski
- 2024 margin
- Solid R (+50.3) · D 24.2% · R 74.5% · Other 1.3%
- 2008→2024 swing
- -21.6pp toward R · 2008: -28.7pp · 2024: -50.3pp
- All cycles
- 2024: R+50.3 2020: R+45.7 2016: R+51.7 2012: R+36.1 2008: R+28.7
Not yet ingested
- Civics
- —
Market trends
- HPI YoY
- ▼ -0.05%
- Current HPI
- 202.1396
- Rent YoY
- —
- Metro
- —
- State GDP YoY
- ▲ 1.84%
- F500 in state
- 20
Industry mix (Fortune 500 HQ in MO)
| Industry | F500 HQs | Revenue |
|---|---|---|
| Healthcare | 1 | $163B |
|
||
| Insurance | 1 | $21B |
|
||
| Industrial Technology | 1 | $17B |
|
||
| Retail | 1 | $16B |
|
||
| Industrial Distribution | 1 | $10B |
|
||
| Utilities | 1 | $9B |
|
||
Price history
-17.3% since first listed8 events — show timeline
- 2026-06-01 Listed $95,000 MARIS as Distributed by MLS Grid
- 2026-04-28 Relisted — MARIS as Distributed by MLS Grid
- 2026-04-14 Pending — MARIS as Distributed by MLS Grid
- 2026-03-05 Price Changed $104,900 MARIS as Distributed by MLS Grid
- 2025-11-17 Listed $114,900 MARIS as Distributed by MLS Grid
- 2025-10-20 Listed $114,900 MARIS as Distributed by MLS Grid
- 2025-10-20 Coming Soon — MARIS as Distributed by MLS Grid
- 2007-10-12 Sold (Public Records) — Public Records
Property tax history
+1.5%/yrLatest (2025): $436 · +10.8% YoY. Source: county tax records.
Cash-flow waterfall
monthlySold comps — $/sqft
last 12 mo · ≤1 miLoading sold comps…