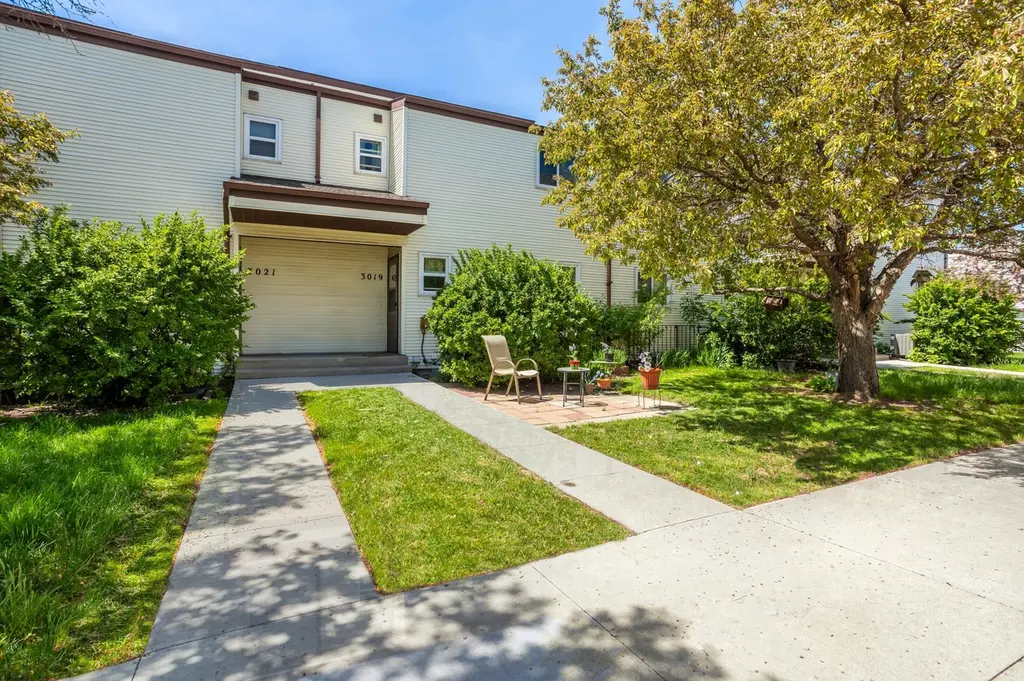
3019 18th St S · Moorhead, MN
Flood risk 1/10 · Minimal
- FEMA flood zone
- X (unshaded)
- Chance of flooding over 30 yrs
- 0.0%
- Est. flood insurance / yr
- $473 – $860
Fire risk 1/10 · Minimal
- Est. fire insurance / yr
- $888 – $1,650
Heat risk 2/10 · Minimal
- Hot days now (above 98°F)
- 7 days/yr
- Hot days in 30 yrs
- 12 days/yr
Wind risk 2/10 · Minimal
- Chance of severe wind over 30 yrs
- —
Air-quality risk 3/10 · Minor
- Unhealthy air days now
- 3 days/yr
- Unhealthy air days in 30 yrs
- 3 days/yr
Risk factors via First Street. Map © Google.
Why this score? — see what drove the D grade
The composite is a weighted blend of 9 inputs, each scored 0–100. Each bar is that input's sub-score; the figure is the points it added to the 100-point composite (weight × sub-score).
- Cash flow +12.6/30.0
- ARV discount +7.5/15.0
- 1% rule +4.4/10.0
- Livability +3.9/5.0
- DSCR +3.8/10.0
- Schools +3.7/10.0
- Rent growth +2.9/5.0
- Condition / age +2.5/5.0
- Appreciation +0.0/10.0
$182,500
🖨 Deal sheet 📄 Offer letter ✓ Due diligence
Listing remarks MLS
Beautifully updated and meticulously maintained! This 2 bed, 2 bath condo is ready for you to move in! You'll enjoy new kitchen cabinets, updated AC, and new patio doors. The master bedroom is spacious and offers a deck for you to relax on. Lower level features a family room with new wood flooring and an egress window for a future 3rd bedroom. New garage door will be installed. Schedule a showing before this one is gone!
Key facts
- $175 HOA
- 2 garage spots
- Built 1978
Property features AI
Finance
- Financial info: Conventional financing typical (mortgage type listed)
- HOA & community: Part of Country Squire Townhouse Condominiums; Monthly association fee of $175; HOA covers lawn care, grounds maintenance, and snow removal; Common garden amenity
Exterior
- Parking: Attached garage with 2 parking spaces
- Utilities: City water connected; City sewer connected; Natural gas
- Home design: Residential attached property (townhouse/condo style); Two levels; Block foundation; Asphalt roof
- Construction: Block foundation; Asphalt roof; Vinyl siding
- Exterior features: Vinyl exterior; Deck, patio, and porch; Irregular lot frontage on a city street; Publicly maintained road access
Interior
- Kitchen: Range; Microwave; Refrigerator; Dishwasher
- Bedrooms: 3 bedrooms (includes main and upper level configuration)
- Bathrooms: One full bathroom (upper level); One half bathroom (main level)
- Heating & cooling: Forced air heating; Central air conditioning
- Interior features: Finished basement; Ceiling fan(s); Kitchen window; Informal dining area; Balcony, deck, patio, and porch
- Laundry & utility: Washer and dryer; Laundry room on lower level; Electric water heater; Utility room
Neighborhood map
What this means for you Summary
Snapshot
- This is a 3-bed/2.0-bath townhouse listed at $182k.
Deal economics
- At list price, monthly cash flow is $-23 ($-272/yr) — negative.
- To cash-flow at today's rent, offer at most $178k (2.2% below list).
- To meet the 1% rule (rent ≥ 1% of price), the offer needs to be $171k (6.3% below list).
- Recommended offer: $171k (6.3% below list) — sets the bar for 1% rule.
- Cap rate 6.1% vs local median 3.7% in Moorhead — top-decile yield for the area; either an underpriced asset or a hidden risk that comps aren't pricing in. Stress-test before assuming the spread holds.
Location & tenants
- Location reads 77/100 on livability (#143 in MN, #3,111 nationally) — a middle-class / working-renter tenant base. Strengths: housing A+, health & safety A+, cost of living A-; Watch: crime C-, amenities F, commute F.
- Moorhead Public School District (suburban): math 39% / reading 46% proficiency, ranked #202 of 301 in MN (top 67%) — families likely to look elsewhere, expect single-tenant / working-renter base with shorter leases.
- Market conditions: Rents rising (+1.4%/yr); 390 active listings in the ZIP; 19 comparable units currently listed for rent nearby; rentals at typical pace (median 21d on market — plan ~3-4 weeks tenant-placement turnaround); 42% of comp listings sitting > 30 days — soft ceiling on asking rent; solid renter incomes; 269 units permitted in Clay County in 2024 (153 in 5+ unit buildings).
Forward outlook
- Local home prices are declining (-3.0%/yr); year-one equity from $1k of loan paydown is wiped out by about $5k of value loss. Plan a longer hold.
- Clay County population projected at +23% by 2050 — long-run rental-demand tailwind backs the buy-and-hold thesis.
Negotiation context
- It's been on market 16 days — a 2% lower offer ($180k) is reasonable based on typical stale-listing flexibility.
- 3 sale attempts since 5y ago with the ask held roughly flat each time — persistent listings suggest the price (not the market) is what's stuck; bring a comps-based counter.
- Current owner paid $145k; 26% above their basis — modest negotiation headroom, anchor on the comps not their cost.
Questions for the listing agent
- What do current leases actually rent for vs. the listed asking? Can we see a recent rent roll and the last 12 months of T-12 income?
- Built in 1978 — when were the roof, HVAC, electrical panel, plumbing, and water heater last replaced?
- What does the HOA fee cover, when was the last increase, and are there any pending special assessments or reserve-fund shortfalls?
- Is there a deadline driving the sale (1031 exchange, divorce, estate, relocation)? That informs how much negotiation room exists.
- Schools are B-rated — typically a magnet for longer-tenancy family renters. What's the average tenant stay here, and is there a school-zone premium baked into asking?
- The area grade is low — what's the realistic commute time and amenity access for the typical tenant pool here? Any planned neighborhood developments (good or bad) we should know about?
- What's the average days-on-market for RENTAL listings here right now (not sales)? A rising rental-DOM trend means longer vacancies and softer asking-rent achievability than the comps imply.
- What's the recent tenant-quality profile in this submarket — average credit score on applications, eviction rate, late-payment / NSF rate, and stable-employment percentage? A property-management company in the area should have these aggregated.
- How much new for-sale + rental construction is in the pipeline within 1–3 miles? Heavy new supply typically softens prices + rents 12–24 months out; constrained supply supports both.
Investment metrics
- 1% rule
- 0.94% ✗
- Cap rate
- 6.14%
- Cash-on-cash
- -0.53%
- DSCR
- 0.98
- GRM
- 8.9
CMA / ARV
No comps found within radius.
Projected returns pro-forma
-3.0% appreciation · 1.41% rent growth · sell at horizon
- IRR
- -19.1%
- Equity multiple
- 0.34×
- Total profit
- $-33,614
- Equity at exit
- $27,211
- IRR
- -15.5%
- Equity multiple
- 0.19×
- Total profit
- $-41,448
- Equity at exit
- $15,779
Cash invested: $51,100 (down + closing). Projections, not guarantees.
Landlord ↔ Tenant lean methodology
- Overall (STATE)
- 46 Balanced
- State Minnesota
- 46 Balanced · D+2
- County
- — inherits STATE
- City
- — inherits STATE
ZIP-level market 56560
- Rents YoY
- 1.4%
- Active inventory
- 390
- Price-to-rent
- 8.9×
Monthly cashflow live
- Estimated rent
- $1,710 high interval (Pro) →
- Mortgage (P&I)
- −$957
- Tax from tax record
- −$166 /mo · $1,990/yr
- Insurance
- −$76
- HOA
- −$175
- Vacancy / Maint / Mgmt
- −$359
- Net cashflow
- $-23
Break-even live
UW: 25.0% down · 7.5% · 30yr · 1.5% tax · 5.0% vac · 8.0% maint · 8.0% mgmt
Financing live
Cash to close
- Down payment
- $45,625
- Closing costs
- $5,475
- Reserves months
- —
- Total cash needed
- —
Loan-product check · same deal, 3 products live
Conventional
25% down · 7.5% · 30yr
- Down + closing
- —
- Monthly P&I
- —
- Monthly cashflow
- —
- DSCR
- —
- Eligible?
- —
Personal DTI + credit; lowest rate.
DSCR
20% down · 8.5% · 30yr
- Down + closing
- —
- Monthly P&I
- —
- Monthly cashflow
- —
- DSCR
- —
- Eligible?
- —
No personal income docs; deal must DSCR.
Hard money
10% down · 12.0% · 12mo
- Down + closing
- —
- Monthly P&I
- —
- Monthly cashflow
- —
- DSCR
- —
- Eligible?
- —
Short-term bridge; refi at stabilization.
Rent comps 19 comps
| Address | Beds | Baths | Sqft | Rent | $/sqft | DOM | Units | Dist |
|---|---|---|---|---|---|---|---|---|
| 3046 18th St S Moorhead, MN | 2.0 | 1.5 | 1250 | $1,025 | $0.82 | 43d | 1 | 0.06mi |
| 3540 18th St S Moorhead, MN | 1.0–3.0 | 1.0–2.0 | 1032 | $1,495 | $1.45 | 13d | 17 | 0.25mi |
| 1501 Belsly Blvd Moorhead, MN | 2.0–3.0 | 2.0 | 1226 | $1,550 | $1.26 | 13d | 5 | 0.30mi |
| 3890 19th St S Moorhead, MN | 4.0 | 2.0 | 2176 | $2,345 | $1.08 | 13d | 1 | 0.56mi |
| 1730 40th Ave S Moorhead, MN | 1.0–3.0 | 1.0–2.0 | 1080 | $1,295 | $1.20 | 13d | 1 | 0.65mi |
| 1102 28th Ave S Moorhead, MN | 1.0–3.0 | 1.0–2.0 | 1175 | $1,825 | $1.55 | 13d | 35 | 0.69mi |
| 900 30th Ave S Moorhead, MN | 3.0 | 1.0–2.0 | 982 | $1,775 | $1.81 | 21d | 19 | 0.74mi |
| 1113 39th Ave S Moorhead, MN | 3.0 | 2.0 | 1644 | $2,000 | $1.22 | 43d | 1 | 0.85mi |
| 802 37th Ave S Moorhead, MN | 2.0–4.0 | 2.0–2.5 | 1250 | $1,892 | $1.51 | 13d | 5 | 0.90mi |
| 1452 44th Ave S Moorhead, MN | 3.0 | 2.0 | 1842 | $1,895 | $1.03 | 43d | 1 | 0.93mi |
| 600 30th Ave S Moorhead, MN | 3.0 | 1.0–2.0 | 950 | $1,910 | $2.01 | 13d | 34 | 0.96mi |
| 3603 33rd St S Moorhead, MN | 4.0 | 2.0 | 2212 | $2,300 | $1.04 | 43d | 1 | 1.13mi |
| 3615 33rd St S Moorhead, MN | 4.0 | 3.0 | 2163 | $2,550 | $1.18 | 21d | 1 | 1.13mi |
| 3633 33rd St S Moorhead, MN | 4.0 | 3.0 | 2163 | $2,550 | $1.18 | 43d | 1 | 1.14mi |
| 3719 33rd St S Moorhead, MN | 3.0 | 2.0 | 1638 | $2,275 | $1.39 | 21d | 1 | 1.16mi |
| 3719 33rd St S Moorhead, MN | 3.0 | 2.0 | 1638 | $2,350 | $1.43 | 43d | 1 | 1.16mi |
| 4546 13th St S Moorhead, MN | 3.0 | 2.0 | 2310 | $2,095 | $0.91 | 43d | 1 | 1.17mi |
| 4402 Blue Stem Way Moorhead, MN | 3.0 | 2.5 | 2166 | $2,050 | $0.95 | 13d | 6 | 1.18mi |
| 2289 35th Street Cir S Moorhead, MN | 3.0 | 3.0 | 1818 | $1,895 | $1.04 | 43d | 1 | 1.48mi |
HOA detail
- Monthly dues
- $175 · $2,100/yr
Listing history 13 events
-
2026-06-18days on market $182,500 Active 16 DOM
-
2026-06-17days on market $182,500 Active 15 DOM
-
2026-06-16days on market $182,500 Active 14 DOM
-
2026-06-15days on market $182,500 Active 13 DOM
-
2026-06-14days on market $182,500 Active 11 DOM
-
2026-06-13days on market $182,500 Active 10 DOM
-
2026-06-10days on market $182,500 Active 8 DOM
-
2026-06-09days on market $182,500 Active 7 DOM
-
2026-06-08days on market $182,500 Active 6 DOM
-
2026-06-07days on market $182,500 Active 5 DOM
-
2026-06-05days on market $182,500 Active 2 DOM
-
2026-06-03remarks 204-char remark
-
2026-06-03$182,500 Active 1 DOM
ⓘ Source: listings_history table (triggers on properties + properties_extension) + one-shot
backfill from property_details.listing_events for pre-trigger history.
Tax reassessment forecast MN · Partial reset (capped growth)
- Current annual tax
- $1,990 · $166/mo
- Projected year-2 tax
- $2,017 · $168/mo
- Expected delta
- +$27/yr (+$2/mo · 1.4%)
ⓘ Screening estimate from a state-policy table — verify with the county assessor before closing.
Climate risk First Street
- Flood 1/10 Low FEMA zone X (unshaded) · 0% chance over 30 yrs
- Wildfire 1/10 Low
- Heat 2/10 Low 7 d/yr ≥98°F today · 12 d/yr by 30 yrs out
- Wind 2/10 Low
- Air quality 3/10 Moderate 3 unhealthy d/yr today · 3 by 30 yrs out
Nearby sold comps map
Loading sold comps map…
Walkable amenities ~0.75 mi
Loading nearby amenities…
Taxation est. · year 1
- Rental income
- $20,526
- − Mortgage interest
- −$10,223
- − Property taxes
- −$1,990
- − Insurance
- −$912
- − Repairs & maintenance
- −$1,642
- − Management
- −$1,642
- − HOA
- −$2,100
- − Depreciation
- −$5,309
- Taxable loss
- −$3,293
- Est. tax savings @ 24.0%
- +$790
- After-tax cash flow
- $519/yr
For passive investors: Depreciation is non-cash, so a rental often shows a tax loss while cash-flowing — sheltering income. Rental losses are passive: they offset passive income freely, and up to $25,000/yr can offset ordinary (W-2) income if you actively participate and your MAGI is under $100k (phasing out to $0 by $150k); unused losses carry forward. On sale, claimed depreciation is recaptured at up to 25%, and gains may owe capital-gains tax (a 1031 exchange can defer both). Figures are a year-1 estimate at your 24.0% rate — not tax advice; consult a CPA.
Schools (NCES district)
- District
- Moorhead Public School District
- NCES district ID
- 2721420
- Math proficiency
- 39% ▼ -8.00%
- Reading proficiency
- 46% ▼ -6.00%
- Median HH income
- $53,009
- Composite
- 36.83/100
- National rank
- #4560
- State rank
- #202 of 301 in MN
Livability — Moorhead
- Score
- 77/100
- State rank
- #143
- US rank
- #3111
Category grades
Schools grade is shown separately in the Schools card above.
Census & demographics
- Census place
- Moorhead, MN
- County
- Clay County · 44,405 people
- City population
- 44,405
- Metro
- Fargo, ND-MN
- Population (ZIP)
- 44,405
- Household income
- $75,406
- Rent vs Own
- Severe rent burden
- 2229.0
Population outlook (Clay County) Hauer SSP2
- Today (2025)
- 67,880 people
- By 2030
- 70,881 · +4.4%
- By 2040
- 76,865 · +13.2%
- By 2050
- 83,205 · +22.6%
- By 2075
- 98,719 · +45.4%
- By 2100
- 111,657 · +64.5%
Race, ethnicity, and origin ACS 2023
- Neighborhood character
- Predominantly White (81%)
- Race & ethnicity
- White 81% Black 6% Two or more races 6% Hispanic / Latino 6% Asian 2%
- Hispanic origin (detail)
- Mexican 4%
- Common ancestry
- Portuguese 26% Lithuanian 3% Scottish 3%
- Foreign-born
- 6% · Canada, Vietnam
- Languages at home
- 91% English-only · Spanish 2% Other Indo-European 2% Arabic 1%
Political lean MEDSL · Clay
- 2024 margin
- Toss-up / Even · D 49.2% · R 48.8% · Other 2.0%
- 2008→2024 swing
- -15.5pp toward R · 2008: 16.0pp · 2024: 0.5pp
- All cycles
- 2024: D+0.5 2020: D+4.1 2016: R+2.0 2012: D+8.0 2008: D+16.0
Not yet ingested
- Civics
- —
Market trends
- HPI YoY
- ▼ -108.32%
- Current HPI
- 177.038
- Rent YoY
- ▲ 1.41%
- Metro
- Fargo, ND-MN
- State GDP YoY
- ▲ 2.41%
- F500 in state
- 34
Industry mix (Fortune 500 HQ in MN)
| Industry | F500 HQs | Revenue |
|---|---|---|
| Healthcare | 2 | $407B |
|
||
| Retail | 2 | $150B |
|
||
| Consumer Goods | 2 | $32B |
|
||
| Industrial Machinery | 2 | $6B |
|
||
| Agriculture | 1 | $40B |
|
||
| Healthcare / Medical Devices | 1 | $32B |
|
||
Price history
+16.3% since first listed6 events — show timeline
- 2026-06-02 Listed $182,500 NORTHSTARMLS as Distributed by MLS Grid
- 2022-02-28 Sold (Public Records) $145,000 Public Records
- 2022-02-25 Sold (MLS) $145,000 NORTHSTARMLS as Distributed by MLS Grid
- 2021-10-06 Listed $154,500 NORTHSTARMLS as Distributed by MLS Grid
- 2021-08-29 Listing Removed — NORTHSTARMLS as Distributed by MLS Grid
- 2021-04-02 Listed $156,900 NORTHSTARMLS as Distributed by MLS Grid
Property tax history
+6.6%/yrLatest (2026): $1,990 · +12.0% YoY. Source: county tax records.
Cash-flow waterfall
monthlySold comps — $/sqft
last 12 mo · ≤1 miLoading sold comps…