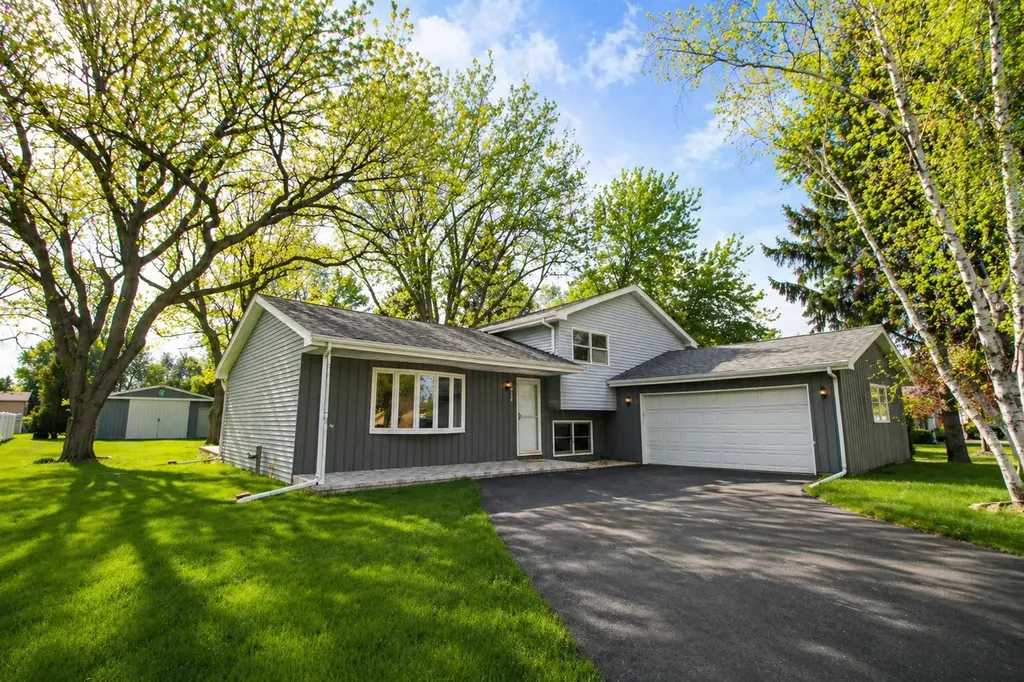
12748 S Elaine Dr · Plainfield, IL
Flood risk 1/10 · Minimal
- FEMA flood zone
- X (unshaded)
- Chance of flooding over 30 yrs
- 0.0%
- Est. flood insurance / yr
- $507 – $1,088
Fire risk 1/10 · Minimal
- Est. fire insurance / yr
- $804 – $1,492
Heat risk 3/10 · Minor
- Hot days now (above 102°F)
- 7 days/yr
- Hot days in 30 yrs
- 15 days/yr
Wind risk 2/10 · Minimal
- Chance of severe wind over 30 yrs
- 1.0%
Air-quality risk 3/10 · Minor
- Unhealthy air days now
- 3 days/yr
- Unhealthy air days in 30 yrs
- 4 days/yr
Risk factors via First Street. Map © Google.
Why this score? — see what drove the D- grade
The composite is a weighted blend of 9 inputs, each scored 0–100. Each bar is that input's sub-score; the figure is the points it added to the 100-point composite (weight × sub-score).
- ARV discount +13.6/15.0
- Cash flow +8.4/30.0
- Livability +3.4/5.0
- Schools +2.9/10.0
- 1% rule +2.7/10.0
- Rent growth +2.5/5.0
- Condition / age +2.5/5.0
- DSCR +2.3/10.0
- Appreciation +0.0/10.0
$405,000
🖨 Deal sheet (PDF) 📄 Offer letter ✓ Due diligence
Listing remarks
Beautifully updated tri-level home on an oversized lot in North Plainfield's Wheatland Plains neighborhood! Newers include fully renovated kitchen and baths, wide luxury vinyl plank in main and bedroom levels, fresh paint, and newer hvac system. Lower level family room with fireplace plus bonus room. There's a 2 car attached garage with 220 hookup, with new garage door opener and a 24 x 24 Cleary shed where you can store all your toys, and tools! Imagine summer fun in your above ground pool with slide, deck and tiki bar! Gorgeous deep and private lot with mature trees, NO hoa rules or fees, and low unincorporated taxes. See it today!
Key facts
- 0.47 acre lot
- 2 garage spots
- Pool
Property features AI
Finance
- Other: Located in the Wheatland Plains subdivision (unincorporated Wheatland township); Lot approximately 0.5–0.99 acre (dimensions 100 x 205); Directions: Rt 30 to 127th to Elaine; Some photos are virtually staged
- HOA & community: No master association fee required
Exterior
- Parking: Attached garage with 2 spaces; Asphalt driveway; Garage door opener; Owned garage
- Utilities: Water from well; Septic tank sewer; Electric with circuit breakers
- Home design: Detached single-family home; Multi-level / Tri-level layout; Fee simple ownership; Rehab completed in 2025; Assessor-reported living area
- Construction: Built approximately 41–50 years ago; Aluminum siding, cedar, and frame construction; Asphalt roof; Concrete perimeter foundation
- Exterior features: Above-ground pool; Deck; Mature trees; Other exterior features
Interior
- Kitchen: Updated kitchen with eating area/table space; Solid surface counters; Range; Microwave; Dishwasher; Refrigerator; Bar fridge
- Bedrooms: Master bedroom on second level (13 x 17); Second bedroom on second level (12 x 12); Third bedroom on second level (10 x 11)
- Flooring: Luxury vinyl flooring in main living areas and bedrooms; Ceramic tile in family room and lower-level bonus room
- Bathrooms: Two full bathrooms
- Heating & cooling: Natural gas forced-air heating; Central air conditioning; Water softener (owned)
- Interior features: Seven total rooms; Family room with fireplace
- Laundry & utility: Laundry room (lower level)
Neighborhood map
What this means for you Summary
Snapshot
- This is a 3-bed/1.5-bath single-family listed at $405k.
Deal economics
- At list price, monthly cash flow is $-366 ($-4k/yr) — negative.
- To cash-flow at today's rent, offer at most $340k (16.0% below list).
- To meet the 1% rule (rent ≥ 1% of price), the offer needs to be $310k (23.5% below list).
- Recommended offer: $310k (23.5% below list) — sets the bar for 1% rule.
- Cap rate 5.2% vs local median 3.8% in Plainfield — top-decile yield for the area; either an underpriced asset or a hidden risk that comps aren't pricing in. Stress-test before assuming the spread holds.
Location & tenants
- Location reads 67/100 on livability (#496 in IL) — a middle-class / working-renter tenant base. Strengths: crime A+, employment A+, housing A+; Watch: amenities F, commute F, cost of living F.
- Plainfield SD 202 (suburban): math 25% / reading 32% proficiency, ranked #213 of 620 in IL (top 34%) — low school quality limits family demand, transient renter base, plan for 1-2y turnover; only 17% free/reduced lunch — higher-income household profile.
- Zoned schools: Walkers Grove Elementary School (math 34% / reading 55%, grade F, #267 of 2,056 statewide, top 15%, 626 students, 0% FRL); Richard Ira Jones Middle School (math 30% / reading 42%, grade F, #182 of 665 statewide, top 28%, 837 students, 0% FRL); Plainfield North High School (math 40% / reading 40%, grade F, #85 of 693 statewide, top 12%, 2,377 students, 0% FRL) — zoned schools average 0% FRL vs 17% district-wide (17 pts lower); this property's tenant base skews higher-income than the district average.
- Market conditions: 223 active listings in the ZIP; 1 comparable units currently listed for rent nearby; 2,028 units permitted in Will County in 2024 (530 in 5+ unit buildings).
Forward outlook
- Local home prices are declining (-3.0%/yr); year-one equity from $3k of loan paydown is wiped out by about $12k of value loss. Plan a longer hold.
- Will County population projected to shrink 4% by 2050 — rents likely to lag national; underwrite the cash flow, not the appreciation.
Negotiation context
- It's been on market 32 days — a 3% lower offer ($393k) is reasonable based on typical stale-listing flexibility.
Questions for the listing agent
- What do current leases actually rent for vs. the listed asking? Can we see a recent rent roll and the last 12 months of T-12 income?
- It's been on market 32 days. Have you received any prior offers? Is the seller open to a 23% concession, seller financing, or rate buy-down credit?
- Built in 1978 — when were the roof, HVAC, electrical panel, plumbing, and water heater last replaced?
- Is there a deadline driving the sale (1031 exchange, divorce, estate, relocation)? That informs how much negotiation room exists.
- The area grade is low — what's the realistic commute time and amenity access for the typical tenant pool here? Any planned neighborhood developments (good or bad) we should know about?
- What's the average days-on-market for RENTAL listings here right now (not sales)? A rising rental-DOM trend means longer vacancies and softer asking-rent achievability than the comps imply.
- What's the recent tenant-quality profile in this submarket — average credit score on applications, eviction rate, late-payment / NSF rate, and stable-employment percentage? A property-management company in the area should have these aggregated.
- How much new for-sale + rental construction is in the pipeline within 1–3 miles? Heavy new supply typically softens prices + rents 12–24 months out; constrained supply supports both.
Investment metrics
- 1% rule
- 0.77% ✗
- Cap rate
- 5.21%
- Cash-on-cash
- -3.88%
- DSCR
- 0.83
- GRM
- 10.9
CMA / ARV
- ARV (median comp)
- $468,398
- List price
- $405,000
- Delta
- -13.54%
- Verdict
- UNDERPRICED
- Comps
- 20 within 1.0 mi
Projected returns pro-forma
-3.0% appreciation · 3.0% rent growth · sell at horizon
- IRR
- -22.8%
- Equity multiple
- 0.22×
- Total profit
- $-88,910
- Equity at exit
- $60,387
- IRR
- -17.1%
- Equity multiple
- 0.05×
- Total profit
- $-107,244
- Equity at exit
- $35,017
Cash invested: $113,400 (down + closing). Projections, not guarantees.
Landlord ↔ Tenant lean methodology
- Overall (STATE)
- 43 Moderately Tenant-Leaning
- State Illinois
- 43 Moderately Tenant-Leaning · D+7
- County
- — inherits STATE
- City
- — inherits STATE
ZIP-level market 60585
- Home prices YoY
- -32.0%
- Active inventory
- 223
- Price-to-rent
- 10.9×
Monthly cashflow live
- Estimated rent
- $3,100 medium interval (Pro) →
- Mortgage (P&I)
- −$2,124
- Tax from tax record
- −$523 /mo · $6,274/yr
- Insurance
- −$169
- HOA
- −$0
- Vacancy / Maint / Mgmt
- −$651
- Net cashflow
- $-366
Break-even live
Sensitivity live
| Price | -10% $-137 | -5% $-252 | +0% $-366 | +5% $-481 | +10% $-596 |
|---|---|---|---|---|---|
| Rent | -10% $-611 | -5% $-489 | +0% $-366 | +5% $-244 | +10% $-122 |
| Rate | -1.0pp $-162 | -0.5pp $-263 | base $-366 | +0.5pp $-471 | +1.0pp $-578 |
UW: 25.0% down · 7.5% · 30yr · 1.5% tax · 5.0% vac · 8.0% maint · 8.0% mgmt
Financing live
Cash to close
- Down payment
- $101,250
- Closing costs
- $12,150
- Reserves months
- —
- Total cash needed
- —
Loan-product check · same deal, 3 products live
Conventional
25% down · 7.5% · 30yr
- Down + closing
- —
- Monthly P&I
- —
- Monthly cashflow
- —
- DSCR
- —
- Eligible?
- —
Personal DTI + credit; lowest rate.
DSCR
20% down · 8.5% · 30yr
- Down + closing
- —
- Monthly P&I
- —
- Monthly cashflow
- —
- DSCR
- —
- Eligible?
- —
No personal income docs; deal must DSCR.
Hard money
10% down · 12.0% · 12mo
- Down + closing
- —
- Monthly P&I
- —
- Monthly cashflow
- —
- DSCR
- —
- Eligible?
- —
Short-term bridge; refi at stabilization.
Rent comps 1 comps
| Address | Beds | Baths | Sqft | Rent | $/sqft | DOM | Units | Dist |
|---|---|---|---|---|---|---|---|---|
| 12919 White Pine Way Plainfield, IL | 3.0 | 2.5 | 1850 | $3,100 | $1.68 | 22d | 1 | 0.79mi |
Listing history 4 events
-
2026-05-05historical Contingent - Continue to Show 645-char remark
-
2026-04-25$405,000 Active 645-char remark
-
2000-10-27soldstatus $175,000
-
1992-03-23soldstatus $128,500
ⓘ Source: listings_history table (triggers on properties + properties_extension) + one-shot
backfill from property_details.listing_events for pre-trigger history.
Tax reassessment forecast IL · Partial reset (capped growth)
- Current annual tax
- $6,274 · $523/mo
- Projected year-2 tax
- $7,734 · $644/mo
- Expected delta
- +$1,460/yr (+$122/mo · 23.3%)
ⓘ Screening estimate from a state-policy table — verify with the county assessor before closing.
Climate risk First Street
- Flood 1/10 Low FEMA zone X (unshaded) · 0% chance over 30 yrs
- Wildfire 1/10 Low
- Heat 3/10 Moderate 7 d/yr ≥102°F today · 15 d/yr by 30 yrs out
- Wind 2/10 Low 100% chance of damaging wind over 30 yrs
- Air quality 3/10 Moderate 3 unhealthy d/yr today · 4 by 30 yrs out
Nearby sold comps map
Loading sold comps map…
Walkable amenities ~0.75 mi
Loading nearby amenities…
Taxation est. · year 1
- Rental income
- $37,200
- − Mortgage interest
- −$22,686
- − Property taxes
- −$6,274
- − Insurance
- −$2,025
- − Repairs & maintenance
- −$2,976
- − Management
- −$2,976
- − Depreciation
- −$11,782
- Taxable loss
- −$11,519
- Est. tax savings @ 24.0%
- +$2,765
- After-tax cash flow
- $-1,633/yr
For passive investors: Depreciation is non-cash, so a rental often shows a tax loss while cash-flowing — sheltering income. Rental losses are passive: they offset passive income freely, and up to $25,000/yr can offset ordinary (W-2) income if you actively participate and your MAGI is under $100k (phasing out to $0 by $150k); unused losses carry forward. On sale, claimed depreciation is recaptured at up to 25%, and gains may owe capital-gains tax (a 1031 exchange can defer both). Figures are a year-1 estimate at your 24.0% rate — not tax advice; consult a CPA.
Schools (NCES district)
- District
- Plainfield SD 202
- NCES district ID
- 1731740
- Math proficiency
- 25% ▼ -16.00%
- Reading proficiency
- 32% ▼ -14.00%
- Median HH income
- $90,706
- Composite
- 28.83/100
- National rank
- #6653
- State rank
- #213 of 620 in IL
Livability — Plainfield
- Score
- 67/100
- State rank
- #496
- US rank
- #10260
Category grades
Schools grade is shown separately in the Schools card above.
Census & demographics
- City population
- 75,140
- Population (ZIP)
- 24,948
Population outlook (Will County) Hauer SSP2
- Today (2025)
- 705,368 people
- By 2030
- 708,154 · +0.4%
- By 2040
- 702,692 · -0.4%
- By 2050
- 680,249 · -3.6%
- By 2075
- 611,990 · -13.2%
- By 2100
- 516,215 · -26.8%
Race, ethnicity, and origin ACS 2023
- Neighborhood character
- Diverse neighborhood (Simpson 0.57)
- Race & ethnicity
- White 63% Asian 15% Black 10% Hispanic / Latino 9% Two or more races 4%
- Hispanic origin (detail)
- Mexican 6% Puerto Rican 1%
- Common ancestry
- Romanian 10% Lithuanian 2% Scotch-Irish 1%
- Foreign-born
- 16% · Canada, China, Vietnam
- Languages at home
- 80% English-only · Other Indo-European 6% Spanish 5% Tagalog/Filipino 2%
Political lean MEDSL · Will
- 2024 margin
- Toss-up / Even · D 50.1% · R 48.5% · Other 1.4%
- 2008→2024 swing
- -11.6pp toward R · 2008: 13.2pp · 2024: 1.6pp
- All cycles
- 2024: D+1.6 2020: D+8.3 2016: D+5.7 2012: D+3.7 2008: D+13.2
Not yet ingested
- Civics
- —
Market trends
- HPI YoY
- ▼ -98.23%
- Current HPI
- 208.5101
- Rent YoY
- —
- Metro
- —
- State GDP YoY
- ▲ 1.59%
- F500 in state
- 60
Industry mix (Fortune 500 HQ in IL)
| Industry | F500 HQs | Revenue |
|---|---|---|
| Insurance | 4 | $201B |
|
||
| Consumer Goods | 4 | $87B |
|
||
| Industrial Machinery | 3 | $64B |
|
||
| Healthcare | 2 | $55B |
|
||
| Retail / Pharmacy | 1 | $148B |
|
||
| Agriculture / Food | 1 | $86B |
|
||
Price history
+215.2% since first listed6 events — show timeline
- 2026-06-01 Sold (MLS) $405,000 MRED as Distributed by MLS Grid
- 2026-05-27 Pending — MRED as Distributed by MLS Grid
- 2026-05-05 Contingent — MRED as Distributed by MLS Grid
- 2026-04-25 Listed $405,000 MRED as Distributed by MLS Grid
- 2000-10-27 Sold (Public Records) $175,000 Public Records
- 1992-03-23 Sold (Public Records) $128,500 Public Records
Property tax history
+2.0%/yrLatest (2024): $6,274 · +6.8% YoY. Source: county tax records.
Cash-flow waterfall
monthlySold comps — $/sqft
last 12 mo · ≤1 miLoading sold comps…