 Duplex
521 48th St · West Palm Beach, FL
Flood risk 5/10 · Moderate
- FEMA flood zone
- X (unshaded)
- Chance of flooding over 30 yrs
- 0.23%
- Est. flood insurance / yr
- $507 – $1,088
Fire risk 1/10 · Minimal
- Est. fire insurance / yr
- $947 – $1,759
Heat risk 10/10 · Severe
- Hot days now (above 105°F)
- 7 days/yr
- Hot days in 30 yrs
- 26 days/yr
Wind risk 10/10 · Severe
- Chance of severe wind over 30 yrs
- 99.0%
Air-quality risk 2/10 · Minimal
- Unhealthy air days now
- 0 days/yr
- Unhealthy air days in 30 yrs
- 1 days/yr
Risk factors via First Street. Map © Google.
Why this score? — see what drove the C+ grade
The composite is a weighted blend of 9 inputs, each scored 0–100. Each bar is that input's sub-score; the figure is the points it added to the 100-point composite (weight × sub-score).
- Cash flow +23.9/30.0
- DSCR +7.7/10.0
- ARV discount +7.5/15.0
- 1% rule +6.2/10.0
- Schools +4.3/10.0
- Livability +4.1/5.0
- Condition / age +4.0/5.0
- Rent growth +3.3/5.0
- Appreciation +0.0/10.0
$669,000
🖨 Deal sheet 📄 Offer letter ✓ Due diligence
Multi-family units
County records classify this as Multi-Family (2-4 Unit). Listing-text estimate: 2 units. confirmed
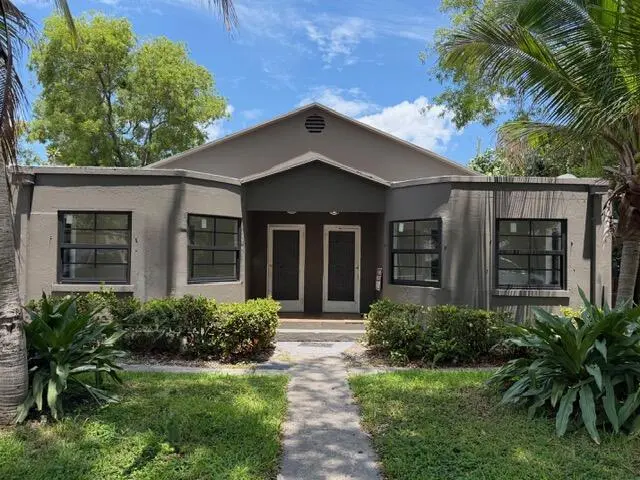
Listing remarks
Turnkey triplex just one block from the Intracoastal offering an incredible investment opportunity in a prime South Florida location. Freshly painted inside and out with new flooring throughout, updated kitchens and bathrooms, and hurricane impact windows for added value and peace of mind. New A/C units. Clean modern interiors with spacious layouts make this property truly move in ready and ideal for immediate rental income. Perfect for investors looking for a low maintenance property with strong income potential or an owner occupant seeking a house hack opportunity. Conveniently located near downtown, beaches, shopping, dining, and waterfront activities. Front duplex can be made into 2/1s.
Key facts
- Spacious layouts
- New a/c units
- Updated kitchens
Tags
Property features AI
Finance
- Other: Asphalt road surface; Publicly maintained road; Not waterfront
- Financial info: 3 total units; Tenants pay cable TV, electricity, sewer and water; Pets allowed (cats and dogs); 3 units in the community
Exterior
- Utilities: Public water; Public sewer; Three-phase electric; Sewer available; Water available; Three separate electric meters
- Home design: Triplex; One story; Resale property; City street frontage
- Construction: Frame construction; Stucco exterior; Concrete block (CBS) construction; Composition roof
- Exterior features: Open patio; Open porch; Patio; Porch; Back yard fencing with gate; Fenced yard
Interior
- Flooring: Tile flooring; Wood flooring; Other flooring
- Heating & cooling: Central heating; Heat pump heating; Window/wall heating; Central air conditioning; Ceiling fans; Ductless cooling; Heat pump cooling; Wall/window units
- Interior features: Satellite dish; Storm windows
Neighborhood map
What this means for you Summary
Snapshot
- This is a 2 × 2-bed/?-bath units multifamily listed at $669k. Condition is rated good.
Deal economics
- At list price, monthly cash flow is $1k ($16k/yr) — positive. Per door: $649/mo.
- The deal already cash-flows at list — no discount required.
- Meets the 1% rule at list price ($7k rent vs $669k).
- Recommended offer: $649k (3.0% below list) — sets the bar for market timing.
- Cap rate 8.6% vs local median 3.8% in West Palm Beach — top-decile yield for the area; either an underpriced asset or a hidden risk that comps aren't pricing in. Stress-test before assuming the spread holds.
Location & tenants
- Location reads 82/100 on livability (#75 in FL, #1,255 nationally) — a professional / high-income tenant draw. Strengths: commute A+, housing A+, health & safety A+; Watch: employment C-, crime F.
- Palm Beach (suburban): math 46% / reading 53% proficiency, ranked #34 of 73 in FL (top 47%) — families likely to look elsewhere, expect single-tenant / working-renter base with shorter leases.
- Zoned schools: Northmore Elementary School (math 34% / reading 29%, grade F, #1,841 of 2,144 statewide, top 86%, 628 students, 73% FRL); John F. Kennedy Middle School (math 28% / reading 29%, grade F, #482 of 571 statewide, top 85%, 826 students, 78% FRL); Palm Beach Lakes High School (math 17% / reading 26%, grade F, #546 of 667 statewide, top 82%, 2,688 students, 70% FRL) — zoned schools average 74% FRL vs 52% district-wide (22 pts higher); higher-poverty schools than district average — tighter screening recommended.
- Zoned-school proficiency averages 27% at this address vs 50% district-wide (-22 pts) — the specific schools serving this property underperform the Palm Beach average; the district grade overstates school quality for this exact location.
- Market conditions: Rents rising (+3.1%/yr); 305 active listings in the ZIP; 35 comparable units currently listed for rent nearby; rentals at typical pace (median 24d on market — plan ~3-4 weeks tenant-placement turnaround); 3,974 units permitted in Palm Beach County in 2024 (1,012 in 5+ unit buildings).
- At $7,496/mo this rent would consume 150% of the median local household income ($60k/yr) (locally 2157% of renters already pay >50% of income on rent) — very limited rent-growth headroom before tenants either downsize or default.
Forward outlook
- Local home prices are declining (-3.0%/yr); year-one equity from $5k of loan paydown is wiped out by about $20k of value loss. Plan a longer hold.
- Palm Beach County population projected at +30% by 2050 — long-run rental-demand tailwind backs the buy-and-hold thesis.
Negotiation context
- It's been on market 35 days — a 3% lower offer ($649k) is reasonable based on typical stale-listing flexibility.
Risks & watch-outs
- Watch-outs: built in 1926 — expect roof / HVAC / electrical / plumbing capex.
- Climate carrying-cost: moderate flood risk; severe wind risk, 99% chance of damaging wind over 30y; extreme-heat days projected 7→26/yr by 2055 (HVAC capex compounding) — expect insurance premiums to compound above CPI over the hold.
Questions for the listing agent
- It's been on market 35 days. Have you received any prior offers? Is the seller open to a 3% concession, seller financing, or rate buy-down credit?
- Can we see the unit-by-unit rent roll, current vacancy, and any below-market leases? What's the average tenancy length?
- What capital expenditures (roof, boiler, parking lot, exteriors) have been made in the last 5 years, and what's planned in the next 2?
- Built in 1926 — when were the roof, HVAC, electrical panel, plumbing, and water heater last replaced?
- Is there a deadline driving the sale (1031 exchange, divorce, estate, relocation)? That informs how much negotiation room exists.
- Crime grade is F in this area — have there been break-ins, vandalism, or insurance claims at this property in the last 3 years? What carrier currently insures it and at what premium?
- What's the average days-on-market for RENTAL listings here right now (not sales)? A rising rental-DOM trend means longer vacancies and softer asking-rent achievability than the comps imply.
- What's the recent tenant-quality profile in this submarket — average credit score on applications, eviction rate, late-payment / NSF rate, and stable-employment percentage? A property-management company in the area should have these aggregated.
- How much new apartment / multifamily construction is in the pipeline within 1–3 miles? Heavy new supply (>2% of stock underway) typically softens rents 12–24 months out; light construction supports rent growth.
Investment metrics
- 1% rule
- 1.12% ✓
- Cap rate
- 8.62%
- Cash-on-cash
- 8.32%
- DSCR
- 1.37
- GRM
- 7.4
CMA / ARV
No comps found within radius.
Projected returns pro-forma
-3.0% appreciation · 3.08% rent growth · sell at horizon
- IRR
- -3.6%
- Equity multiple
- 0.87×
- Total profit
- $-24,986
- Equity at exit
- $99,750
- IRR
- 6.2%
- Equity multiple
- 1.47×
- Total profit
- $87,679
- Equity at exit
- $57,843
Cash invested: $187,320 (down + closing). Projections, not guarantees.
Landlord ↔ Tenant lean methodology
- Overall (STATE)
- 87 Strongly Landlord-Friendly
- State Florida
- 87 Strongly Landlord-Friendly · R+3
- County
- — inherits STATE
- City
- — inherits STATE
ZIP-level market 33407
- Rents YoY
- 3.1%
- Active inventory
- 305
- Price-to-rent
- 14.9×
Monthly cashflow live
- Estimated rent
- $7,496 high interval (Pro) →
- Mortgage (P&I)
- −$3,508
- Tax est. 1.5%
- −$836 /mo · $10,035/yr
- Insurance
- −$279
- HOA
- −$0
- Vacancy / Maint / Mgmt
- −$1,574
- Net cashflow
- $1,299
Break-even live
2-unit breakdown (identical units grouped — click to expand)
| Units | Beds | Baths | Est. rent |
|---|---|---|---|
| 2× units | 2 | — | $7,496 |
| #1 | 2 | — | $3,748 |
| #2 | 2 | — | $3,748 |
| Total (2 units) | $7,496 | ||
UW: 25.0% down · 7.5% · 30yr · 1.5% tax · 5.0% vac · 8.0% maint · 8.0% mgmt
Financing live
Cash to close
- Down payment
- $167,250
- Closing costs
- $20,070
- Reserves months
- —
- Total cash needed
- —
Loan-product check · same deal, 3 products live
Conventional
25% down · 7.5% · 30yr
- Down + closing
- —
- Monthly P&I
- —
- Monthly cashflow
- —
- DSCR
- —
- Eligible?
- —
Personal DTI + credit; lowest rate.
DSCR
20% down · 8.5% · 30yr
- Down + closing
- —
- Monthly P&I
- —
- Monthly cashflow
- —
- DSCR
- —
- Eligible?
- —
No personal income docs; deal must DSCR.
Hard money
10% down · 12.0% · 12mo
- Down + closing
- —
- Monthly P&I
- —
- Monthly cashflow
- —
- DSCR
- —
- Eligible?
- —
Short-term bridge; refi at stabilization.
Rent comps 35 comps
| Address | Beds | Baths | Sqft | Rent | $/sqft | DOM | Units | Dist |
|---|---|---|---|---|---|---|---|---|
| 5101 Spruce Ave West Palm Beach, FL | 3.0 | 3.0 | 1151 | $3,100 | $2.69 | 24d | 1 | 0.14mi |
| 424 51st St Unit 426 West Palm Beach, FL | 3.0 | 2.0 | 1230 | $3,500 | $2.85 | 11d | 1 | 0.16mi |
| 5203 N Flagler Dr West Palm Beach, FL | 3.0 | 1.5 | 1458 | $6,000 | $4.12 | 24d | 1 | 0.22mi |
| 5200 N Flagler Dr West Palm Beach, FL | 2.0 | 2.0 | 1233 | $3,375 | $2.74 | 24d | 2 | 0.26mi |
| 5200 N Flagler Dr #2004 West Palm Beach, FL | 2.0 | 2.0 | 1235 | $3,800 | $3.08 | 7d | 1 | 0.27mi |
| 4444 N Flagler Dr West Palm Beach, FL | 2.0 | 2.0 | 1300 | $4,579 | $3.52 | 24d | 1 | 0.29mi |
| 401 42nd St West Palm Beach, FL | 3.0 | 1.0 | 1100 | $4,950 | $4.50 | 24d | 1 | 0.32mi |
| 401 42nd St West Palm Beach, FL | 3.0 | 1.0 | 1400 | $4,950 | $3.54 | 15d | 1 | 0.32mi |
| 517 55th St West Palm Beach, FL | 2.0 | 2.0 | 1238 | $4,550 | $3.68 | 24d | 1 | 0.38mi |
| 510 56th St West Palm Beach, FL | 2.0 | 1.0 | 1152 | $3,800 | $3.30 | 22d | 1 | 0.40mi |
| 5600 N Flagler Dr West Palm Beach, FL | 1.0–3.0 | 2.0 | 1192 | $4,500 | $3.77 | 20d | 8 | 0.42mi |
| 5820 N Flagler Dr West Palm Beach, FL | 2.0 | 2.0 | 2100 | $4,750 | $2.26 | 24d | 1 | 0.52mi |
| 3940 N Flagler Dr #206 West Palm Beach, FL | 1.0 | 1.0 | 1078 | $3,950 | $3.66 | 4d | 1 | 0.57mi |
| 3940 N Flagler Dr #206 West Palm Beach, FL | 1.0 | 1.0 | 1078 | $3,950 | $3.66 | 4d | 1 | 0.57mi |
| 3940 N Flagler Dr #206 West Palm Beach, FL | 1.0 | 1.0 | 1078 | $4,950 | $4.59 | 24d | 1 | 0.57mi |
| 619 37th St West Palm Beach, FL | 3.0 | 2.0 | 1414 | $3,350 | $2.37 | 24d | 1 | 0.57mi |
| 701 37th St West Palm Beach, FL | 3.0 | 2.0 | 1426 | $3,600 | $2.52 | 24d | 1 | 0.60mi |
| 406 35th St West Palm Beach, FL | 3.0 | 2.0 | 1835 | $8,000 | $4.36 | 24d | 1 | 0.72mi |
| 636 35th St West Palm Beach, FL | 3.0 | 2.0 | 1133 | $3,500 | $3.09 | 24d | 1 | 0.73mi |
| 306 34th St West Palm Beach, FL | 2.0 | 1.0 | 1443 | $4,650 | $3.22 | 24d | 1 | 0.78mi |
| 3410 Poinsettia Ave West Palm Beach, FL | 2.0 | 1.0 | 1257 | $3,350 | $2.67 | 11d | 1 | 0.79mi |
| 3415 N Flagler Dr West Palm Beach, FL | 2.0 | 2.0 | 1174 | $9,950 | $8.48 | 7d | 1 | 0.82mi |
| 517 31st St West Palm Beach, FL | 2.0 | 1.5 | 1406 | $3,150 | $2.24 | 24d | 1 | 0.91mi |
| 216 32nd St West Palm Beach, FL | 3.0 | 3.0 | 1846 | $6,200 | $3.36 | 24d | 1 | 0.94mi |
| 202 32nd St West Palm Beach, FL | 3.0 | 2.0 | 1636 | $5,995 | $3.66 | 24d | 1 | 0.95mi |
| 419 30th St West Palm Beach, FL | 3.0 | 2.5 | 2104 | $7,700 | $3.66 | 24d | 1 | 0.97mi |
| 266 Colonial Ln Palm Beach, FL | 3.0 | 2.5 | 2012 | $45,000 | $22.37 | 24d | 1 | 0.97mi |
| 245 30th St West Palm Beach, FL | 2.0 | 2.0 | 1271 | $9,000 | $7.08 | 24d | 1 | 0.99mi |
| 933 30th Ct West Palm Beach, FL | 3.0 | 1.5 | 1085 | $3,100 | $2.86 | 24d | 1 | 1.03mi |
| 230 Osceola Way Palm Beach, FL | 3.0 | 3.0 | 2225 | $30,000 | $13.48 | 22d | 1 | 1.04mi |
| 230 Colonial Ln Palm Beach, FL | 2.0 | 2.0 | 1436 | $20,000 | $13.93 | 24d | 1 | 1.06mi |
| 119 Seagate Rd Palm Beach, FL | 3.0 | 3.0 | 1513 | $45,000 | $29.74 | 24d | 1 | 1.16mi |
| 411 26th St West Palm Beach, FL | 3.0 | 3.5 | 1847 | $6,900 | $3.74 | 7d | 1 | 1.22mi |
| 2800 N Flagler Dr #404 West Palm Beach, FL | 3.0 | 3.0 | 2063 | $7,200 | $3.49 | 24d | 1 | 1.24mi |
| 2585 Spruce Ave West Palm Beach, FL | 1.0–2.0 | 1.0–2.0 | 841 | $3,225 | $3.83 | 1d | 122 | 1.32mi |
Listing history 14 events
-
2026-06-18days on market $669,000 Active 35 DOM
-
2026-06-17days on market $669,000 Active 34 DOM
-
2026-06-16days on market $669,000 Active 33 DOM
-
2026-06-15days on market $669,000 Active 32 DOM
-
2026-06-13days on market $669,000 Active 30 DOM
-
2026-06-09days on market $669,000 Active 26 DOM
-
2026-06-08days on market $669,000 Active 25 DOM
-
2026-06-07days on market $669,000 Active 24 DOM
-
2026-06-04days on market $669,000 Active 21 DOM
-
2026-06-03days on market $669,000 Active 20 DOM
-
2026-06-02days on market $669,000 Active 19 DOM
-
2026-06-01days on market $669,000 Active 18 DOM
-
2026-05-31days on market $669,000 Active 17 DOM
-
2026-05-14$669,000 Active
ⓘ Source: listings_history table (triggers on properties + properties_extension) + one-shot
backfill from property_details.listing_events for pre-trigger history.
Climate risk First Street
- Flood 5/10 Major FEMA zone X (unshaded) · 23% chance over 30 yrs
- Wildfire 1/10 Low
- Heat 10/10 Extreme 7 d/yr ≥105°F today · 26 d/yr by 30 yrs out
- Wind 10/10 Extreme 99% chance of damaging wind over 30 yrs
- Air quality 2/10 Low 0 unhealthy d/yr today · 1 by 30 yrs out
Nearby sold comps map
Loading sold comps map…
Walkable amenities ~0.75 mi
Loading nearby amenities…
Taxation est. · year 1
- Rental income
- $89,952
- − Mortgage interest
- −$37,474
- − Property taxes
- −$10,035
- − Insurance
- −$3,345
- − Repairs & maintenance
- −$7,196
- − Management
- −$7,196
- − Depreciation
- −$19,462
- Taxable income
- $5,243
- Est. tax owed @ 24.0%
- −$1,258
- After-tax cash flow
- $14,324/yr
For passive investors: Depreciation is non-cash, so a rental often shows a tax loss while cash-flowing — sheltering income. Rental losses are passive: they offset passive income freely, and up to $25,000/yr can offset ordinary (W-2) income if you actively participate and your MAGI is under $100k (phasing out to $0 by $150k); unused losses carry forward. On sale, claimed depreciation is recaptured at up to 25%, and gains may owe capital-gains tax (a 1031 exchange can defer both). Figures are a year-1 estimate at your 24.0% rate — not tax advice; consult a CPA.
Condition & rehab AI · 12 photos
This turnkey triplex is move-in ready with fresh paint, new flooring, and hurricane impact windows, making it ideal for immediate rental income or owner occupancy.
Value-add opportunities
- Both Landscaping and curb appeal — Enhances curb appeal and property value
- Both New flooring — Improves aesthetics and functionality
- Both New paint — Freshens the interior and exterior
- Both New A/C units — Improves comfort and energy efficiency
Renovation cost estimate screening
Value-add ROI direction
- Both Landscaping and curb appeal — Enhances curb appeal and property value ↑
- Both New flooring — Improves aesthetics and functionality ↑
- Both New paint — Freshens the interior and exterior ↑
- Both New A/C units — Improves comfort and energy efficiency ↑
ⓘ Cost ranges are severity-bucket heuristics (US national rule-of-thumb). Get contractor quotes + a written scope before underwriting a rehab budget.
Schools (NCES district)
- District
- Palm Beach
- NCES district ID
- 1201500
- Math proficiency
- 46% ▼ -16.00%
- Reading proficiency
- 53% ▼ -4.00%
- Median HH income
- $53,943
- Composite
- 42.72/100
- National rank
- #3160
- State rank
- #34 of 73 in FL
Livability — West Palm Beach
- Score
- 82/100
- State rank
- #75
- US rank
- #1255
Category grades
Schools grade is shown separately in the Schools card above.
Census & demographics
- Census place
- West Palm Beach, FL
- County
- Palm Beach County · 1,438,312 people
- City population
- 222,012
- Metro
- Miami-Fort Lauderdale-Pompano Beach, FL
- Population (ZIP)
- 34,851
- Household income
- $59,993
- Rent vs Own
- Severe rent burden
- 2157.0
Population outlook (Palm Beach County) Hauer SSP2
- Today (2025)
- 1,637,487 people
- By 2030
- 1,743,255 · +6.5%
- By 2040
- 1,948,712 · +19.0%
- By 2050
- 2,132,979 · +30.3%
- By 2075
- 2,530,027 · +54.5%
- By 2100
- 2,706,979 · +65.3%
Race, ethnicity, and origin ACS 2023
- Neighborhood character
- Diverse neighborhood (Simpson 0.62)
- Race & ethnicity
- Black 54% White 21% Hispanic / Latino 20% Two or more races 13% Asian 2%
- Hispanic origin (detail)
- Mexican 2% Puerto Rican 2% Cuban 2%
- Common ancestry
- Hispanic 8% Lithuanian 1% Romanian 1%
- Foreign-born
- 26% · Canada, Vietnam, Jamaica
- Languages at home
- 72% English-only · Spanish 17% French/Haitian/Cajun 8% Other Indo-European 1%
Political lean MEDSL · Palm Beach
- 2024 margin
- Toss-up / Even · D 50.0% · R 49.2%
- 2008→2024 swing
- -22.1pp toward R · 2008: 22.9pp · 2024: 0.8pp
- All cycles
- 2024: D+0.8 2020: D+12.8 2016: D+15.3 2012: D+17.0 2008: D+22.9
Not yet ingested
- Civics
- —
Market trends
- HPI YoY
- ▼ -299.26%
- Current HPI
- 363.3995
- Rent YoY
- ▲ 3.08%
- Metro
- Miami-Fort Lauderdale-Pompano Beach, FL
- State GDP YoY
- ▲ 3.28%
- F500 in state
- 36
Industry mix (Fortune 500 HQ in FL)
| Industry | F500 HQs | Revenue |
|---|---|---|
| Industrial Technology | 2 | $29B |
|
||
| Insurance | 2 | $17B |
|
||
| Retail | 1 | $60B |
|
||
| Technology Distribution | 1 | $58B |
|
||
| Homebuilding | 1 | $35B |
|
||
| Technology Manufacturing | 1 | $35B |
|
||
Price history
1 event — show timeline
- 2026-05-14 Listed $669,000 Beaches MLS
Cash-flow waterfall
monthlySold comps — $/sqft
last 12 mo · ≤1 miLoading sold comps…