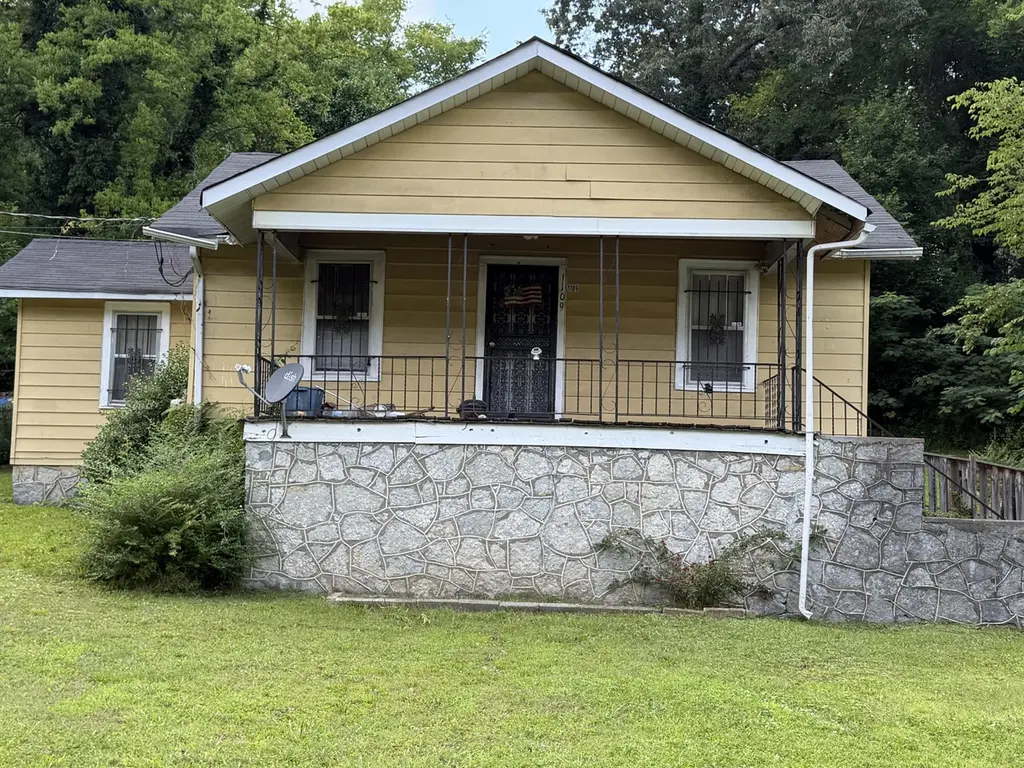
1109 Greenwood Rd · Chattanooga, TN
Flood risk 6/10 · Moderate
- FEMA flood zone
- X (unshaded)
- Chance of flooding over 30 yrs
- 0.74%
- Est. flood insurance / yr
- $507 – $1,088
Fire risk 3/10 · Minor
- Est. fire insurance / yr
- $949 – $1,763
Heat risk 6/10 · Moderate
- Hot days now (above 105°F)
- 7 days/yr
- Hot days in 30 yrs
- 18 days/yr
Wind risk 4/10 · Minor
- Chance of severe wind over 30 yrs
- 13.0%
Air-quality risk 3/10 · Minor
- Unhealthy air days now
- 2 days/yr
- Unhealthy air days in 30 yrs
- 2 days/yr
Risk factors via First Street. Map © Google.
Why this score? — see what drove the B- grade
The composite is a weighted blend of 9 inputs, each scored 0–100. Each bar is that input's sub-score; the figure is the points it added to the 100-point composite (weight × sub-score).
- Cash flow +30.0/30.0
- 1% rule +10.0/10.0
- DSCR +10.0/10.0
- ARV discount +7.5/15.0
- Livability +3.9/5.0
- Rent growth +2.7/5.0
- Schools +2.7/10.0
- Condition / age +2.5/5.0
- Appreciation +0.0/10.0
$44,900
🖨 Deal sheet (PDF) 📄 Offer letter ✓ Due diligence
Listing remarks
This 2-bedroom, 1-bath home. Approximately 1,316 sq ft, this property requires a full rehab and is priced accordingly. Sold strictly AS-IS, with no repairs or concessions from the seller. Investors or buyers ready to take on a project come grab this property and get started.
Key facts
- 0.3 acre lot
- Built 1948
- Listed 2 days
Property features AI
Finance
- HOA & community: No community amenities listed
Exterior
- Parking: Driveway
- Utilities: Public water; Public sewer (sewer connected)
- Home design: Single-family residence; One level
- Construction: Built with other/unspecified construction materials; Block foundation
- Exterior features: Front covered porch; Porch; Fenced yard; No additional exterior features listed
Interior
- Bedrooms: Total of 6 rooms (includes all living spaces)
- Bathrooms: 1 full bathroom
- Heating & cooling: Has cooling (type listed as Other)
- Interior features: Master bedroom located on the main floor; Crawl space foundation
Neighborhood map
What this means for you Summary
Snapshot
- This is a 2-bed/1.0-bath single-family listed at $45k.
Deal economics
- At list price, monthly cash flow is $846 ($10k/yr) — positive.
- The deal already cash-flows at list — no discount required.
- Meets the 1% rule at list price ($1k rent vs $45k).
- Cap rate 28.9% vs local median 3.4% in Chattanooga — top-decile yield for the area; either an underpriced asset or a hidden risk that comps aren't pricing in. Stress-test before assuming the spread holds.
Location & tenants
- Location reads 78/100 on livability (#3 in TN, #2,582 nationally) — a middle-class / working-renter tenant base. Strengths: amenities A+, commute A+, cost of living A+; Watch: employment D+, crime F.
- Hamilton County (urban): math 31% / reading 31% proficiency, ranked #42 of 139 in TN (top 30%) — families likely to look elsewhere, expect single-tenant / working-renter base with shorter leases.
- Zoned schools: Woodmore Elementary (math 22% / reading 17%, grade F, #654 of 952 statewide, top 72%, 301 students, 0% FRL); Dalewood Middle School (math 7% / reading 7%, grade F, #278 of 333 statewide, top 85%, 258 students, 0% FRL); Brainerd High School (math 2% / reading 12%, grade F, #294 of 332 statewide, top 91%, 635 students, 0% FRL) — zoned schools average 0% FRL vs 52% district-wide (52 pts lower); this property's tenant base skews higher-income than the district average.
- Zoned-school proficiency averages 11% at this address vs 31% district-wide (-20 pts) — the specific schools serving this property underperform the Hamilton County average; the district grade overstates school quality for this exact location.
- Market conditions: Rents flat; 129 active listings in the ZIP; 33 comparable units currently listed for rent nearby; rentals at typical pace (median 26d on market — plan ~3-4 weeks tenant-placement turnaround); 2,133 units permitted in Hamilton County in 2024 (405 in 5+ unit buildings).
- This rent runs 31% of the median local income ($57k/yr) — at the standard rent-burdened threshold; future hikes will face affordability resistance.
Forward outlook
- Local home prices are declining (-3.0%/yr); year-one equity from $310 of loan paydown is wiped out by about $1k of value loss. Plan a longer hold.
- Hamilton County population projected at +23% by 2050 — long-run rental-demand tailwind backs the buy-and-hold thesis.
- At projected returns (-3.0% appreciation + 0.7% rent growth), your $13k cash investment doubles in ~2 years — after that, you're playing with house money.
Negotiation context
- Only 2 days on market — expect competitive offers; lowballing is unlikely to land.
Risks & watch-outs
- Watch-outs: built in 1948 — expect roof / HVAC / electrical / plumbing capex.
- Climate carrying-cost: major flood risk; extreme-heat days projected 7→18/yr by 2055 (HVAC capex compounding) — expect insurance premiums to compound above CPI over the hold.
Questions for the listing agent
- Built in 1948 — when were the roof, HVAC, electrical panel, plumbing, and water heater last replaced?
- Is there a deadline driving the sale (1031 exchange, divorce, estate, relocation)? That informs how much negotiation room exists.
- Schools are F-rated, which usually means shorter tenancies and higher turnover. Who's the typical renter profile here, and what's been the actual vacancy rate?
- Crime grade is F in this area — have there been break-ins, vandalism, or insurance claims at this property in the last 3 years? What carrier currently insures it and at what premium?
- What's the average days-on-market for RENTAL listings here right now (not sales)? A rising rental-DOM trend means longer vacancies and softer asking-rent achievability than the comps imply.
- What's the recent tenant-quality profile in this submarket — average credit score on applications, eviction rate, late-payment / NSF rate, and stable-employment percentage? A property-management company in the area should have these aggregated.
- How much new for-sale + rental construction is in the pipeline within 1–3 miles? Heavy new supply typically softens prices + rents 12–24 months out; constrained supply supports both.
Investment metrics
- 1% rule
- 3.20% ✓
- Cap rate
- 28.90%
- Cash-on-cash
- 80.76%
- DSCR
- 4.59
- GRM
- 2.6
CMA / ARV
- ARV (on-the-fly)
- $247,408
- Comps found
- 12
Show comp detail 12 sales within ~0.75 mi
| Address | Dist | Beds/Ba | Sqft | Sold | Price | $/sf | Match |
|---|---|---|---|---|---|---|---|
| 1121 Orangewood Ave | 0.10mi | 3/1.0 (+1) | 1,213 (-8%) | 6mo | $100,000 | $82 | 72 |
| 1117 Belmeade Ave | 0.30mi | 2/1.0 | 1,167 (-11%) | 4mo | $185,000 | $159 | 64 |
| 1212 Greenwood Rd | 0.17mi | 3/2.0 (+1) | 1,350 (+3%) | 22mo | $233,350 | $173 | 61 |
| 1000 Belmeade Ave | 0.34mi | 3/2.0 (+1) | 1,242 (-6%) | 11mo | $255,000 | $205 | 57 |
| 3403 Gay St | 0.33mi | 3/2.0 (+1) | 1,458 (+11%) | 1mo | $152,500 | $105 | 57 |
| 3012 Peggy Ln | 0.14mi | 3/1.0 (+1) | 1,500 (+14%) | 12mo | $282,000 | $188 | 55 |
| 1014 Jarvis Ave | 0.25mi | 3/2.0 (+1) | 1,176 (-11%) | 9mo | $165,000 | $140 | 54 |
| 1028 Overlook Ave | 0.53mi | 3/2.5 (+1) | 1,300 (-1%) | 17mo | $265,000 | $204 | 48 |
| 1112 Overlook Ave | 0.54mi | 3/2.0 (+1) | 1,288 (-2%) | 18mo | $265,000 | $206 | 47 |
| 944 Shallowford Rd | 0.67mi | 3/2.5 (+1) | 1,300 (-1%) | 13mo | $297,000 | $228 | 45 |
| 3604 Wilcox Blvd | 0.65mi | 3/1.0 (+1) | 1,184 (-10%) | 4mo | $145,000 | $122 | 44 |
| 1532 Lillian Ln | 0.61mi | 3/1.0 (+1) | 1,352 (+3%) | 22mo | $259,900 | $192 | 43 |
Match score weights: distance 35% · size 25% · config 20% · recency 20%. Top-matched comps best support the ARV.
Projected returns pro-forma
-3.0% appreciation · 0.73% rent growth · sell at horizon
- IRR
- 78.4%
- Equity multiple
- 4.45×
- Total profit
- $43,408
- Equity at exit
- $6,695
- IRR
- 81.4%
- Equity multiple
- 8.53×
- Total profit
- $94,629
- Equity at exit
- $3,882
Cash invested: $12,572 (down + closing). Projections, not guarantees.
Landlord ↔ Tenant lean methodology
- Overall (STATE)
- 87 Strongly Landlord-Friendly
- State Tennessee
- 87 Strongly Landlord-Friendly · R+13
- County
- — inherits STATE
- City
- — inherits STATE
ZIP-level market 37411
- Rents YoY
- 0.7%
- Active inventory
- 129
- Price-to-rent
- 2.6×
Monthly cashflow live
- Estimated rent
- $1,438 high interval (Pro) →
- Mortgage (P&I)
- −$235
- Tax from tax record
- −$36 /mo · $432/yr
- Insurance
- −$19
- HOA
- −$0
- Vacancy / Maint / Mgmt
- −$302
- Net cashflow
- $846
Break-even live
Sensitivity live
| Price | -10% $871 | -5% $859 | +0% $846 | +5% $833 | +10% $821 |
|---|---|---|---|---|---|
| Rent | -10% $732 | -5% $789 | +0% $846 | +5% $903 | +10% $960 |
| Rate | -1.0pp $869 | -0.5pp $857 | base $846 | +0.5pp $834 | +1.0pp $823 |
UW: 25.0% down · 7.5% · 30yr · 1.5% tax · 5.0% vac · 8.0% maint · 8.0% mgmt
Financing live
Cash to close
- Down payment
- $11,225
- Closing costs
- $1,347
- Reserves months
- —
- Total cash needed
- —
Loan-product check · same deal, 3 products live
Conventional
25% down · 7.5% · 30yr
- Down + closing
- —
- Monthly P&I
- —
- Monthly cashflow
- —
- DSCR
- —
- Eligible?
- —
Personal DTI + credit; lowest rate.
DSCR
20% down · 8.5% · 30yr
- Down + closing
- —
- Monthly P&I
- —
- Monthly cashflow
- —
- DSCR
- —
- Eligible?
- —
No personal income docs; deal must DSCR.
Hard money
10% down · 12.0% · 12mo
- Down + closing
- —
- Monthly P&I
- —
- Monthly cashflow
- —
- DSCR
- —
- Eligible?
- —
Short-term bridge; refi at stabilization.
Rent comps 33 comps
| Address | Beds | Baths | Sqft | Rent | $/sqft | DOM | Units | Dist |
|---|---|---|---|---|---|---|---|---|
| 1203 Rockway Dr Unit 2 Chattanooga, TN | 2.0 | 1.0 | 940 | $1,250 | $1.33 | 16d | 1 | 0.18mi |
| 1205 Tunnel Blvd Chattanooga, TN | 3.0 | 1.0 | 1044 | $1,350 | $1.29 | 25d | 1 | 0.36mi |
| 822 Gillespie Rd Chattanooga, TN | 2.0 | 1.0 | 1000 | $1,550 | $1.55 | 16d | 1 | 0.58mi |
| 2709 Citico Ave Chattanooga, TN | 2.0–3.0 | 1.0 | 1038 | $1,225 | $1.18 | 25d | 1 | 0.60mi |
| 802 Aubrey Ave Unit 1 Chattanooga, TN | 3.0 | 1.5 | 1248 | $1,495 | $1.20 | 16d | 1 | 0.75mi |
| 1635 Dogwood Dr Chattanooga, TN | 3.0 | 1.0 | 1024 | $1,600 | $1.56 | 16d | 1 | 0.76mi |
| 619 Shannon Ave Chattanooga, TN | 2.0 | 1.0 | 962 | $1,250 | $1.30 | 25d | 1 | 0.79mi |
| 907 Sylvan Dr Chattanooga, TN | 3.0 | 2.0 | 1248 | $1,495 | $1.20 | 25d | 1 | 0.83mi |
| 409 Booth Rd Chattanooga, TN | 3.0 | 2.0 | 1530 | $1,695 | $1.11 | 25d | 1 | 0.84mi |
| 3911 Wilsonia Ave Chattanooga, TN | 3.0 | 1.5 | 1143 | $1,395 | $1.22 | 25d | 1 | 0.89mi |
| 3916 Blanchard St Chattanooga, TN | 3.0 | 2.0 | 1056 | $1,445 | $1.37 | 25d | 1 | 0.92mi |
| 719 McGowan Ave Chattanooga, TN | 1.0 | 1.0 | 915 | $855 | $0.93 | 16d | 1 | 0.92mi |
| 3301 Pinewood Ave Chattanooga, TN | 2.0 | 1.0 | 900 | $1,094 | $1.22 | 25d | 3 | 0.92mi |
| 210 Buena Vista Dr Unit 4 Chattanooga, TN | 2.0 | 1.5 | 1500 | $1,495 | $1.00 | 25d | 1 | 0.96mi |
| 1706 Wheeler Ave Chattanooga, TN | 3.0 | 1.0 | 1317 | $1,625 | $1.23 | 25d | 1 | 1.01mi |
| 1601 Arlington Ave Chattanooga, TN | 3.0 | 1.0 | 1416 | $1,650 | $1.17 | 16d | 1 | 1.05mi |
| 310 Gillespie Rd Chattanooga, TN | 2.0 | 1.0 | 1225 | $1,650 | $1.35 | 25d | 1 | 1.09mi |
| 30 Woodlawn Dr Unit C Chattanooga, TN | 2.0 | 2.0 | 1000 | $1,200 | $1.20 | 25d | 1 | 1.16mi |
| 2105 Rawlings St Chattanooga, TN | 3.0 | 1.0 | 1064 | $1,300 | $1.22 | 16d | 1 | 1.17mi |
| 3715 Rollingwood Dr Chattanooga, TN | 3.0 | 1.5 | 1200 | $1,400 | $1.17 | 25d | 1 | 1.18mi |
| 4224 Victory St Chattanooga, TN | 3.0 | 2.0 | 1736 | $1,995 | $1.15 | 25d | 1 | 1.22mi |
| 2011 Milne St Unit b Chattanooga, TN | 3.0 | 1.0 | 976 | $1,345 | $1.38 | 16d | 1 | 1.24mi |
| 300 Crestway Dr Chattanooga, TN | 2.0 | 1.0 | 1164 | $1,675 | $1.44 | 16d | 1 | 1.24mi |
| 2323 Green Forest Dr Chattanooga, TN | 2.0 | 2.5 | 1404 | $1,750 | $1.25 | 16d | 1 | 1.26mi |
| 1409 Bradt St Chattanooga, TN | 3.0 | 1.0 | 960 | $1,275 | $1.33 | 25d | 1 | 1.26mi |
| 2420 Vine St Chattanooga, TN | 3.0 | 1.0 | 1260 | $1,800 | $1.43 | 25d | 1 | 1.29mi |
| 2009 Camden St Chattanooga, TN | 3.0 | 1.5 | 1148 | $1,450 | $1.26 | 25d | 1 | 1.29mi |
| 2009 Taylor St Chattanooga, TN | 3.0 | 1.5 | 1800 | $1,950 | $1.08 | 25d | 1 | 1.32mi |
| 1908 Robbins St Chattanooga, TN | 3.0 | 2.0 | 1783 | $1,750 | $0.98 | 16d | 1 | 1.35mi |
| 708 Henderson Dr Chattanooga, TN | 3.0 | 1.0 | 1100 | $1,250 | $1.14 | 16d | 1 | 1.41mi |
| 2400 Crutchfield St Chattanooga, TN | 3.0 | 1.0 | 984 | $1,200 | $1.22 | 23d | 1 | 1.43mi |
| 745 Henderson Dr Chattanooga, TN | 3.0 | 2.0 | 1275 | $1,495 | $1.17 | 25d | 1 | 1.44mi |
| 2425 Chamberlain Ave Chattanooga, TN | 3.0 | 2.0 | 1422 | $1,795 | $1.26 | 25d | 1 | 1.49mi |
Listing history 2 events
-
2026-06-14remarks 275-char remark
-
2026-06-14$44,900 Pending 2 DOM
ⓘ Source: listings_history table (triggers on properties + properties_extension) + one-shot
backfill from property_details.listing_events for pre-trigger history.
Tax reassessment forecast TN · Resets to sale price
- Current annual tax
- $432 · $36/mo
- Projected year-2 tax
- $432 · $36/mo
- Expected delta
- $0/yr ($0/mo · 0.0%)
ⓘ Screening estimate from a state-policy table — verify with the county assessor before closing.
Climate risk First Street
- Flood 6/10 Major FEMA zone X (unshaded) · 74% chance over 30 yrs
- Wildfire 3/10 Moderate
- Heat 6/10 Major 7 d/yr ≥105°F today · 18 d/yr by 30 yrs out
- Wind 4/10 Moderate 13% chance of damaging wind over 30 yrs
- Air quality 3/10 Moderate 2 unhealthy d/yr today · 2 by 30 yrs out
Nearby sold comps map
Loading sold comps map…
Walkable amenities ~0.75 mi
Loading nearby amenities…
Taxation est. · year 1
- Rental income
- $17,260
- − Mortgage interest
- −$2,515
- − Property taxes
- −$432
- − Insurance
- −$224
- − Repairs & maintenance
- −$1,381
- − Management
- −$1,381
- − Depreciation
- −$1,306
- Taxable income
- $10,020
- Est. tax owed @ 24.0%
- −$2,405
- After-tax cash flow
- $7,748/yr
For passive investors: Depreciation is non-cash, so a rental often shows a tax loss while cash-flowing — sheltering income. Rental losses are passive: they offset passive income freely, and up to $25,000/yr can offset ordinary (W-2) income if you actively participate and your MAGI is under $100k (phasing out to $0 by $150k); unused losses carry forward. On sale, claimed depreciation is recaptured at up to 25%, and gains may owe capital-gains tax (a 1031 exchange can defer both). Figures are a year-1 estimate at your 24.0% rate — not tax advice; consult a CPA.
Schools (NCES district)
- District
- Hamilton County
- NCES district ID
- 4701590
- Math proficiency
- 31% ▼ -10.00%
- Reading proficiency
- 31% ▼ -3.00%
- Median HH income
- $47,456
- Composite
- 26.8/100
- National rank
- #7122
- State rank
- #42 of 139 in TN
Livability — Chattanooga
- Score
- 78/100
- State rank
- #3
- US rank
- #2582
Category grades
Schools grade is shown separately in the Schools card above.
Census & demographics
- Census place
- Chattanooga, TN
- County
- Hamilton County · 312,777 people
- City population
- 131,999
- Metro
- Chattanooga, TN-GA
- Population (ZIP)
- 18,997
- Household income
- $56,579
- Rent vs Own
- Severe rent burden
- 685.0
Population outlook (Hamilton County) Hauer SSP2
- Today (2025)
- 393,784 people
- By 2030
- 412,983 · +4.9%
- By 2040
- 449,502 · +14.1%
- By 2050
- 484,341 · +23.0%
- By 2075
- 565,746 · +43.7%
- By 2100
- 618,394 · +57.0%
Race, ethnicity, and origin ACS 2023
- Neighborhood character
- Diverse neighborhood (Simpson 0.63)
- Race & ethnicity
- Black 48% White 37% Hispanic / Latino 8% Two or more races 7%
- Hispanic origin (detail)
- Mexican 3% Puerto Rican 2%
- Common ancestry
- Italian 2% Slovak 2% Romanian 1%
- Foreign-born
- 4% · Canada, Vietnam
- Languages at home
- 92% English-only · Spanish 6% Arabic 0%
Political lean MEDSL · Hamilton
- 2024 margin
- R (+13.1) · D 42.7% · R 55.7% · Other 1.6%
- 2008→2024 swing
- -1.2pp toward R · 2008: -11.8pp · 2024: -13.1pp
- All cycles
- 2024: R+13.1 2020: R+9.7 2016: R+16.6 2012: R+14.8 2008: R+11.8
Not yet ingested
- Civics
- —
Market trends
- HPI YoY
- ▼ -190.85%
- Current HPI
- 240.2557
- Rent YoY
- ▲ 0.73%
- Metro
- Chattanooga, TN-GA
- State GDP YoY
- ▲ 2.78%
- F500 in state
- 22
Industry mix (Fortune 500 HQ in TN)
| Industry | F500 HQs | Revenue |
|---|---|---|
| Healthcare | 3 | $91B |
|
||
| Retail | 3 | $72B |
|
||
| Transportation / Logistics | 1 | $88B |
|
||
| Paper / Packaging | 1 | $19B |
|
||
| Insurance | 1 | $13B |
|
||
| Energy | 1 | $12B |
|
||
Price history
2 events — show timeline
- 2026-06-12 Pending — GCAR
- 2026-06-10 Listed $44,900 GCAR
Property tax history
+1.8%/yrLatest (2025): $432 · +28.0% YoY. Source: county tax records.
Cash-flow waterfall
monthlySold comps — $/sqft
last 12 mo · ≤1 miLoading sold comps…